
Remember me


The present retrospective study received approval from the local ethics committee of the University Hospital of Leipzig (register no. 344-2007).
All consecutive patients undergoing MRI-guided liver biopsy at the University Hospital of Leipzig between the years 2012 and 2021 were analyzed in this observational study. Written informed consent was obtained from all patients before MRI-guided biopsy.
In our center, MRI-guided biopsy is mainly used for small target lesions with poor visibility on CT images.
MRI-Guided BiopsyAll MRI-guided liver biopsies were performed by trained interventional radiologists with at least 2 years of general experience in interventional radiology. The procedure plan (comprising the position and the needle pathway) was calculated using previous cross-sectional images. The length and angle of the biopsy needle were measured based on the planning scan.
All biopsies were performed in a conventional closed-bore 1.5-T MRI scanner (Magnetom Symphony and Aera, Siemens Health care, Erlangen, Germany) with a bore diameter of 60 cm and a gantry length of 150 cm.
For procedure planning, transverse images were acquired with volume-interpolated breath-hold examination (VIBE), half-Fourier single-shot turbo spin echo (HASTE) using a combination of loop and spine coils. In all cases, 10 mL of the liver-specific contrast agent gadoxetate disodium (Primovist®, Bayer HealthCare Pharmaceuticals, Berlin, Germany) was administered intravenously approximately 15 min prior to the intervention to provide a negative contrast in the VIBE sequence. The same sequence was used during the time interval of the study.
The target lesion was measured on the planning VIBE on the representative slice with the largest diameter. A biopsy tract was selected on the planning sequence to avoid penetrating large vessels.
All biopsies were performed after confirmation of the absence of coagulation disorders (platelet count of at least 50,000/mm3, activated partial thromboplastin time [aPTT] ≤ 50 s, and prothrombin time [Quick] > 50%). The procedure started with skin disinfection and local anesthesia with 10 mL lidocaine 1% (Xylocitin, Jenapharm, Germany). During the procedure, T1-weighted images were used for needle visualization and placement within the target lesion. In every case, multiple tissue samples were obtained with the biopsy system (18G semiautomatic biopsy gun, Invivo, Imaging Solutions, Shailer Park, Australia).
After removal of the biopsy needle, T1- and T2-weighted images covering the whole liver were acquired to rule out post-interventional bleeding complications.
Every form of novel fluid surrounding the liver after the intervention was defined as hematoma. The hematoma width was measured on one axial slice using the perpendicular diameter.
The diagnostic outcome of the biopsy was determined by the pathology report and with the need of re-biopsy during the clinical course of the patient.
Biopsy-Related ParametersSeveral parameters were measured as biopsy-related features on the axial MRI slices: the distance of needle entry to liver capsule, the distance of the lesion to the liver capsule, the distance of the lesion to the needle entry of the liver, the needle angle of the entry. The maximum size of the target lesion was measured with two perpendicular diameters on the largest, representative slice. Finally, the time duration of the biopsy was defined between the beginning of the planning scan to the last control sequence after the needle removal.
MRI Texture AnalysisMRI images were further analyzed with the dedicated software MaZda (version 4.7, available at http://www.eletel.p.lodz.pl/mazda/) [23, 24]. Texture analysis measurements were blindly carried out to the bioptic and clinical results. All measurements were performed by a trained radiologist with overall 4 years of experience. A region of interest (ROI) was placed on the largest slice of the target lesion using the T1-weighted VIBE sequence for biopsy planning after application of hepatic specific contrast media. The ROI was drawn within the liver lesion with 2 mm distance to the adjacent parenchyma. For each ROI, gray-level (µ) normalization was utilized to μ ± 3 standard deviations to reduce the influence of contrast and brightness variation on the texture features, as performed previously [15, 16]. Texture features of various groups were extracted for each patient including histogram parameters, second-order texture features of different groups comprising (co-occurrence matrix run-length matrix, absolute gradient, autoregressive model [theta 1 to 4, sigma], and wavelet transform features).
Altogether, 279 texture features were calculated in all lesions. A correlation analysis was performed to remove redundant texture features with a correlation coefficient larger than 0.7.
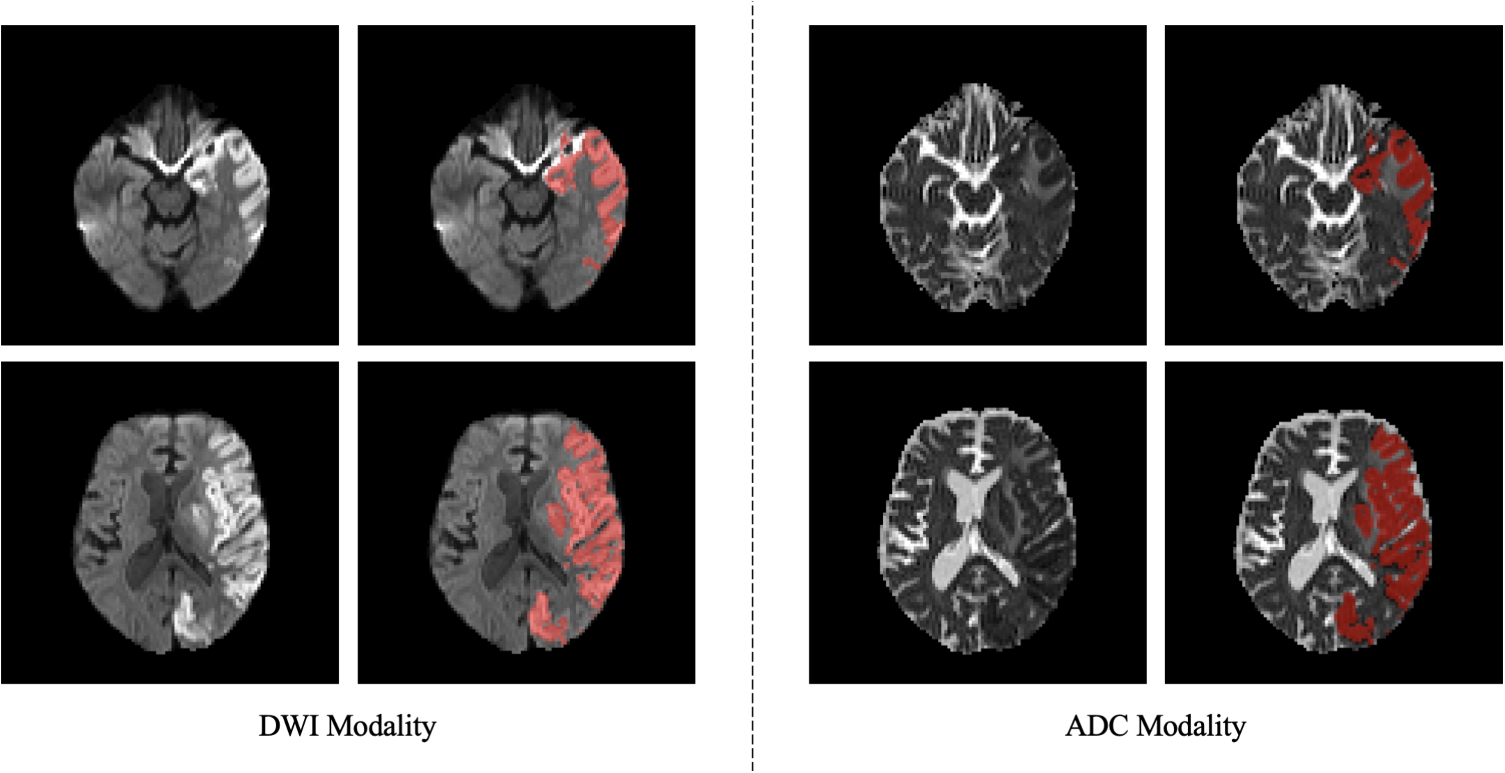
Two representative cases of the patient cohort are shown in Fig. 1 for illustrative purposes.
Fig. 1
Representative cases of the patient sample. First column: 51-year-old female patient with a diagnostic biopsy of a lesion in segment V confirmed as a metastasis of a cervical carcinoma. The biopsy needle is shown within the needle. The corresponding region of interest is marked in red. Second column: 59-year-old male patient with two unclear tumors with central hypointense signal intensity and peripherally contrast media uptake in liver segments VI and I. Slight intrahepatic cholestasis, steatosis degree 15%, moderate fibrosis, and diagnostic biopsy in segment VI with a benign outcome of the biopsy. No postinterventional hemorrhage. The corresponding region of interest is marked in red
Statistical AnalysisStatistical analysis was performed with SPSS (IBM, Version 25.0; Armonk, NY, USA). Collected data was primarily assessed with descriptive statistics. Group differences were analyzed with Mann–Whitney U test and Fisher’s exact test when suitable. Receiver operating characteristics (ROC) curve with area under the curve (AUC) analyses was used to investigate the diagnostic accuracy for the clinical and MRI texture parameters. Univariate and multivariate logistic regression analyses were performed to further elucidate the associations between MRI texture features with the investigated biopsy outcomes. A multivariate model was built using the statistically significant texture features.
In all instances, p-values below 0.05 were considered as statistically significant.
Comments (0)