Animals
Male and female CD-1 mice (6–8 weeks, 20–25 g) were purchased from Beijing Vital River Laboratory Animal Technology Co (Pinghu, Zhejiang, China). The mice were housed in a temperature-controlled animal facility with a 12 h light–dark cycle and ad libitum access to food and water. Criteria for exclusion included weight loss, disability or distress. All procedures were approved by the Animal Care and Use Committee of Ningbo University in accordance with the National Institutes of Health Guidelines for the Care and Use of Laboratory Animals (NIH Publications No. 80 − 23). Female mice were only used in the behavioral tests.
Chemicals and antibodies
ACY-1215 was purchased from Medchemexpress (Hong KONG, China) and dissolved in 10% dimethyl sulfoxide (DMSO), obtained from Sigma-Aldrich (St. Louis, MO, USA). Lipofectamine 2000 Transfection Reagent and Opti-MEM I were purchased from Thermo Fisher Scientific Life Sciences (Waltham, MA, USA). Dulbecco’s Modified Eagle Medium, Fetal bovine serum (FBS) and penicillin/streptomycin were obtained from HyClone (Logan, UT, USA). Recombinant Mouse IL-6 was purchased from ABclonal (RP01321, Ningbo, China). Antibodies against HDAC6 (#7558), STAT3 (#9139), Acetyl-STAT3 (Lys685, #2523), Phospho-STAT3 (Tyr705, D3A7, #9145), Acetyl-α-Tubulin (Lys40, D20G3, #5335), α-Tubulin (#2144), IL-1β (3A6, #12242), TNF-α (D2D4, #11948), and GFAP (Cat#3670) were purchased from Cell Signaling Technology (Danvers, MA, USA). Antibodies against Anti-CGRP (#ab81887), IBa-1(Cat#ab5076), and Lamin B1 (#ab65986), and the secondary antibody AlexaFluor 488, donkey anti-goat (Cat#ab150129) were purchased from Abcam (Cambridge, MA, USA). Neuronal marker NeuN (Cat#N21483) and IB4 (Cat#I32450), and antibody against CCL7 (Cat#38675A01) were purchased from Thermo Fisher Scientific (Waltham, MA, USA). The secondary antibody Goat anti-rabbit IgG antibody (Cat#A0208) and goat anti-mouse IgG antibody (Cat#A0216) were purchased from Beyotime (Shanghai, China). Other secondary antibodies including AlexaFluor 488, donkey anti-mouse (Cat#715-545-150), AlexaFluor 594, donkey anti-rabbit (Cat#711-585-152), and AlexaFluor 488, donkey anti-rabbit (Cat#711-545-152) were purchased from Jackson ImmunoResearch Inc. (West Grove, PA, USA).
Establishment of spared nerve injury (SNI) model
The SNI surgery was performed as previously described [31, 32]. Male and female mice were anesthetized with sodium pentobarbital (50 mg/kg, Aladdin, Shanghai, China). The right sciatic nerve was exposed at the mid-thigh region proximal to the sciatic trifurcation. Subsequently, the common peroneal and tibial nerves were ligated and excised, while the sural nerve remained intact. Sham surgery was performed without damaging the nerve, involving only exposure without lesioning.
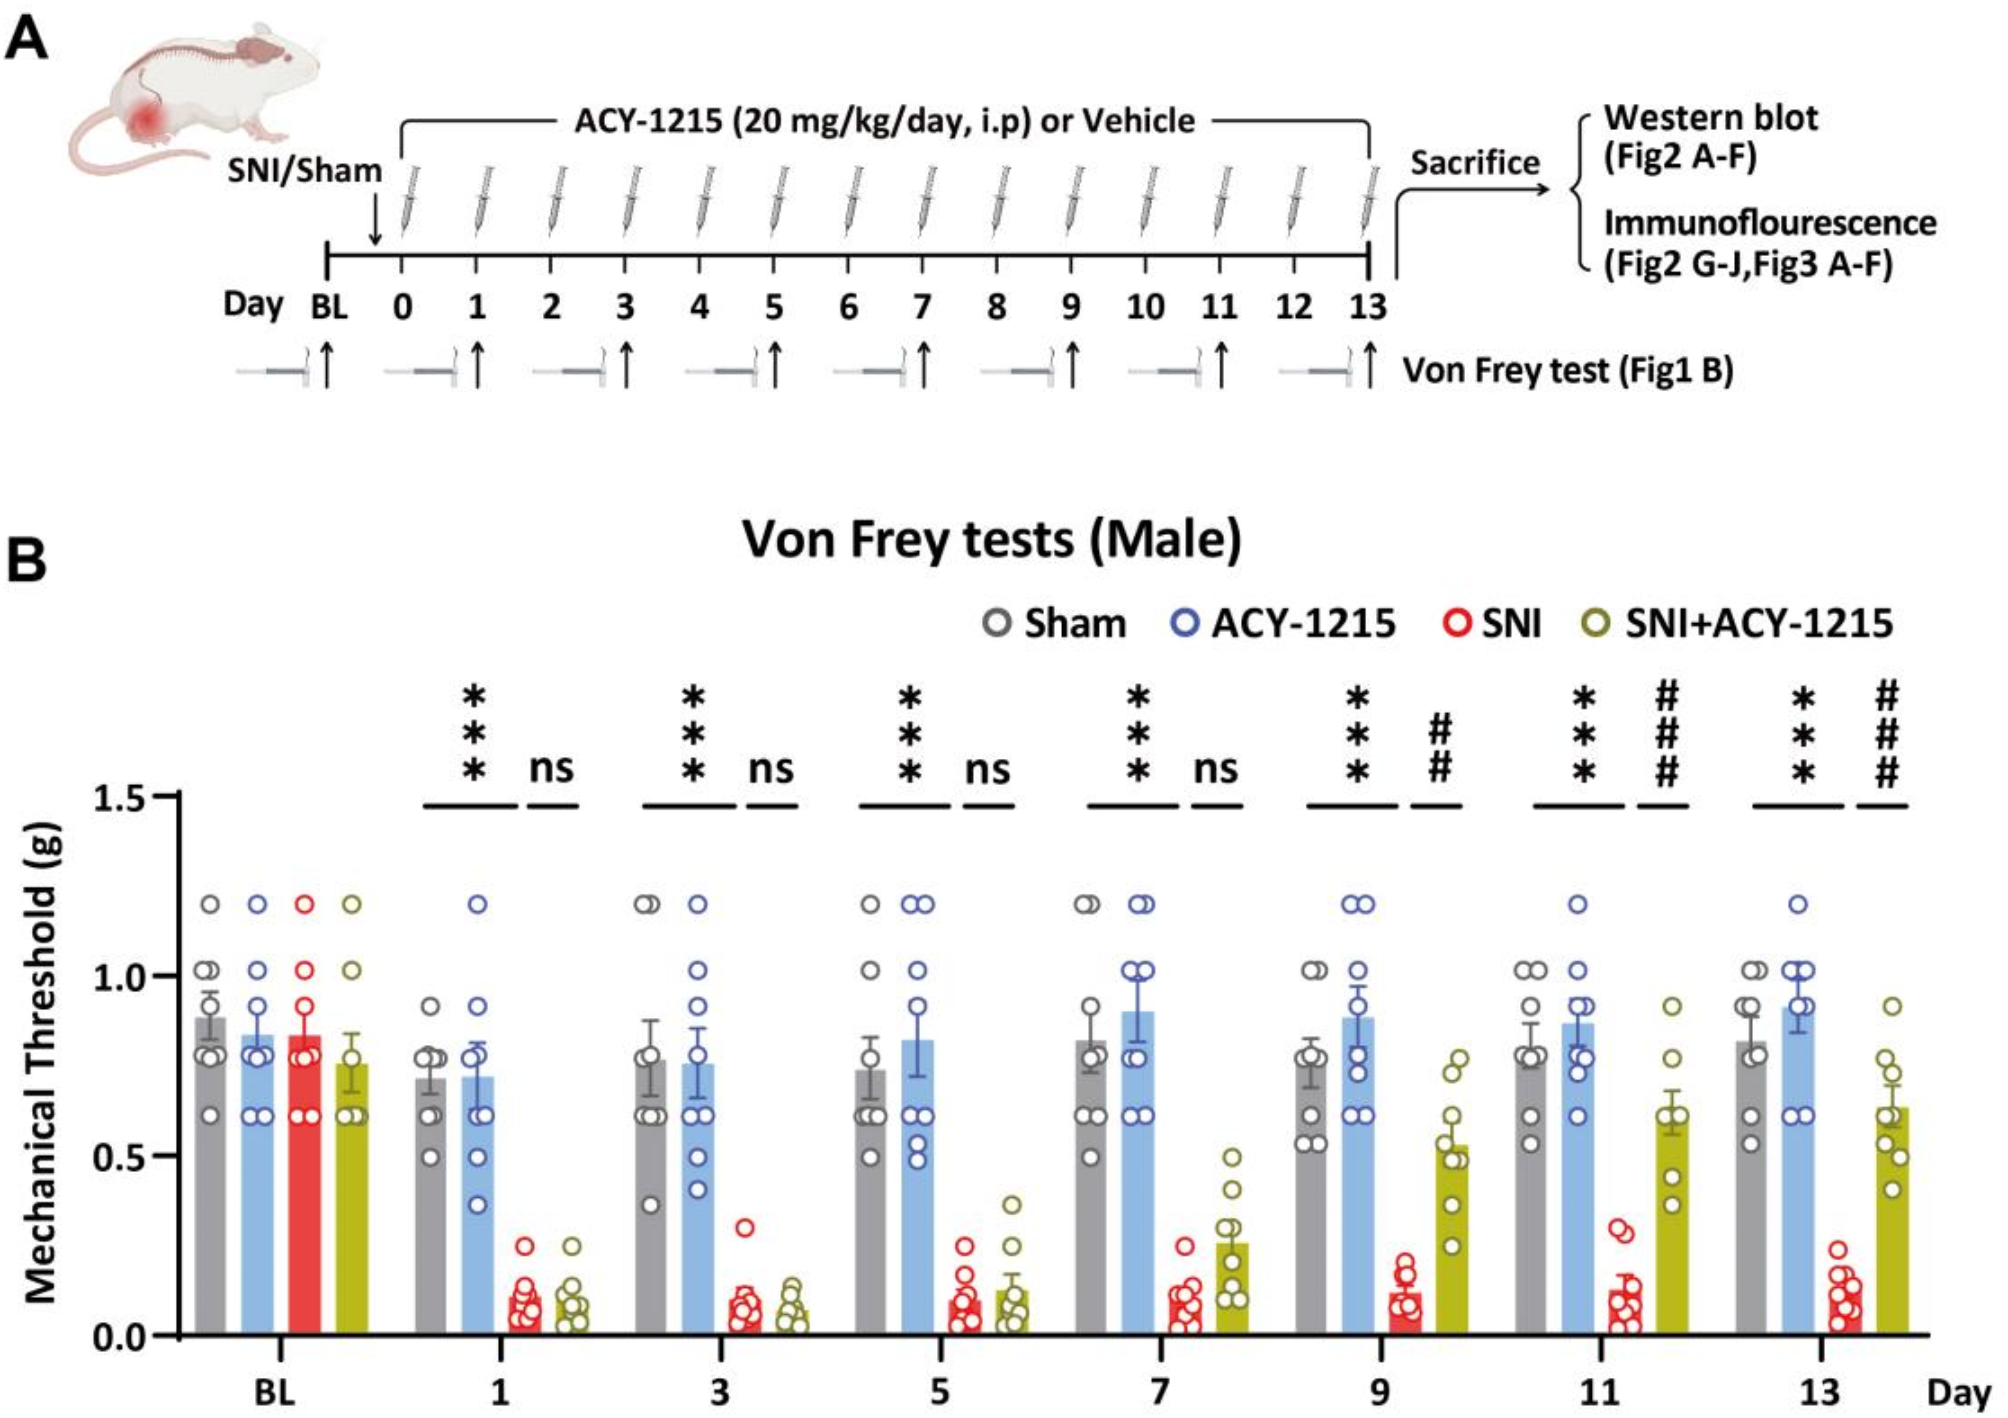
Von frey test
The Von Frey tests were performed to evaluate mechanical pain thresholds as previously described [33,34,35,36]. Briefly, mice were placed in individual transparent Perspex cubicles with a wire mesh base and allowed at least 20 min to acclimate. The filaments were applied to the plantar surface of the right hind paw in a series of ascending forces. Mechanical thresholds were determined using the up-and-down method with Von Frey filaments (Stoelting, USA).
Cell cultures and treatments
Mouse hippocampal cells (HT22) were obtained from the Chinese Academy of Sciences (Shanghai, China) and cultured in Dulbecco’s Modified Eagle Medium (DMEM) supplemented with 10% FBS and penicillin/streptomycin. The cell cultures were maintained at 37 °C in a humidified atmosphere containing 5% CO2 and 95% air. Subculturing was routinely performed every 2 or 3 days. For sample preparations, an equal number of cells were seeded into culture dishes at a density of 5 × 10⁴ cells/cm² overnight. In the case of IL-6 treatment, cells were incubated with a final concentration of 100 ng/ml of IL-6 for 12 h.
Construction of STAT3 overexpression
The STAT3 overexpression plasmid (Cat#PT7722) was constructed, and recombinant adeno-associated virus 2/9 vector carrying STAT3 overexpression plasmid with human synapsin (hSyn) neuronal promoter (AAV-hsyn-STAT3-EGFP) or the vacant controls (AAV-hsyn-EGFP) were packaged by BrainVTA (Wuhan, China).
Mice were anesthetized with Avertin (20 mg/ml, 0.2 ml per 10-gram weight). The skin overlying the spinal column was then shaved and cleaned to reduce the risk of infection. A small incision was made in the skin and a 30-gauge needle was inserted into the subarachnoid space between the L4-L6 vertebrae and around the spinal cord. The virus emulsion (1012 vg/mL, 5 µl in PBS) containing the AAV-hsyn-STAT3-EGFP or AAV-hsyn-EGFP was then intrathecally injected slowly and carefully into the space. After the injection, the incision was closed and the mice were allowed to recover. The mice were closely observed for any discomfort or complications after surgery.
Plasmid transfection and gene knockdown
HT22 cells were transfected with expression plasmids of HDAC6 or STAT3 small interfering RNA (siRNA) or control siNRA using Lipofectamine 2000 for 2 days following manufacturer’s instructions. HDAC siRNA(5′-AGA CCU AAU CGU GGG ACU GCT T-3′), STAT3 siRNA (5′-GGG ACC UGG UGU GGG AAU UAU TT-3′) or a scramble negative control (5′-UUC UCC GAA CGU GUC ACG UTT-3′) from GenePharma (Shanghai, China) were mixed with Lipofectamine 2000 in Opti-MEM I, and the mixtures were added to cells for 48 h.
Western blotting and co-immunoprecipitation (Co-IP)
For experiments involving spinal cord tissue, mice were humanely killed by CO2 inhalation. The L4-6 spinal dorsal horn tissues were dissected and homogenized in an ice-cold RIPA lysis buffer (Cat# P0013B; Beyotime, Shanghai, China) supplemented with protease and phosphatase inhibitors (Cat#A32959, Thermo Fisher). The homogenates were centrifuged at 13,200 rpm for 30 min at 4 °C. For experiments using H22 cells, cells were lysed in the RIPA lysis buffer containing the same protease and phosphatase inhibitors, followed by centrifugation under identical conditions to obtain the supernatant. Protein concentration was determined using the BCA Protein Assay Kit (Beyotime, Beijing, China). The samples were separated on 8–10% SDS-PAGE gels and transferred to PVDF membranes (Millipore, Temecula, CA, United States) [37]. Membranes were blocked with 5% skim milk in TBST buffer (20 mM Tris, 150 mM NaCl, 0.1% Tween 20; Sigma-Aldrich, USA) and subsequently incubated overnight at 4 °C with primary antibodies diluted in TBST. The following primary antibodies were used: HDAC6 (1:1000), Ac-STAT3 (1:1000), p-STAT3 (1:1000), STAT3 (1:1000), Ac-α-Tubulin (1:1000), Tubulin (1:1000), Lamin B1 (1:1000), TNF-α (1:1000), IL-1β (1:1000), and CCL7 (1:1000). After washing with TBST, membranes were incubated for 1 h at room temperature with species-appropriate secondary antibodies: goat anti-rabbit IgG (1:1000) or goat anti-mouse IgG (1:1000). Between detections, membranes were stripped using Western Blot Fast Stripping Buffer (Cat#PS107, Epizyme Biomedical Technology Co, Shanghai, China). Target bands were visualized using an Odyssey Infrared Imaging System (LI-COR Biotechnology, NE, USA), and band intensities were quantified using ImageJ analysis software (NIH, USA).
Co-IP of STAT3 was performed using an anti-STAT3 mouse monoclonal antibody, with normal mouse IgG serving as a negative control. Immune complexes were captured with 25 µl of Protein A/G PLUS-Agarose IP reagent (Santa Cruz Biotechnology, United States) for 2 h and washed 5 times with the lysis buffer [38]. The starting tissue lysates and IP products were separated on 8–10% SDS-PAGE gels and transferred to PVDF membranes (Millipore, Temecula, CA, United States). Target proteins were probed with the following primary antibodies HADC6 (1:1000), Ac-STAT3 (1:1000), STAT3 (1:1000). After washing, membranes were incubated with horseradish peroxidase-conjugated secondary antibodies Goat anti-rabbit IgG antibody (1:1000) or goat anti-mouse IgG antibody (1:1000). Protein bands were visualized using an Odyssey Infrared Imaging System (LI-COR Biotechnology, NE, USA), and band intensities were quantified using ImageJ analysis software (NIH, USA).
Cytosol and nuclear fractionation
On the 14th day post-SNI or sham surgery, mice were humanely killed by CO2 inhalation. The L4-6 spinal dorsal horn tissues were collected and homogenized in an ice-cold lysis buffer (Cat#P0013B; Beyotime, Shanghai, China) containing protease and phosphatase inhibitors (Cat#A32959, Thermo Fisher). The homogenates were centrifuged at 13,200 rpm for 30 min at 4 °C to obtain the supernatant. Cytoplasmic and nuclear protein fractionation were isolated using a Nuclear Extraction Kit (#2900, Merck Millipore, United States) according to the manufacturer’s protocol. The purity of the cytosolic and nuclear fractions was examined by Western blot analysis using primary antibodies targeting α-Tubulin (1:1000; cytosolic marker) and Lamin B1 (1:1000; nuclear marker) [7], followed by species-appropriate secondary antibodies: goat anti-rabbit IgG antibody (1:1000) or goat anti-mouse IgG antibody (1:1000). Protein bands were detected using an Odyssey Infrared Imaging System (LI-COR Biotechnology, NE, USA), and band intensities were quantified using ImageJ analysis software (NIH, USA).
Enzyme-linked immunosorbent assay (ELISA)
The ELISA was performed as previously described [36]. On the 14th day post-SNI or sham surgery, mice were humanely killed by CO2 inhalation and L4-6 spinal cords were harvested. Tissue were rinsed with cold PBS and homogenized for ELISA assays of (#E-MSEL-M0002, Elabscience, China), IL-1β (#E-MSEL-M0003, Elabscience, China), and CCL7 (#ab250071, Abcam, Cambridge, MA, USA). Reagents and working standards were prepared according to the manufacturer’s instructions, and the assay was performed following the provided protocol. Absorbance was measured at 450 nm using a microplate spectrophotometer (Thermo Inc, USA).
Multiplex cytokine and chemokine analysis
On day 14 post-SNI or sham surgery, mice from the Sham, SNI, and SNI + ACY-1215 groups were euthanized humanely via CO2 inhalation. The L4–L6 spinal cord tissues were collected, homogenized in ice-cold lysis buffer (Cat#P0013B; Beyotime, Shanghai, China) containing protease and phosphatase inhibitors (Cat#A32959, Thermo Fisher), and centrifuged at 13,200 rpm for 30 min at 4 °C. Protein concentrations were determined using a BCA Protein Assay Kit (Beyotime, Beijing, China).
Multiplex cytokine and chemokine analysis was performed using the Bio-Plex Pro Mouse Chemokine Panel 31-plex (BIO-RAD Lab, Inc, Hercules, CA, USA). The assay was conducted according to the manufacturer’s instruction, and individual samples from each mouse in each group were analyzed.
Immunofluorescence and image analysis
Mice were anesthetized with Avertin (20 mg/ml, 0.2 ml per 10-gram weight) and intracardially perfused with saline followed by 4% paraformaldehyde (Solarbio, Beijing, China, Cat. No. P1110) in 0.1 M phosphate buffer. The L4-6 spinal tissue was dissected, fixed in 4% paraformaldehyde overnight at 4 °C, and sequentially transferred to 15% and then 30% sucrose in 0.1 M phosphate buffer solution at 4 °C. Tissues were sectioned at 20 μm using a cryostat (CM1950, Leica, Germany). Sections were blocked with 10% normal donkey serum in 0.01 M phosphate-buffered saline containing 0.3% Triton X-100 (Cat#P0096; Beyotime, Shanghai, China) for 1 h at room temperature. Spinal cord sections were then incubated overnight at 4 °C with the following primary antibodies or marker: HACD6 (1:100), p-STAT3 (1:100), GFAP (1:200), Iba-1 (1:200), CGRP (1:200), NeuN (1:200), IB4 (1:500). After washing by PBST (PBS with 0.1% Tween20, Solarbio, Beijing, China), sections were incubated for 2 h at room temperature with the species-appropriate secondary antibodies: AlexaFluor 488, donkey anti-mouse (1:400), AlexaFluor 594, donkey anti-rabbit (1:400), AlexaFluor 488, donkey anti-rabbit (1:400), AlexaFluor 488, donkey anti-goat (1:200). Sections were mounted on slides using a mounting medium and stored at 4 °C. Fluorescence images were captured using a confocal scanning laser microscope (SP8, Leica, Germany). Quantitative analysis was conducted using LASX software (Leica, Germany) and was further analyzed with ImageJ software (NIH, USA). For each group, images were obtained from at least five mice. Related spinal regions were manually outlined as regions of interest (ROIs), and the total fluorescent intensities in the ROIs per unit area were calculated. The relative fluorescent intensity was expressed as fold change compared to the control group.
Statistical analysis
Data shown in the graphs represent the means ± S.E.M. Analyses were performed using GraphPad Prism 8 software (GraphPad Software, San Diego, CA, United States). The data distribution was determined using the Shapiro-Wilk normality test and parametric or non-parametric tests were chosen accordingly. Unpaired t-test, One-way or two-way analysis of variance (ANOVA) followed by post hoc test was used as indicated in figure legends. A significance level of P < 0.05 was considered statistically significant.


Comments (0)