
Remember me


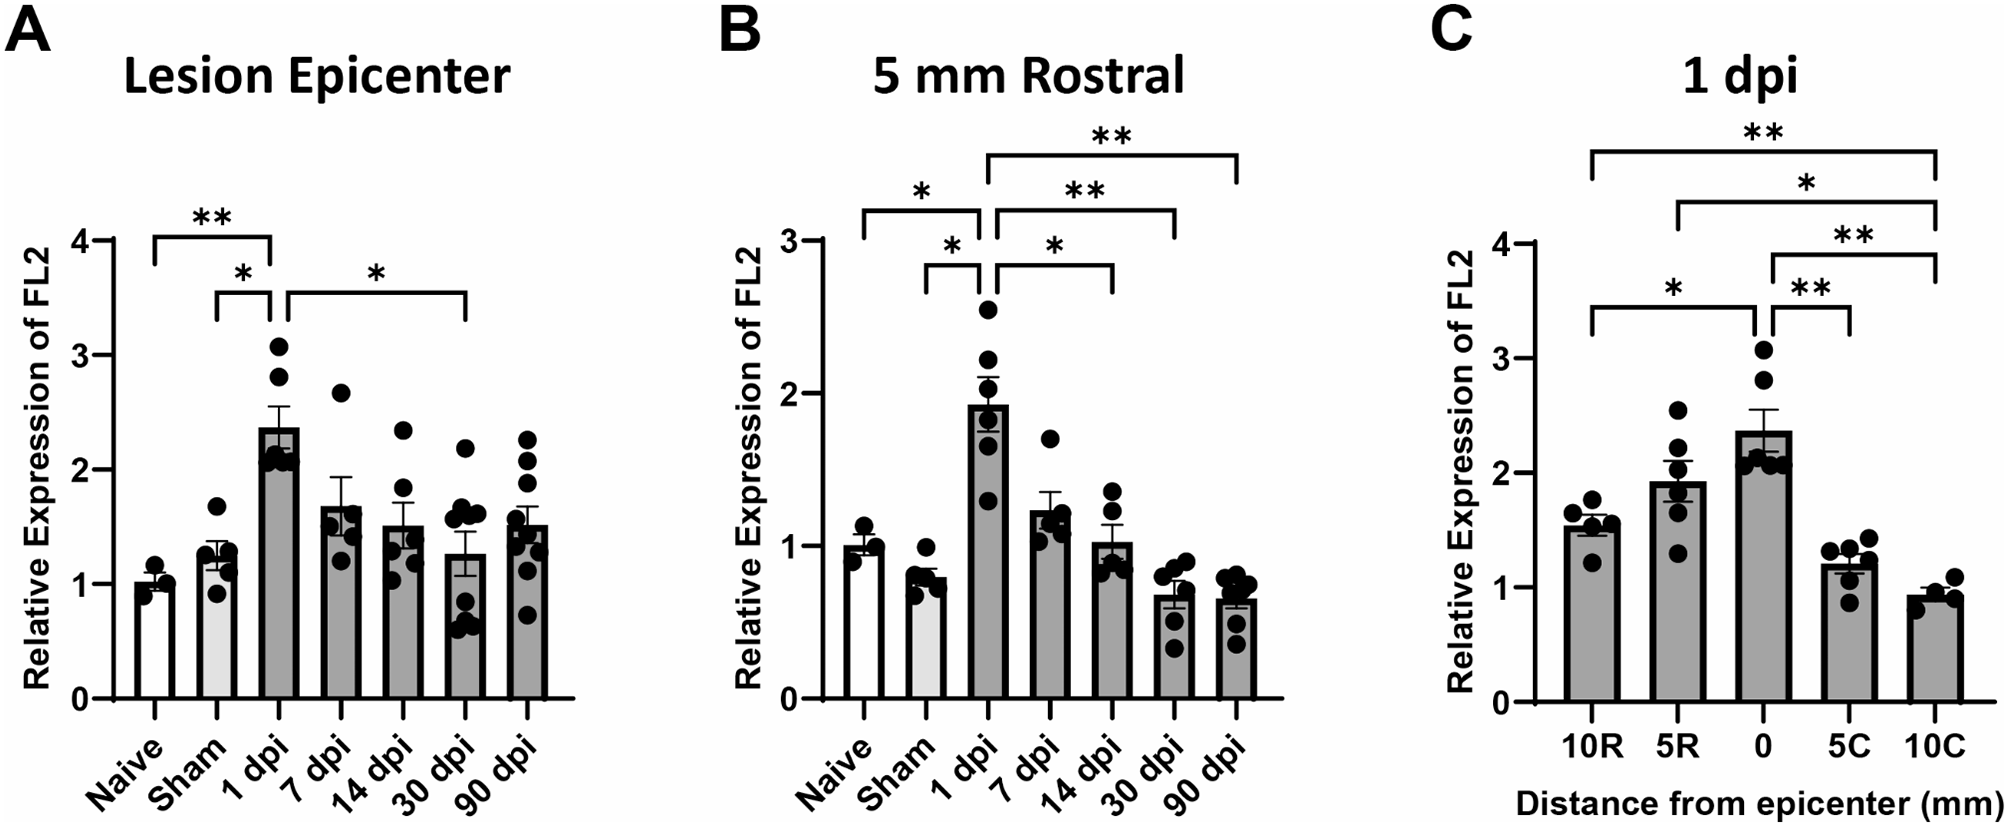


FL2 mRNA levels in spinal cord samples were quantified with RT-qPCR to assess temporal and spatial expression changes. SCI increased the expression of FL2 in the 5 mm segment of the lesion site (Fig. 1A; p = 0.001, Welch’s ANOVA test with Dunnett’s T3 post hoc tests). FL2 expression was significantly increased in the lesion as early as 1 dpi compared to naive (p = 0.007) and sham (p = 0.02). There were no significant differences in FL2 expression compared to naive or sham between 7 and 90 dpi. In comparison to the elevated FL2 levels at 1 dpi, FL2 expression was significantly reduced at 30 dpi (p = 0.02). A similar pattern of significant differences in FL2 expression was found in the 5 mm segment rostral to the lesion segment (Fig. 1B; p < 0.001, Welch’s ANOVA test with Dunnett’s T3 post hoc tests). FL2 expression was significantly increased rostral to the lesion at 1 dpi compared to naive (p = 0.04) and sham (p = 0.01). In comparison to the elevated FL2 levels at 1 dpi, FL2 expression was significantly reduced at 14 dpi (p = 0.04), 30 dpi (p = 0.007), and 90 dpi (p = 0.007). No significant increases in FL2 expression were observed 5 mm caudal to the lesion at 1 dpi or 10 mm rostral and caudal between 1 and 90 dpi (Supplementary Figure S1).
Fig. 1
FL2 mRNA levels are increased at the lesion and directly rostral to the lesion after SCI. Relative quantities of Fignl2 (FL2) mRNA at the T9 lesion site (A) and 5 mm rostral to the lesion (B) over time after contusion spinal cord injury. The samples were normalized to naive samples from 3 animals at the same spinal cord level. (C) FL2 levels 1 dpi plotted by distance rostral (R) or caudal (C) to the epicenter of the lesion. FL2 mRNA levels were quantified using the ddCT method and normalized to the housekeeping gene Prkg1. N = 3–9/group. Brown-Forsythe and Welch ANOVA with Dunnett’s multiple comparison tests. *p < 0.05, **p < 0.01. Bars represent mean ± SEM
To further assess the spatial expression of FL2 at 1 dpi, mRNA levels were compared between the different segments of the injured spinal cord. There were significant differences among spinal cord segments (Fig. 1C; p < 0.0001, Welch’s ANOVA test with Dunnett’s T3 post hoc tests), showing that FL2 was increased in the lesion site compared to 10 mm rostral (p = 0.04), 5 mm caudal (p = 0.006), and 10 mm caudal (p = 0.002). FL2 expression was also increased at 5 mm rostral (p = 0.01) and 10 mm rostral (p = 0.007) compared to 10 mm caudal. These results indicate that FL2 expression is acutely upregulated after SCI in the lesion and immediately rostral to the lesion.
Effects of FL2 siRNA on locomotor recovery after SCIIn order to determine whether FL2 knockdown has a therapeutic effect on functional recovery after SCI, rats received nanoparticle-encapsulated FL2 siRNA (SiFi2) or negative control siRNA (SiCon) administered immediately after SCI before undergoing functional assessments up to 28 dpi. Hindlimb locomotor function was evaluated weekly with the BBB locomotor grading scale. All injured animals exhibited hindlimb paralysis (BBB < 5) at 1 dpi. Over the course of recovery, SiFi2 improved gross locomotor skills, with a significant main effect after SCI in comparison to SiCon (Fig. 2A, p = 0.046, two-way ANOVA with Šídák multiple comparison tests.). SiFi2 treatment significantly increased BBB score at 28 dpi (p = 0.03) with an average 2.75 point locomotor improvement compared to SiCon.
Fig. 2
FL2 siRNA (SiFi2) improved functional recovery after SCI. (A) Time course of BBB locomotor scale scores following contusion spinal cord injury. FL2-siRNA (SiFi2) and non-targeting siRNA (SiCon) show significant recovery compared to 1 dpi. SiFi2 increased BBB score compared to SiCon. N = 12/group, repeated measures two-way ANOVA with Šídák multiple comparison tests. (B) Representative footprint analysis using the DigiGait™ gait analysis. (C) Left hindlimb (LH) and (D) right hindlimb (RH) paw angle measurements. SiCon rats exhibited more rotation compared to naive animals whereas SiFi2 returned paw angle to naive values, suggesting a restoral of corticospinal tract control of the hind paws. N = 8/group. One-way ANOVA with Dunnett’s multiple comparison tests. *p < 0.05, **p < 0.01, ns = not significant. Bars represent mean ± SEM
Gait analysis was performed with DigiGait™ to quantitatively assess locomotor kinematics at 21 dpi derived from digital footprints (Fig. 2B). Results showed a significant effect on paw angle with SCI and siRNA administration (Fig. 2C, p = 0.02, one-way ANOVA with Dunnett post hoc tests). SiCon rats demonstrated impaired paw rotation after SCI with significantly externalized left hind paw angle by − 20 degrees on average compared to naive rats (p = 0.004). SiFi2 rats showed significant improvement of the left hind paw angle, returning to within the range of paw angles exhibited by the naive rats (p = 0.01). SiCon rats exhibited similar externalized right hind paw angles compared to naive rats (Fig. 2D, p = 0.04, one-way ANOVA with Dunnett post hoc tests), but improvement with SiFi2 did not reach statistical significance (p = 0.07). These results suggest that SiFi2 promoted corticospinal tract (CST) control of the hind paw rotation [37].
FL2 siRNA reduces chronic microglial presence and increases oligodendrocytesTo determine if acute FL2 downregulation resulted in chronic changes in histopathology at the lesion site, immunohistochemistry was performed at 28 dpi (Fig. 3A). Immunostaining for microglia (Iba1) and oligodendrocytes (CC1) showed significant changes, with reduced Iba1 and increased CC1 immunopositive pixel density at the lesion epicenter after SiFi2 treatment (Fig. 3B–C; p = 0.027, p = 0.002, respectively, unpaired t-tests). Quantitation of number of neurons (NeuN) in the perilesion gray matter or astrocytes (GFAP) in the scar surrounding the lesion showed no significant difference between groups (Fig. 3D, E; p = 0.27, p = 0.45, respectively, unpaired t-test).
Fig. 3
FL2 siRNA significantly alters microglia and oligodendrocytes in the lesion after SCI. (A) Representative immunofluorescence images of Iba1 (microglia, green), CC1 (oligodendrocytes, white), NeuN (neurons, blue), and GFAP (astrocytes, red) in the lesion epicenter (Iba1, GFAP) or in the penumbra (CC1, NeuN) at 28 dpi after SCI with siRNA (SiCon) or FL2 siRNA (SiFi2) treatment (20X; scale bar = 50 μm). Quantification of pixel density of Iba1 (B) and CC1 (C) shows that SiFi2 altered the response, with a significant reduction in Iba1 and a significant increase in CC1. Count of NeuN positive cells (D) or GFAP pixel density (E) did not show a statistically significant difference between groups. N = 5/group. Unpaired t-tests. *p < 0.05, **p < 0.01, ns = not significant. Bars represent mean ± SEM
SCI and FL2 siRNA effects on acute gene expressionGSEA was conducted to identify functional gene pathways that may explain the long-term improvements after acute FL2 downregulation. KEGG pathway enrichment was analyzed at 1, 4, and 7 dpi for the following comparisons: Sham + SiCon vs. SCI + SiCon, Sham + SiCon vs. Sham + SiFi2, and SCI + SiCon vs. SCI + SiFi2. The complete lists of significant KEGG pathways resulting from analyses are available in Supplementary Materials (Supplementary Tables S2–S10).
SCI induced many significantly enriched KEGG pathways, as shown in comparisons between SCI + SiCon compared to Sham + SiCon (Supplementary Figure S2). There were 60, 60, and 63 significant gene sets at 1, 4, and 7 dpi, respectively. Upregulated pathways included immune responses (cytokine-cytokine receptor interaction, hematopoietic cell lineage, and chemokine signaling) and cell death (apoptosis, p53 signaling). Downregulated pathways included neuronal function (neuroactive ligand-receptor interaction, long-term potentiation, long-term depression) and mitochondrial respiration (oxidative phosphorylation, Parkinson’s disease).
GSEA identified significantly enriched pathways in groups that received SiFi2 at all time points compared to groups that underwent the same injury condition and received SiCon. Significant results from 1, 4, and 7 dpi are shown in Fig. 4.
Fig. 4
Gene set enrichment analysis (GSEA) of all genes in the spinal cord with FL2 siRNA. Lollipop plots depicting statistically significant gene pathways identified in GSEA comparing control siRNA (SiCon) and FL2 siRNA (SiFi2) treatment in the acute stage after sham (A–C) or SCI (D–F). The X axis shows the normalized enrichment score (NES), which indicates the degree to which genes in a particular set were upregulated (positive) or downregulated (negative) while accounting for the size of each gene set. The Y axis lists the individual KEGG pathways. The dot size is proportional to the total number of genes within each pathway (Set size). The dot color displays the range of adjusted p values < 0.05
SiCon vs. SiFi2 Day 1 ShamIn order to examine the transcriptomic effect of SiFi2 in the uninjured spinal cord, GSEA was performed between sham groups. One day after sham surgery, SiFi2 administration led to 11 upregulated and 3 downregulated statistically significant pathways compared to SiCon (Fig. 4A). The upregulated pathways included immune responses (toll-like receptor signaling, hematopoietic cell lineage, cytokine-cytokine receptor interaction) and neuronal signaling (neuroactive ligand-receptor interaction). Common genes in these pathways were related to chemokine signaling (Cxcl11, Cxcl10, Ccl20, Cxcl1), pro- and anti-inflammatory cytokines (Il6, Il11, Il1b), and T cell activity (Cd8a, Ciita, Rt1-Da). There was also increased expression of genes related to neuronal receptors (Drd1, Chrnb3, Gpr156, Htr6, Gabrr2). The downregulated pathways included mitochondrial function (oxidative phosphorylation, Parkinson’s disease). Common genes among these pathways involved mitochondrial respiration (Cox6a2, Cox4i2, Uqcrb, NDUF family genes).
SiCon vs. SiFi2 Day 4 ShamFour days after sham surgery, SiFi2 administration led to 5 upregulated statistically significant pathways compared to SiCon (Fig. 4B). The upregulated pathways included immune response pathways (natural killer-cell mediated cytotoxicity, Fc epsilon RI signaling, JAK/STAT signaling). Common genes in these pathways were related to Fc immunoreceptors (Fcer1g, Fcgr3a). Among the largest fold changes in these pathways were genes related to kininogen (Kng1), phospholipase A2 (Pla2g2a, Pla2g5), and the peripheral immune response (Il2rb, Ncr3, Klrk1).
SiCon vs. SiFi2 Day 7 ShamSeven days after sham surgery, SiFi2 administration led to 6 upregulated and 2 downregulated statistically significant gene sets compared to SiCon (Fig. 4C). The upregulated pathways included immune responses (toll-like receptor signaling, natural killer cell-mediated cytotoxicity, cytokine-cytokine receptor interaction). Common genes in these pathways were chemokines (Cxcl11, Cxcl9) and immune cell receptor signaling (Pik3r5, Vav1). The downregulated pathways included mitochondrial function (oxidative phosphorylation, Parkinson’s disease). Common genes in these pathways involved mitochondrial respiration (Cox6a2, Uqcrb, and NDUF family genes).
SiCon vs. SiFi2 Day 1 InjuryIn order to explore the transcriptomic effect of SiFi2 as a therapy, GSEA was performed at the same time points after SCI. At 1 dpi, SiFi2 administration led to 7 upregulated and 8 downregulated statistically significant pathways compared to SiCon after SCI (Fig. 4D). The upregulated pathways included those that intersect mitochondrial function and inflammation (oxidative phosphorylation, Parkinson’s disease, Alzheimer’s disease) and neuronal signaling (neuroactive ligand-receptor interaction). Common genes among these pathways were related to mitochondrial respiration [NADH: ubiquinone oxidoreductase core subunits (MT-ND and NDUF family genes)] and prostaglandin synthesis (Cox1, Cox2). The largest fold changes in these pathways involved pro-inflammatory cytokines (Il1b), neuronal receptors (Chrnb4, Kiss1r, Chrna3, Gabra5, Trpv1), and axon integrity/neuronal survival (Uchl1, Bdnf, Atp1a3). The downregulated pathways included peripheral immune responses (primary immunodeficiency, natural killer cell-mediated cytotoxicity) and cell division (cell cycle, homologous recombination). Common genes in these pathways were related to T cell activity (Icos, Cd8a), MHC antigen presentation (Ciita, Rt1-M6-2), and mitosis (Pttg1, Espl1, Plk1, Ccnb1, Ccna2). Some of the genes with more extreme negative fold changes were related to the peripheral immune response (Siglec, Klrk1).
SiCon vs. SiFi2 Day 4 InjuryAt 4 dpi, SiFi2 administration led to 10 upregulated and 5 downregulated statistically significant gene sets compared to SiCon after SCI (Fig. 4E) The upregulated pathways included immune responses (cytokine-cytokine receptor interaction, hematopoietic cell lineage, chemokine signaling) and neuronal signaling (neuroactive ligand-receptor interaction). Common genes in these pathways were chemokine ligands (Ccl20, Cxcl6, Ccl21, Cxcl13, Cxcl2), cytokines (Il6, Il11, Il2ra), and growth factors (Fgf7). Other leading-edge upregulated genes were related to kininogen (Kng1), phospholipase A2 (Pla2g2a) and neuronal receptors (Chrna3, Ntrk1, Trpv1, Cacng5, Chrnb3). The downregulated pathways were primarily related to cell division (DNA replication, Cell cycle). Common genes in these pathways were involved in mitosis (Prim2, Pttg1, Espl1).
SiCon vs. SiFi2 Day 7 InjuryAt 7 dpi, SiFi2 administration led to 37 upregulated and 5 downregulated statistically significant gene sets compared to SiCon after SCI (Fig. 4F). The upregulated pathways included cell adhesion (ECM receptor interaction, focal adhesion) and immune responses (hematopoietic cell lineage, cytokine-cytokine receptor interaction, JAK/STAT signaling). Common genes in these pathways were related to cell-to-matrix interactions (Tnn, Thbs1), phagocytosis (Cd36, Cd68), tissue remodeling (Mmp9, Fn1, Lama2, Ctsk, Acp5), TGF-β signaling (Amh, Tgfbr2, Tgfbr1, Tgfb1), peripheral immune cells (Cd3e, Nfatc4, Cd8a, Cd8b, Ncf2), integrins (Itga2, Itgb2, Itga4), cytokine signaling (Il20rb, Il6, Il2rg) and chemokine signaling (Cxcl6, Ccl7, Cxcr4). The secreted neuroregulatory protein Spp1 was also among leading-edge genes. The downregulated pathways primarily included neuronal signaling (neuroactive ligand-receptor interaction, long-term potentiation, long-term depression) and calcium signaling (calcium signaling, cardiac muscle contraction). Common genes in these pathways were related to both neuronal receptors and calcium signaling (Trhr, Htr2c, Grin1, Prkcg, Grm1). Also among the top downregulated genes were those for neurofilaments (Nefl, Nefh, Nefm).
Differential expression analysisWe also performed differential expression analysis to evaluate individual genes. The complete lists of differentially expressed genes identified after SCI alone are available in Supplementary Materials (Supplementary Tables S11–S13). No statistically significant genes were found between sham groups. Three differentially expressed genes were identified in comparisons between SCI + SiCon and SCI + SiFi2. SiFi2 significantly increased carbonic anhydrase 3 (Car3) (log2FC = 3.68, p adj = 0.02) at 1 dpi, increased prostaglandin-endoperoxidase synthase 2 or cyclooxygenase 2 (Ptgs2, Cox2) (log2FC = 1.23, p adj < 0.001) at 4 dpi, and decreased serine hydrolase like 2 (Serhl2) (log2FC = − 1.03, p adj = 0.04) at 4 dpi.
Increased FL2 expression and knockdown in the lesion colocalizes with microglia/macrophages after SCISince FL2 siRNA had significant effects on immune pathways, particularly at 4 dpi around the peak of the microglial response, we sought to further investigate SiFi2 and microglia/macrophages after SCI. Dual in situ hybridization and immunohistochemistry enabled us to quantify FL2 mRNA levels and assess localization with the protein Iba1 immunostaining for microglia and macrophages within the lesion (Fig. 5A). As previously shown in qPCR results at 1 dpi, SCI increased total FL2 expression in the lesion at 4 dpi, as shown between Sham + SiCon and SCI + SiCon (Fig. 5B, p = 0.049). Meanwhile, FL2 knockdown was confirmed between SCI + SiCon and SCI + SiFi2 (p = 0.01), demonstrating that SiFi2 administration prevented FL2 upregulation in the lesion site up to 4 dpi. SCI increased FL2 within Iba1+ regions at this time point (Fig. 5C, p < 0.0001). SiFi2 significantly reduced FL2 puncta in Iba1+ regions compared to SiCon (p = 0.008). Therefore, microglia and macrophages may be some of the cell types that upregulate FL2 after SCI.
Fig. 5
FL2 expression and microglia/macrophages visualized with dual in situ hybridization and immunohistochemistry after SCI. (A) Representative fluorescent images of dual in situ hybridization for FL2 (green) and Iba1 immunohistochemistry (magenta) with DAPI (blue) in the lesion at 4 dpi (20X; scale bar = 50 μm). High-magnification views show boxed regions of interest from merge images (scale bar = 20 μm). (B) Quantification of total FL2 as RNA puncta indicates a significant SCI-induced increase of FL2 and knockdown with FL2 siRNA (SiFi2) compared to control siRNA (SiCon). (C) Quantification of colocalized FL2 puncta in Iba1 indicates a significant SCI-induced increase of FL2 in microglia/macrophages and knockdown with SiFi2 compared to SiCon. N = 5/group. Two-way ANOVA with Šídák multiple comparison tests. *p < 0.05, **p < 0.01, ****p < 0.0001. Bars represent mean ± SEM
FL2 siRNA increases SCI-induced microglial accumulationThe accumulation of microglia and macrophages in the lesion or laminectomy site at 4 dpi was assessed with Iba1 and P2RY12 immunostaining (Fig. 6A). SCI + SiCon tissue showed significantly greater area occupied by Iba1+ microglia/macrophages as a percentage of area compared to Sham + SiCon (Fig. 6B, p = 0.02, two-way ANOVA with Šídák post hoc tests), demonstrating the recognized microglial/macrophage response to SCI. The percent area of Iba1+ microglia/macrophages was further increased by SiFi2 compared to SiCon after SCI (p = 0.03). P2RY12, which is more specific to microglia, also occupied a significantly greater percentage of the area after SCI + SiCon compared to Sham + SiCon (Fig. 6C, p < 0. 0001, two-way ANOVA with Šídák post hoc tests). The percent area of P2RY12+ microglia was further increased by SiFi2 compared to SiCon after SCI (p = 0.01). These results confirm that SiFi2 promotes the accumulation of microglia in the lesion after SCI.
Fig. 6
FL2 siRNA increases microglial accumulation in the lesion after SCI. (A) Representative immunofluorescence images of Iba1+ microglia/macrophages and P2RY12+ microglia cells (green) with DAPI (blue) in the lesion at 4 dpi after SCI and control siRNA (SiCon) or FL2 siRNA (SiFi2) treatment (20X; scale bar = 50 μm). Quantification of area occupied by Iba1+ microglia/macrophages (B) and P2RY12+ microglia (C) shows that SiFi2 increased microglia in the lesion site. N = 5/group. Two-way ANOVA with Šídák multiple comparison tests. *p < 0.05, ****p < 0.0001. Bars represent mean ± SEM
FL2 siRNA selectively increases acute neuroinflammationTo determine if FL2 downregulation led to acute changes in major inflammatory proteins at the lesion site, immunohistochemistry was performed at 4 dpi (Fig. 7A). The immunostaining of all inflammatory markers was significantly increased after injury compared to sham. The sham-injured tissue showed little or no staining for any marker, and no significant difference was observed between sham treatment groups. Immunostaining for inflammatory cytokines showed significant increases after SCI + SiFi2 treatment compared to SiCon, including pro-inflammatory IL-1β (Fig. 7B, p < 0.0001, two-way ANOVA with Šídák post hoc tests) and anti-inflammatory TGF-β1 (Fig. 7C, p = 0.048, two-way ANOVA with Šídák post hoc tests). The phagocytic marker CD68 was also increased after SCI + SiFi2 compared to SiCon (Fig. 7D, p = 0.01, two-way ANOVA with Šídák post hoc tests). In contrast, the pro- and anti-inflammatory enzymes iNOS and ARG1 showed no significant difference between SiFi2 and SiCon after SCI. (Fig. 7E, F, two-way ANOVA with Šídák post hoc tests). These results indicated that SiFi2 selectively increased the expression of some proteins, both pro- and anti-inflammatory, in the lesion following SCI.
We tried to determine if FL2 downregulation altered acute lipid accumulation at the lesion site after SCI, as this pathological debris is typically cleared by microglia and macrophages. However, ORO staining showed no significant differences between SiFi2 and SiCon at 4 dpi (Supplementary Figure S3).
Fig. 7
Inflammatory gene expression in the lesion after SCI and FL2 siRNA. (A) Representative immunofluorescence images of IL-1β (white), TGF-β1 (blue), CD68 (green), iNOS (red), and ARG1 (magenta) in the lesion 4 days after SCI or sham surgery and control siRNA (SiCon) or FL2 siRNA (SiFi2) treatment (20X; scale bar = 50 μm). IL-1β (B), TGF-β1 (C), and CD68 (D) after were significantly increased with SiFi2 compared SiCon after SCI. Neither iNOS (E) nor ARG1 (F) were significantly changed between treatments after SCI. N = 5/group. Quantification of Two-way ANOVA with Šídák multiple comparison tests. *p < 0.05, ***p < 0.001, ****p < 0.0001. Bars represent mean ± SEM
Comments (0)