
Remember me


Overall, 441 studies were identified by searching the databases. After removing the duplicates, 136 studies were selected for detailed evaluation. Thirteen studies were selected after reading the titles and abstracts and their full texts were retrieved. After reading the full text, six studies, including five RCTs [19, 20, 23,24,25] and one non-RCT [26], were included in the meta-analysis. The literature screening process is presented in Supplementary File 1.
Basic characteristics and quality of the included literatureThe features of the included studies are summarized in Table 1. A total of 609 patients requiring tracheotomy were included, of whom 308 underwent ultrasound-guided PDT and 301 underwent landmark-guided PDT. The sample size of each study ranged from 23 to 321. The ultrasound-guided PDTs included in six studies were performed under real-time ultrasound guidance. One study [23] used three percutaneous tracheotomy procedures: long-axis ultrasound, short-axis ultrasound, and anatomical markers. The incidence of major bleeding and perioperative complications was reported in all six studies. Five studies [19, 20, 23, 25, 26] reported the tracheotomy procedure times and first puncture success rates. The included RCTs had Jadad scores between 2 and 4. Rudas [24] described the implementation of randomization and blinding methods. The other four studies [19, 20, 23, 25] only mentioned randomization and did not describe its implementation in detail. Dinh’s study [26] had an NOS score of 8, and control for confounding factors was not reported in the article. The quality assessment results of all the included studies are shown in Table 2.
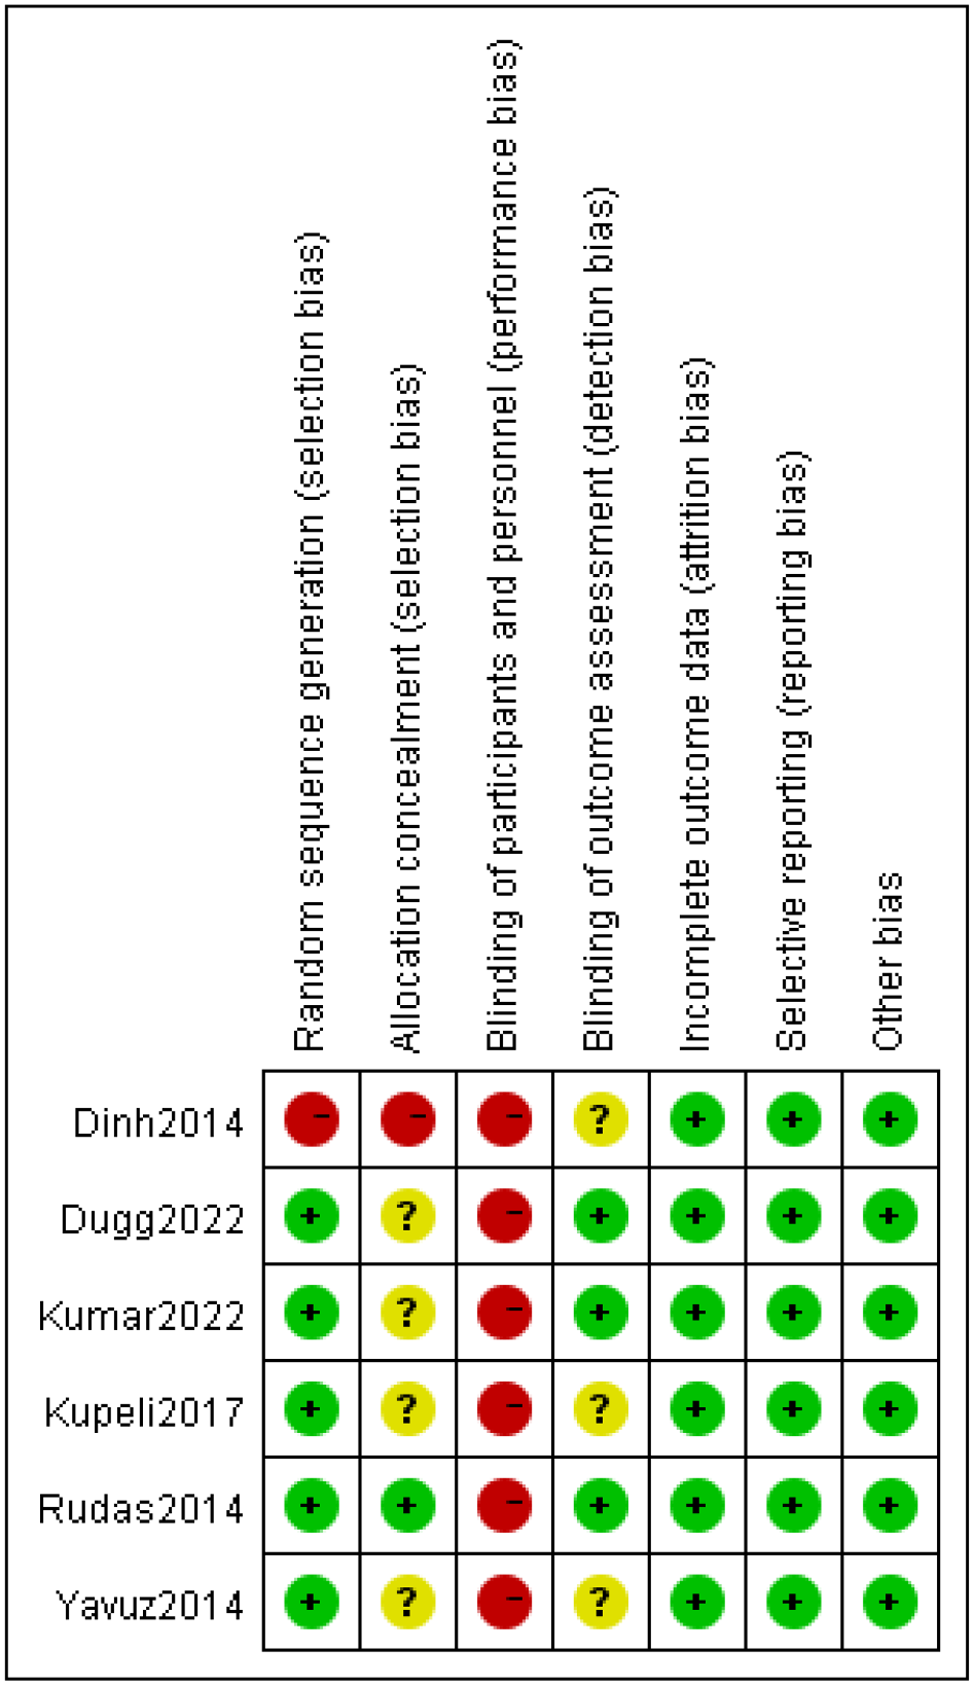
Table 1 Characteristics of included studiesTable 2 Jadad score assessment of RCTs and Newcastle-Ottawa quality assessment scale of non-RCTRisk of bias assessmentThe risk of selection bias was low in the included studies, except for one non-RCT study [26] that did not undergo randomization and had a high risk of selection bias. Owing to the particularity of clinical interventions, not all studies can completely blind the implementer and study participant. Most studies did not describe a blinded method for evaluating the outcomes. Data from all the included studies were reported completely, and the risk of reporting bias was low. The risk of bias for the included studies is shown in Fig. 1.
Fig. 1 Outcome analysisMajor bleeding
All included studies [19, 20, 23,24,25,26] reported outcome measures for major bleeding. There were 5 cases (1.6%) in the ultrasound-guided PDT group and 15 (4.9%) in the landmark-guided PDT group. There was no significant heterogeneity among the included studies (P = 0.99, I2 = 0%). The results showed a significant difference in the incidence of major bleeding between ultrasound- and landmark-guided PDT (OR = 0.35, 95%CI [0.14, 0.90], P = 0.03), as shown in Fig. 2.
Fig. 2
Forest plot comparing ultrasound-guided PDT and landmark-guided PDT for major bleeding
First puncture success rateFive studies [19, 20, 23, 25, 26] reported first puncture success rates. The success rates of first puncture were 90.2% in ultrasound-guided PDT group and 75.8% in landmark-guided PDT groups. There was no significant heterogeneity among the included studies (P = 0.41, I2 = 0%). The results showed a significant difference in first puncture success rate between ultrasound PDT compared to landmark-guided PDT (OR = 4.41, 95%CI [2.54, 7.65], P < 0.000001), as shown in Fig. 3.
Fig. 3
Forest plot comparing ultrasound-guided PDT with landmark-guided PDT for first puncture success rate
Tracheotomy procedure timeFive studies [19, 20, 23, 25, 26] reported the tracheotomy procedure time. There was heterogeneity among the included studies owing to differences in the method of calculating procedure time (P < 0.00001; I2 = 95%). The sensitivity analysis was conducted by excluding the study with the largest weight, Kupeli [23], and the effect size did not change significantly (MD = -0.80, 95% CI [-6.87, 5.28], P = 0.80). This statistical result was consistent with the overall meta-analysis results, suggesting that the results were stable. The results showed that there was no significant difference in tracheotomy procedure time between ultrasound-guided PDT and landmark-guided PDT (MD = − 0.64, 95%CI [–4.14, 2.85], P = 0.72), as shown in Fig. 4.
Fig. 4
Forest plot comparing ultrasound-guided PDT with landmark-guided PDT for tracheotomy procedure time
Periprocedural complicationsAll included studies reported periprocedural complications, which occurred in 41 patients (13.3%) in the ultrasound-guided PDT group and 80 patients (26.6%) in the landmark-guided PDT group. There was no significant heterogeneity among the included studies (P = 0.75, I2 = 0%). The results showed a significant difference in complication rates between ultrasound-guided PDT and landmark-marker guided PDT (OR = 0.35, 95%CI [0.22, 0.54], P < 0.00001), as shown in Fig. 5.
Fig. 5
Forest plot comparing ultrasound-guided PDT with landmark-guided PDT for periprocedural complications
Sensitivity analysisWe performed sensitivity analyses by systematically excluding each included study in sequence to evaluate the consistency of all outcome measures. The findings remained robust across these analyses, demonstrating stability of the pooled effect estimates that was concordant with the primary meta-analysis results.
Comments (0)