
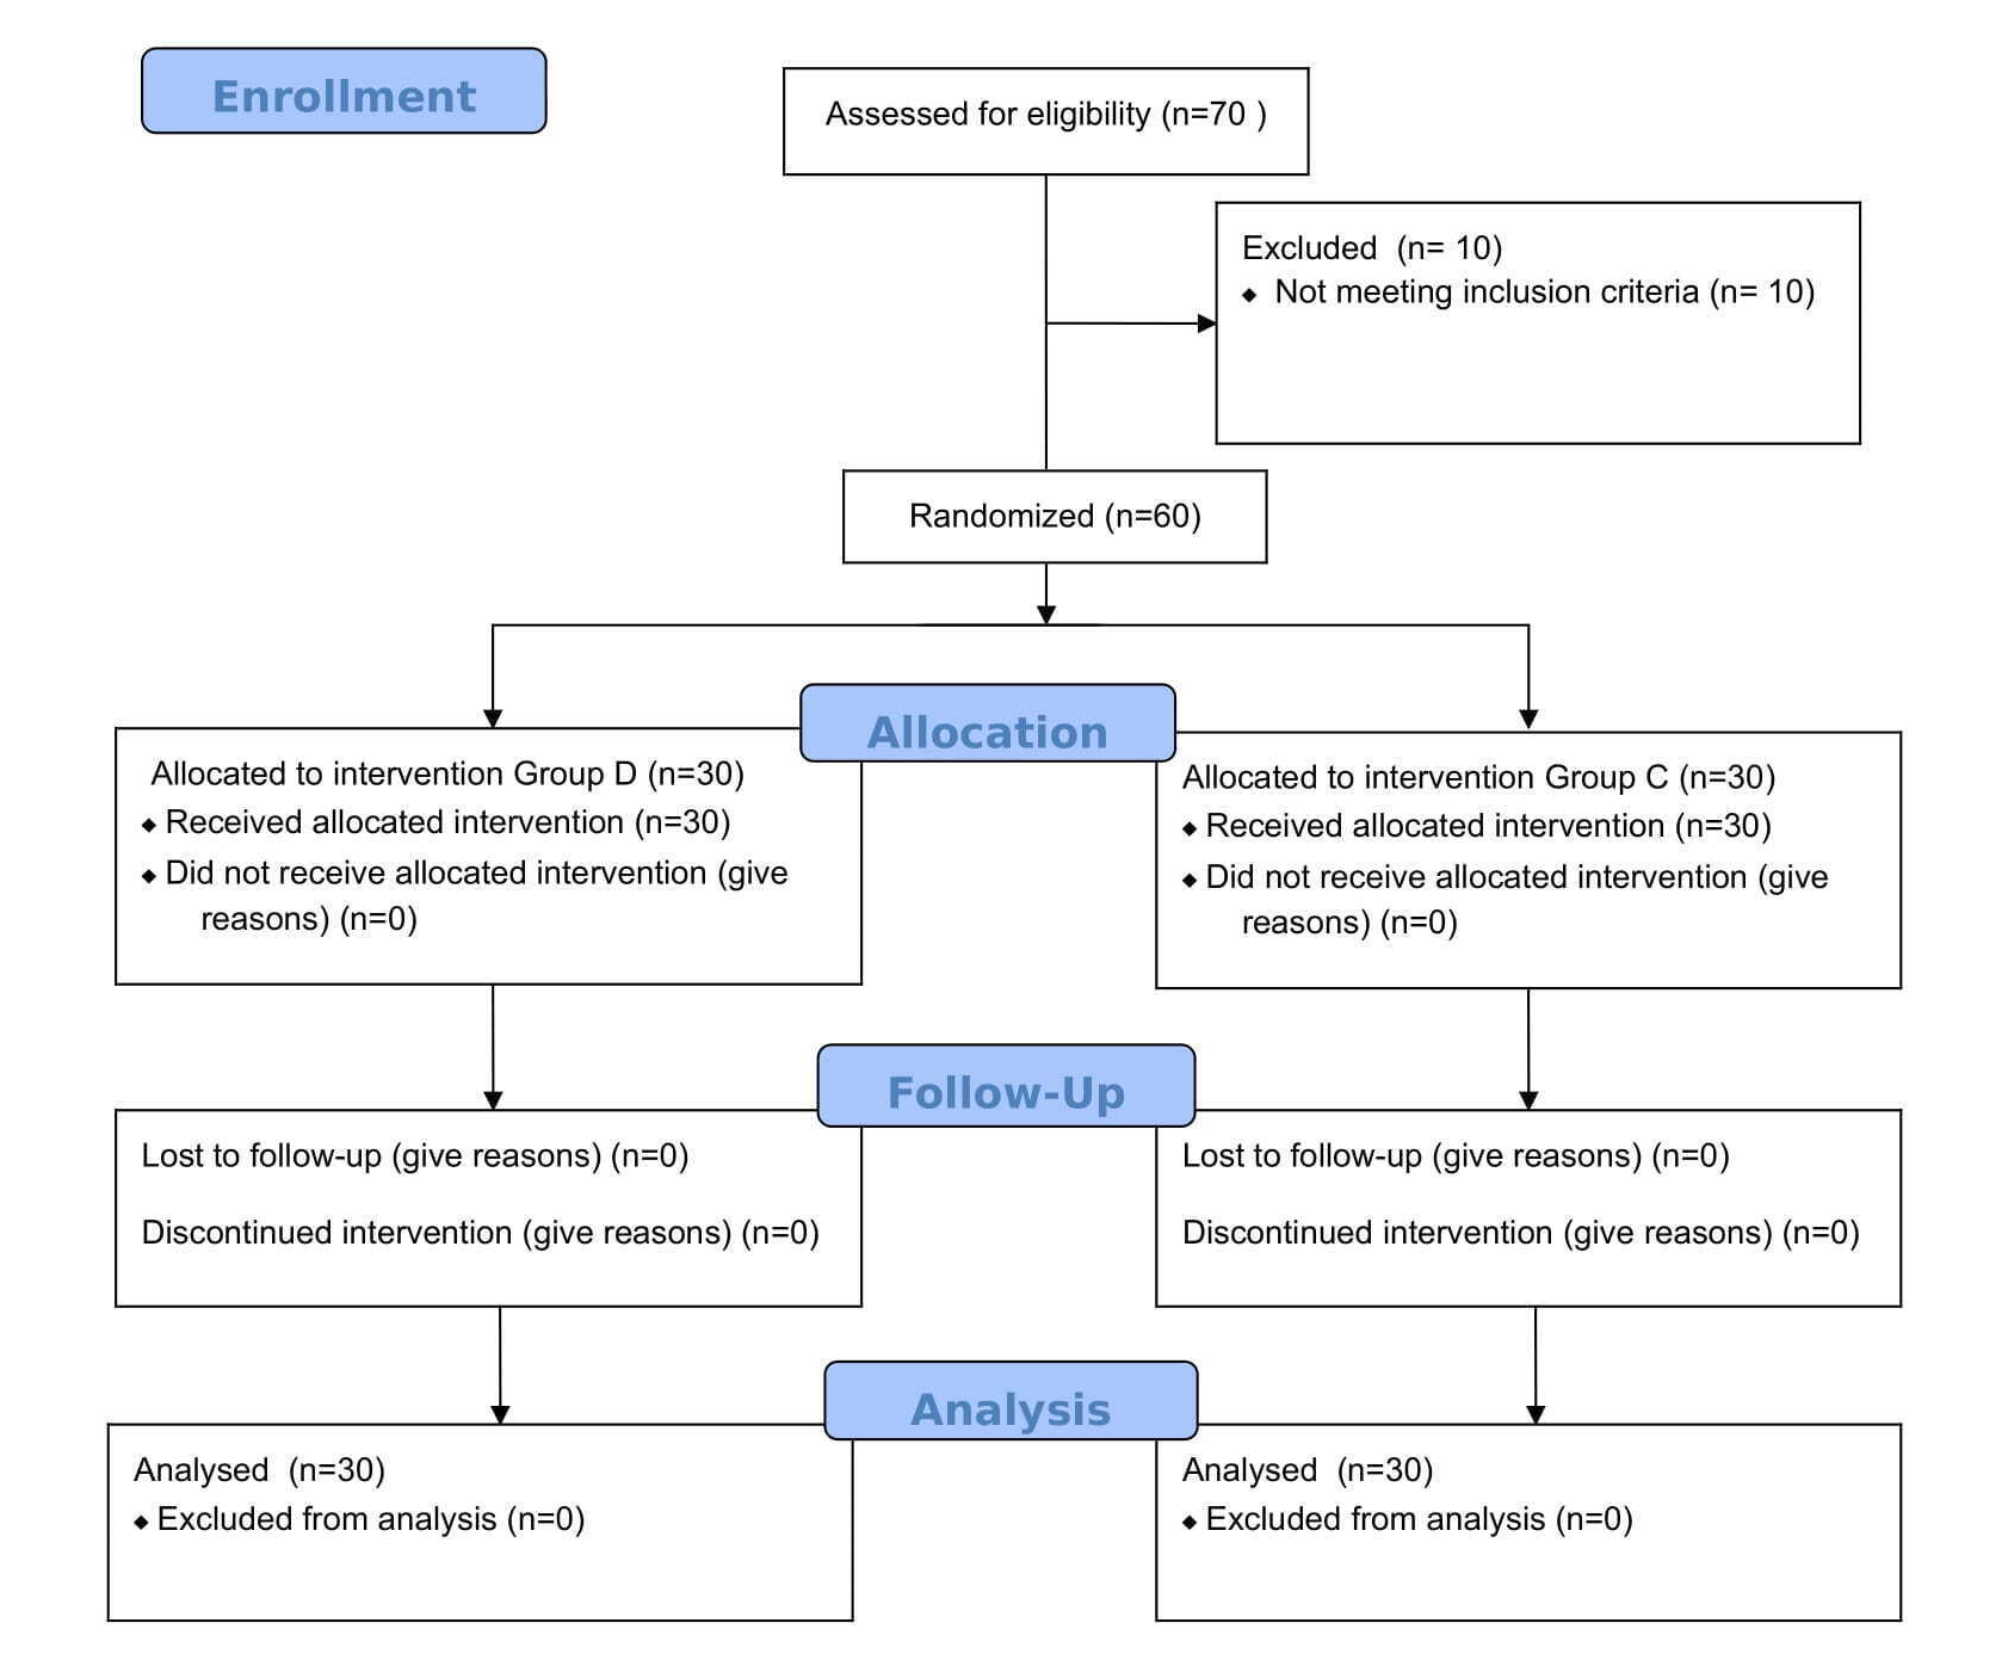
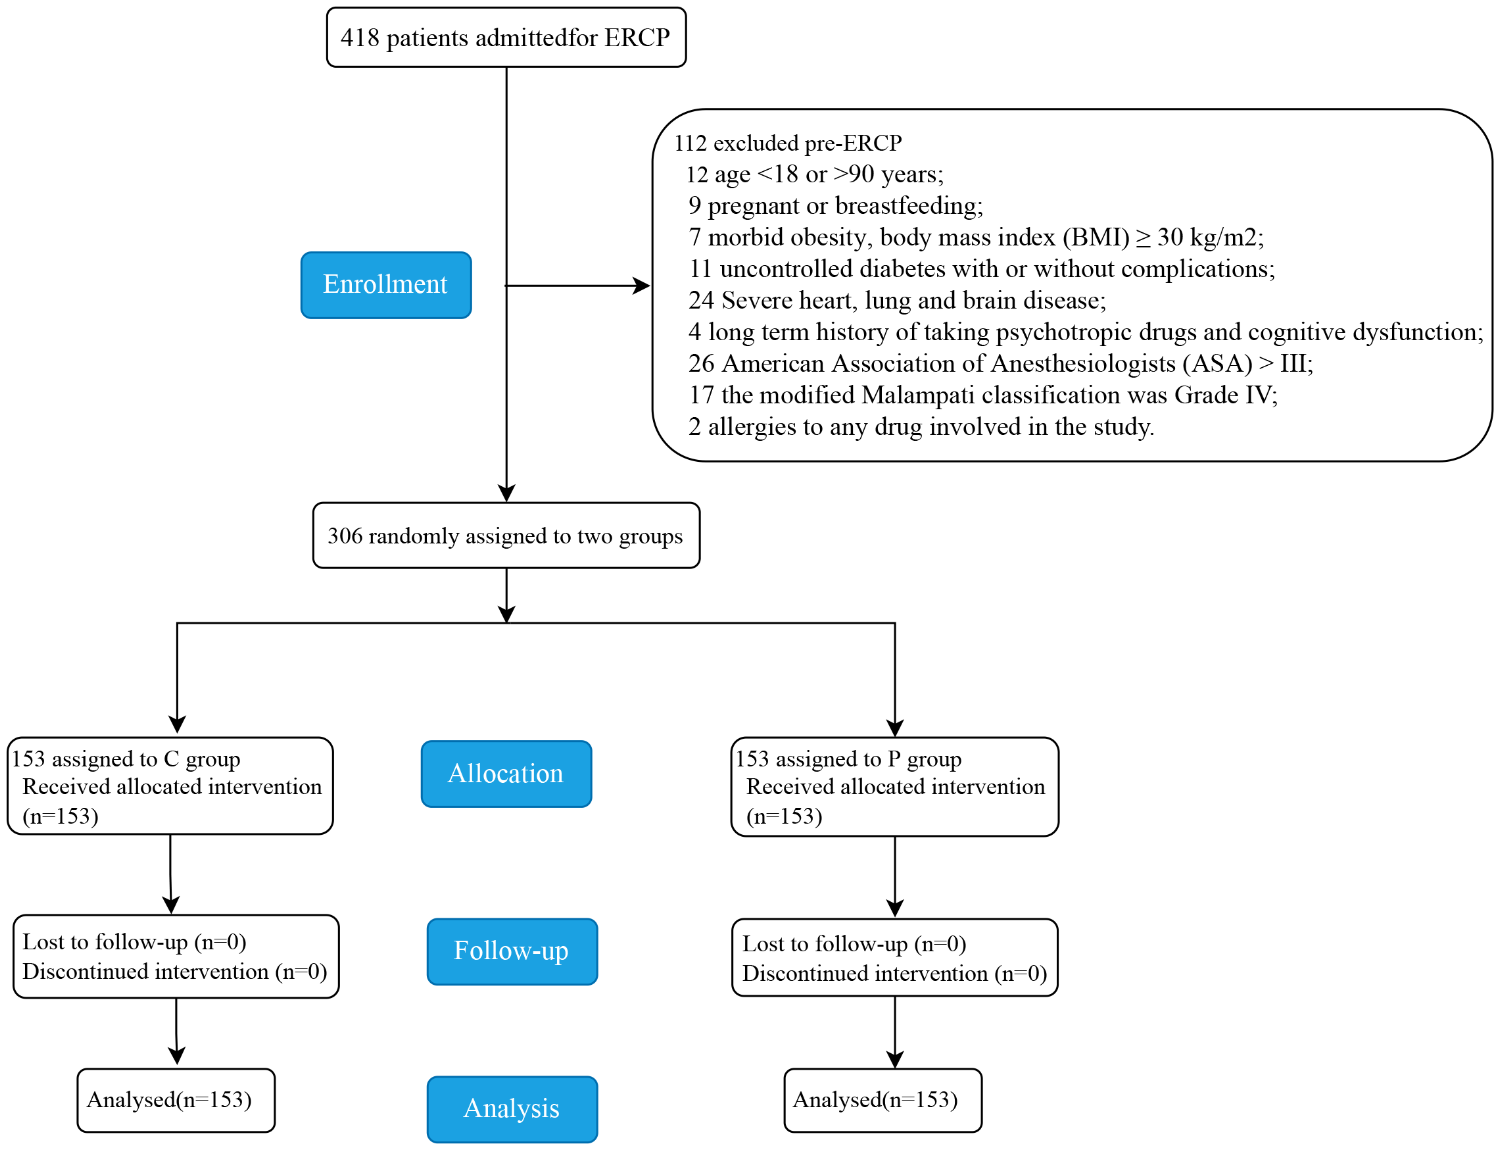
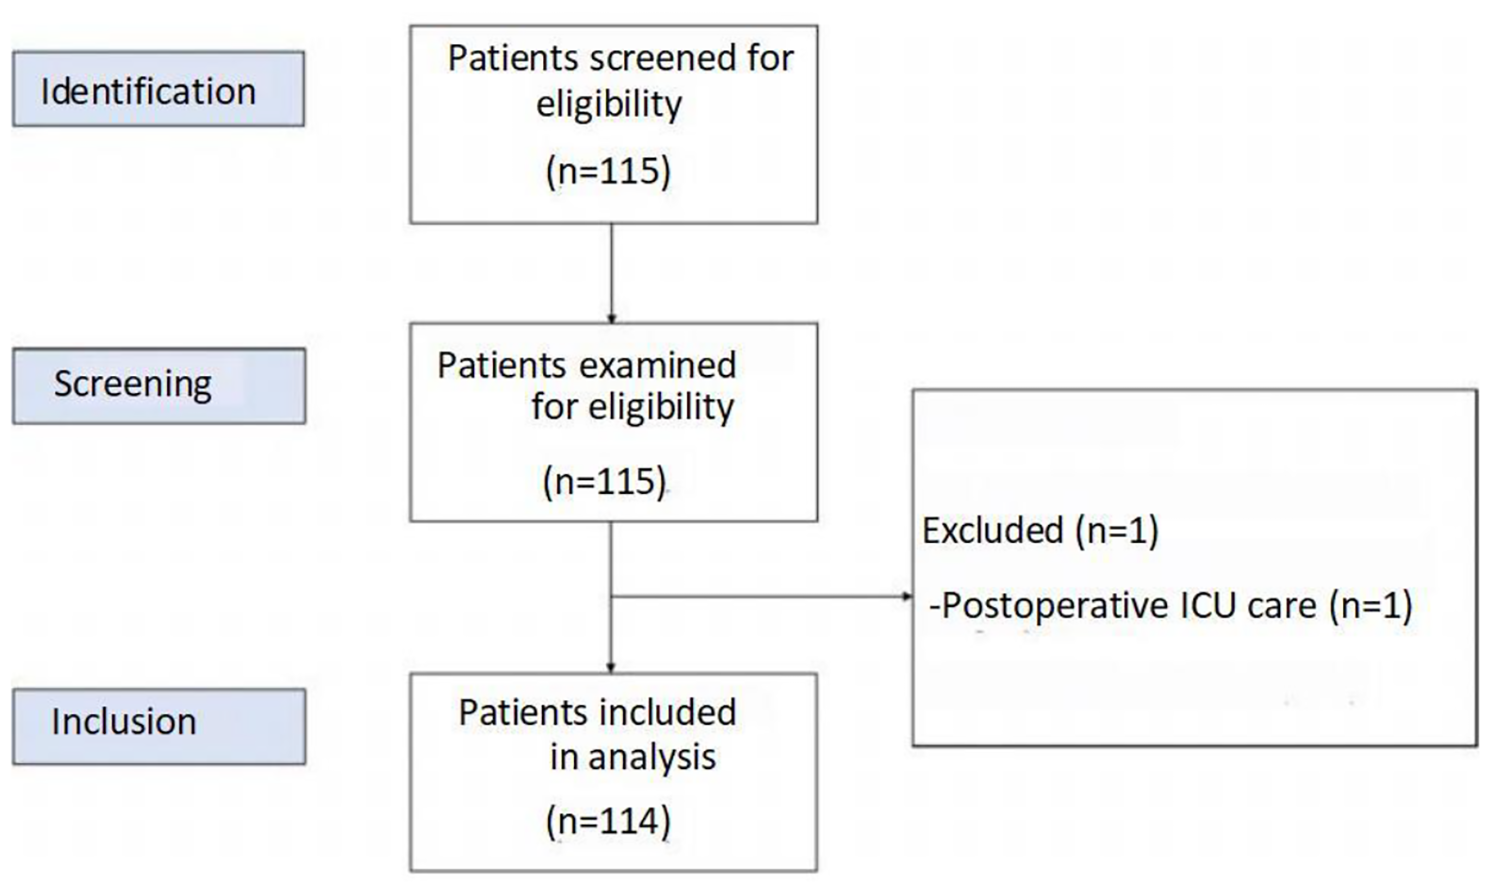
Remember me


Behavioral scores of rats in the etomidate, propofol, and lidocaine plus etomidate groups were recorded at different time points. Etomidate increased the mean behavioral score at 1 min (1.80 ± 1.32 vs. 0.00 ± 0.00, p = 0.0049; 1.80 ± 1.32 vs. 0.20 ± 0.42, p = 0.0099), 2 min (1.70 ± 1.25 vs. 0.10 ± 0.32, p = 0.0072; 1.70 ± 1.25 vs. 0.00 ± 0.00, p = 0.0051), 3 min (1.70 ± 1.34 vs. 0.00 ± 0.00; 1.70 ± 1.34 vs. 0.00 ± 0.00, both for p = 0.0076), 4 min (1.20 ± 1.23 vs. 0.00 ± 0.00; 1.20 ± 1.23 vs. 0.00 ± 0.00, both for p = 0.0316), 5 min (1.70 ± 0.95 vs. 0.00 ± 0.00; 1.70 ± 0.95 vs. 0.00 ± 0.00, both for p = 0.0008), but did not affect the mean behavioral score at 0 min (0.30 ± 0.48 vs. 0.00 ± 0.00; 0.30 ± 0.48 vs. 0.00 ± 0.00, both for p = 0.1769) compared to the propofol and lidocaine plus etomidate groups (Fig. 1A, B). Etomidate at doses of 3.8 mg/kg and 6.0 mg/kg decreased the mean behavioral score at 1 min (0.00 ± 0.00 vs.1.80 ± 1.32; 0.00 ± 0.00 vs. 1.80 ± 1.32, both for p = 0.0058), 2 min (0.10 ± 0.32 vs.1.70 ± 1.25, p = 0.0084; 0.00 ± 0.00 vs. 1.70 ± 1.25, p = 0.0060), 3 min (0.10 ± 0.32 vs.1.70 ± 1.34, p = 0.0127; 0.00 ± 0.00 vs. 1.70 ± 1.34, p = 0.0091), 5 min (0.20 ± 0.42 vs.1.70 ± 0.95, p = 0.0018; 0.00 ± 0.00 vs. 1.70 ± 0.95, p = 0.0009), but did not affect the mean behavioral score at 0 min (0.20 ± 0.60 vs. 0.30 ± 0.50; 0.20 ± 0.42 vs. 0.30 ± 0.50, both for p > 0.9999) compared to the etomidate at the dose of 1.5 mg/kg. 6.0 mg/kg of etomidate (0.00 ± 0.00 vs. 1.20 ± 1.23, p = 0.0390) decreased, 3.8 mg/kg of etomidate did not affect (0.20 ± 0.63 vs. 1.20 ± 1.23, p = 0.1168) the mean behavioral score at 4 min compared to the 1.5 mg/kg of etomidate (Fig. 1C, D). This result indicated that etomidate-induced myoclonus was dose dependent.
Fig. 1
Quantification of the behavioral activity in rats in vivo. A Rats were injected intravenously through the tail vein with etomidate (1.5 mg/kg), propofol (11.8 mg/kg), lidocaine (3 mg/kg) plus etomidate (1.5 mg/kg). B The trend of behavioral score at different time points in the etomidate, propofol, lidocaine plus etomidate groups. (C) Rats were injected intravenously through the tail vein with etomidate at different dose (1.5 mg/kg, 3.8 mg/kg, 6.0 mg/kg). (D) The trend of behavioral score at different time points in the different dose of etomidate groups (1.5 mg/kg, 3.8 mg/kg, 6.0 mg/kg). *: p < 0.05, **: p < 0.01, ***: p < 0.001 the etomidate group vs. the propofol group; #: p < 0.05, ##: p < 0.01, ###: p < 0.001 the etomidate group vs. the lidocaine plus etomidate group by the two way ANOVA (linear mixed-model) analysis and a post-hoc Bonferroni correction test
Effect of NMDAR activity on etomidate-induced changes in neocortical KCC2 expressionBased on the previous research, we found that 0.5 and 1 µM etomidate activated neocortical intracellular calcium signaling [8], which indicated that etomidate induced cell excitability in a concentration-dependent manner. We further conducted in vitro western blot analysis of brain slices at different concentrations of etomidate to verify the effect of etomidate on the NKCC1 and KCC2 proteins. As shown in Fig. 2A-I. In the neocortex, we found that 0.5 µM (0.73 ± 0.18 vs. 1.04 ± 0.17, n = 6, p = 0.0096) and 1 µM (0.73 ± 0.24 vs. 1.03 ± 0.14, n = 6, p = 0.0077) etomidate induced, 5 µM etomidate (0.94 ± 0.15 vs. 0.77 ± 0.13, n = 6, p = 0.1627) did not affect but 10 µM etomidate (1.39 ± 0.17 vs. 0.77 ± 0.13, n = 6, p < 0.0001) inhibited the decrement of KCC2 protein compared to the control group. Additionally, 0.5 µM etomidate plus NMDA (0.12 ± 0.02 vs. 0.73 ± 0.18, n = 6, p = 0.0006) and 1 µM etomidate plus NMDA (0.24 ± 0.16 vs. 0.73 ± 0.24, n = 6, p = 0.0182) activated, 0.5 µM etomidate plus AP5 (1.48 ± 0.33 vs. 0.73 ± 0.18, n = 6, p < 0.0001) and 1 µM etomidate plus AP5 (1.39 ± 0.36 vs. 0.73 ± 0.24, n = 6, p = 0.0017) inhibited the decrement of KCC2 protein compared to 0.5 µM etomidate and 1 µM etomidate alone. Both lidocaine plus 0.5 µM etomidate (1.44 ± 0.27 vs. 0.73 ± 0.18, n = 6, p < 0.0001) and propofol (1.39 ± 0.25 vs. 0.73 ± 0.24, n = 6, p = 0.0018) inhibited the decrement of KCC2 protein compared to the 0.5 µM etomidate group and the 1 µM etomidate group, respectively. None of the different concentrations of etomidate (0.5 µM (1.03 ± 0.13 vs. 0.93 ± 0.25, n = 6, p = 0.4331), 1 µM (0.97 ± 0.15 vs. 0.88 ± 0.07, n = 6, p = 0.1713), 5 µM (1.04 ± 0.08 vs. 0.98 ± 0.12, n = 6, p = 0.4656), 10 µM (1.06 ± 0.06 vs. 0.98 ± 0.12, n = 6, p = 0.2665)) affected the NKCC1 protein compared to the control group. Lidocaine plus etomidate (p = 0.5170), propofol (p = 0.8844), 0.5 µM etomidate plus NMDA (p = 0.0595), 1 µM etomidate plus NMDA (p = 0.0595), 0.5 µM etomidate plus AP5 (p = 0.4941), and 1 µM etomidate plus AP5 (p = 0.6661) did not affect the NKCC1 protein compared to the etomidate alone.
Fig. 2
Western blot analysis for KCC2 and NKCC1 proteins of brain slices in vitro. Western blot analysis for KCC2, NKCC1 at 0.5 μm (A), 1µM (D), 5µM and 10µM (G) of etomidate. Quantification of blot after normalization to α-tubulin of KCC2 (B), NKCC1(C), in control group, 0.5 µM etomidate group, 0.5 µM etomidate plus 100 µM lidocaine group, 0.5 µM etomidate plus 100 µM NMDA group and 0.5 µM etomidate plus 100 µM AP5 group in neocortex and hippocampus (n = 6 rats in each group). Quantification of blot after normalization to α-tubulin of KCC2(E), NKCC1(F) in control group, 1 µM etomidate group, 1 µM etomidate plus 100 µM lidocaine group, 1 µM etomidate plus 100 µM NMDA group and 1 µM etomidate plus 100 µM AP5 group in neocortex and hippocampus (n = 6 rats in each group). Quantification of blot after normalization to α-tubulin of KCC2 (H), NKCC1 (I) in control and 5 µM and 10 µM etomidate groups (n = 6 rats in each group). Con: Control. Eto: Etomidate. Pro: Propofol. Lido: Lidocaine. AP5: DL-2-amino-5-phosphopentanoic acid. NMDA: N-methyl-d-aspartate.*: p < 0.05, **: p < 0.01, ***: p < 0.001, ****: p < 0.0001 by one-way multiple comparisons ANOVA and two-tailed t-Test
In the hippocampus, etomidate at concentrations of 0.5 µM (1.20 ± 0.14 vs. 0.95 ± 0.08, n = 6, p = 0.0125), 1 µM (1.21 ± 0.20 vs. 0.71 ± 0.27, n = 6, p = 0.0196), 5 µM (1.19 ± 0.13 vs. 0.78 ± 0.14, n = 6, p = 0.0002), and 10 µM (1.01 ± 0.12 vs. 0.78 ± 0.14, n = 6, p = 0.0188) inhibited the decrement of KCC2 protein compared to the control group. Neither lidocaine plus 0.5 µM etomidate (1.33 ± 0.27 vs. 1.20 ± 0.14, n = 6, p = 0.3085) nor propofol (1.29 ± 0.32 vs. 1.21 ± 0.20, n = 6, p = 0.3430) affected the KCC2 protein compared to the 0.5 µM etomidate group and the 1 µM etomidate group, respectively. None of the different concentrations of etomidate (0.5 µM (0.97 ± 0.20 vs. 1.05 ± 0.14, n = 6, p = 0.2490), 1 µM (0.99 ± 0.29 vs. 1.07 ± 0.20, n = 6, p = 0.6721), 5 µM (1.03 ± 0.16 vs. 0.93 ± 0.10, n = 6, p = 0.3952), 10 µM (0.97 ± 0.09 vs. 0.93 ± 0.10, n = 6, p = 0.8599)) affected the NKCC1 protein compared to the control group. Lidocaine plus etomidate (p = 0.9871) and propofol (p = 0.3726) also did not affect the NKCC1 protein compared to etomidate alone.
Etomidate increased muscular tension and the level of the calpain-2 proteinWe performed muscle tension monitoring combined with Western blot assays to explore the relationship between etomidate-induced myoclonus and the calpain-2 protein. The results showed that etomidate increased the peak muscular tension amplitude (4.87 ± 1.77 vs. 0.80 ± 0.29 g; 4.87 ± 1.77 vs. 0.57 ± 0.34 g, both for n = 6, p < 0.0001) or frequency (4.61 ± 1.41 vs. 0.46 ± 0.18 Hz; 4.61 ± 1.41 vs. 0.47 ± 0.33 Hz, both for n = 6, p < 0.0001) compared to the propofol and lidocaine plus etomidate groups. In addition, etomidate increased the level of neocortical calpain-2 protein (1.43 ± 0.16 vs. 0.74 ± 0.23, n = 6, p = 0.0022; 1.43 ± 0.16 vs. 0.92 ± 0.16, n = 6, p = 0.0148) but did not affect hippocampal calpain-2 protein (0.86 ± 0.23 vs. 0.74 ± 0.16, n = 6, p = 0.4515; 0.86 ± 0.23 vs. 1.02 ± 0.18, n = 6, p = 0.4201) (Fig. 3A-C) compared to propofol and lidocaine plus etomidate. Furthermore, there were strong correlations between the peak muscular tension (amplitude or frequency) and the neocortical calpain-2 protein (Spearman’s r = 0.7779, p = 0.0001; Spearman’s r = 0.8039, p < 0.0001, Fig. 3D, E). However, the correlation analysis revealed no significant relationships between the peak muscular tension (amplitude or frequency) and the hippocampal calpain-2 protein (Spearman’s r = 0.1188, p = 0.6387; Spearman’s r = 0.2239, p = 0.3717; Fig. 3F, G.
Fig. 3
Etomidate increased the muscular tension and the level of the calpain-2 protein in rats in vivo. (A) Muscular tension monitoring in the etomidate, propofol, lidocaine plus etomidate group. (B) Western blot analysis for calpain-2 protein of neocortex and hippocampus in the etomidate, propofol, lidocaine plus etomidate group. (C) Quantification of blot after normalization to α-tubulin of calpain-2 in the etomidate, propofol, lidocaine plus etomidate group. Spearman correlation analysis of the relationship between the peak muscular tension amplitude and relative expression of calpain-2 to α-tubulin in neocortex (r = 0.7779, p = 0.0001, D) and hippocampus (r = 0.1188, p = 0.6387, F) and the relationship between the peak muscular tension frequency and relative expression of calpain-2 to α-tubulin in neocortex (r = 0.8039, p < 0.0001, E) and hippocampus (r = 0.2239, p = 0.3717, G). *: p < 0.05, **: p < 0.01 by one-way multiple comparison ANOVA test
Microinjection of the calpain-2 inhibitor MDL-28170 in the neocortex alleviated etomidate-induced myoclonus and decrement of the KCC2 proteinRats were microinjected with 0.5 µg of MDL-28170, NMDA, MDL-28170 + NMDA and DMSO into the neocortex during etomidate anesthesia to explore the role of calpain-2 in the effect of etomidate-induced myoclonus and the modulation of NMDA receptors. Etomidate plus NMDA increased the peak muscular tension amplitude (10.79 ± 3.10 vs. 6.33 ± 2.52 g, n = 6, p = 0.0058), but did not affect the peak muscular tension frequency (9.75 ± 5.20 vs. 8.18 ± 3.63 Hz, n = 6, p = 0.8456) compared to the etomidate plus DMSO group. Etomidate plus MDL-28170 significantly decreased the peak muscular tension amplitude (1.74 ± 0.68 vs. 6.33 ± 2.52 g, n = 6, p = 0.0045) and frequency (2.75 ± 1.71 vs. 8.18 ± 3.63 Hz, n = 6, p = 0.0465) compared to the etomidate plus DMSO group. Both etomidate plus MDL-28170 and etomidate plus NMDA plus MDL-28170 decreased the peak muscular tension amplitude (1.74 ± 0.68 vs. 10.79 ± 3.10 g, n = 6, p < 0.0001; 1.36 ± 0.44 vs.10.79 ± 3.10 g, n = 6, p < 0.0001) and frequency (2.75 ± 1.71 vs. 9.75 ± 5.20 Hz, n = 6, p = 0.0079; 1.83 ± 0.98 vs. 9.75 ± 5.20 Hz, n = 6, p = 0.0027) compared to the etomidate plus NMDA group (Fig. 4A). Etomidate plus NMDA induced neocortical decrement of the KCC2 protein (0.71 ± 0.10 vs. 1.04 ± 0.15, n = 6, p = 0.0197), etomidate plus MDL-28170 suppressed the neocortical decrement of KCC2 protein (1.28 ± 0.22 vs. 1.04 ± 0.15, n = 6, p = 0.0038) compared to the etomidate plus DMSO group. Both etomidate plus MDL-28170 and etomidate plus NMDA plus MDL-28170 suppressed the neocortical decrement of KCC2 protein (1.28 ± 0.22 vs. 0.71 ± 0.10, n = 6, p = 0.0053; 1.23 ± 0.18 vs. 0.71 ± 0.10, n = 6, p = 0.0080) compared to the etomidate plus NMDA group (Fig. 4B, C).
Fig. 4
MDL-28170 microinjected into the neocortex alleviated etomidate-induced myoclonus and the decrement of KCC2 protein in vivo. Muscular tension monitoring (A), Western blot analysis for KCC2 protein of neocortex (B), and quantification of blot after normalization to α-tubulin of KCC2 (C) in the etomidate plus DMSO, etomidate plus MDL-28170, etomidate plus NMDA, etomidate plus NMDA plus MDL-28170 groups. *: p < 0.05, **: p < 0.01 by one-way multiple comparison ANOVA test
Intravenous injection of vitamin E prevented etomidate-induced myoclonus and alleviated neocortical decrement of the KCC2 proteinThe effect of vitamin E on etomidate-induced myoclonus has not been reported. We found that pretreatment with intravenous injection of MDL-28170 plus etomidate and vitamin E plus etomidate decreased the etomidate-induced peak muscular tension amplitude (1.87 ± 0.75 vs. 6.63 ± 3.00 g; 1.52 ± 0.71 vs. 6.63 ± 3.00 g, both for n = 10, p < 0.0001) and frequency (2.25 ± 1.07 vs. 7.68 ± 4.13 Hz; 2.00 ± 0.89 vs. 7.68 ± 4.13 Hz, both for n = 10, p < 0.0001) compared to the DMSO plus etomidate group (Fig. 5A). Moreover, both MDL-28170 plus etomidate and vitamin E plus etomidate deccreased the mean behavioral score at 0 min (0.10 ± 0.32 vs. 0.80 ± 0.63, n = 10, p = 0.0234; 0.20 ± 0.42 vs. 0.80 ± 0.63, n = 10, p = 0.0128), 1 min (0.10 ± 0.32 vs. 1.40 ± 0.70, n = 10, p = 0.0005; 0.00 ± 0.00 vs. 1.40 ± 0.70, n = 10, p = 0.0004), 2 min (0.30 ± 0.67 vs. 1.50 ± 0.71, n = 10, p < 0.0001; 0.20 ± 0.63 vs.1.50 ± 0.71, n = 10, p = 0.0094), 3 min (0.00 ± 0.00 vs. 1.70 ± 1.25, n = 10, p = 0.0051; 0.10 ± 0.32 vs. 1.70 ± 1.25, n = 10, p = 0.0050), 4 min (0.00 ± 0.00 vs. 0.80 ± 0.79; 0.00 ± 0.00 vs. 0.80 ± 0.79, both for n = 10, p = 0.0262), 5 min (0.00 ± 0.00 vs. 1.10 ± 0.88; 0.00 ± 0.00 vs.1.10 ± 0.88, both for n = 10, p = 0.0082) after anesthesia compared to the DMSO plus etomidate group (Fig. 5B). The neocortical level of KCC2 protein was evaluated among the three groups to verify the calpain-2 inhibitor effect of vitamin E. We found that both MDL−28170 plus etomidate (1.27 ± 0.10 vs. 0.80 ± 0.22, n = 6, p = 0.0011) and vitamin E plus etomidate (1.09 ± 0.19 vs. 0.80 ± 0.22, n = 6, p = 0.0332) alleviated etomidate-induced neocortical decrement of KCC2 protein compared to the DMSO plus etomidate group (Fig. 5C, D). For the duration of LORR, we found that neither MDL-28170 (9.59 ± 0.64 vs. 9.47 ± 0.94 min, n = 10, p = 0.9406) nor vitamin E (10.28 ± 0.65 vs. 9.47 ± 0.94 min, n = 10, p = 0.0621) affected the duration of LORR after etomidate anesthesia compared to DMSO(Fig. 5E).
Fig. 5
Vitamin E prevented etomidate-induced myoclonus and alleviated neocortical decrement of KCC2 protein in vivo. (A) Muscular tension monitoring in the DMSO plus etomidate, MDL-28170 plus etomidate, vitamin E plus etomidate group. (B) The trend of behavioral score at different time points in the DMSO plus etomidate, DMSO plus etomidate, vitamin E plus etomidate groups. *: p < 0.05, **: p < 0.01, ***: p < 0.001, ****: p < 0.0001, the DMSO plus etomidate group vs. MDL-28170 plus etomidate group; #: p < 0.05, ##: p < 0.01, ###: p < 0.001, ####: p < 0.0001, the DMSO plus etomidate group vs. vitamin E plus etomidate group by two way analysis of variance (ANOVA) (linear mixed-model) analysis and a post-hoc Bonferroni correction test. Western blot analysis for KCC2 protein of neocortex(C), quantification of blot after normalization to α-tubulin of KCC2(D), and duration of LORR(E) in the DMSO plus etomidate, MDL-28170 plus etomidate, vitamin E plus etomidate groups. Eto: etomidate, LORR: loss of righting reflex. *: p < 0.05, **: p < 0.01 by one-way multiple comparison ANOVA test
Comments (0)