
Remember me
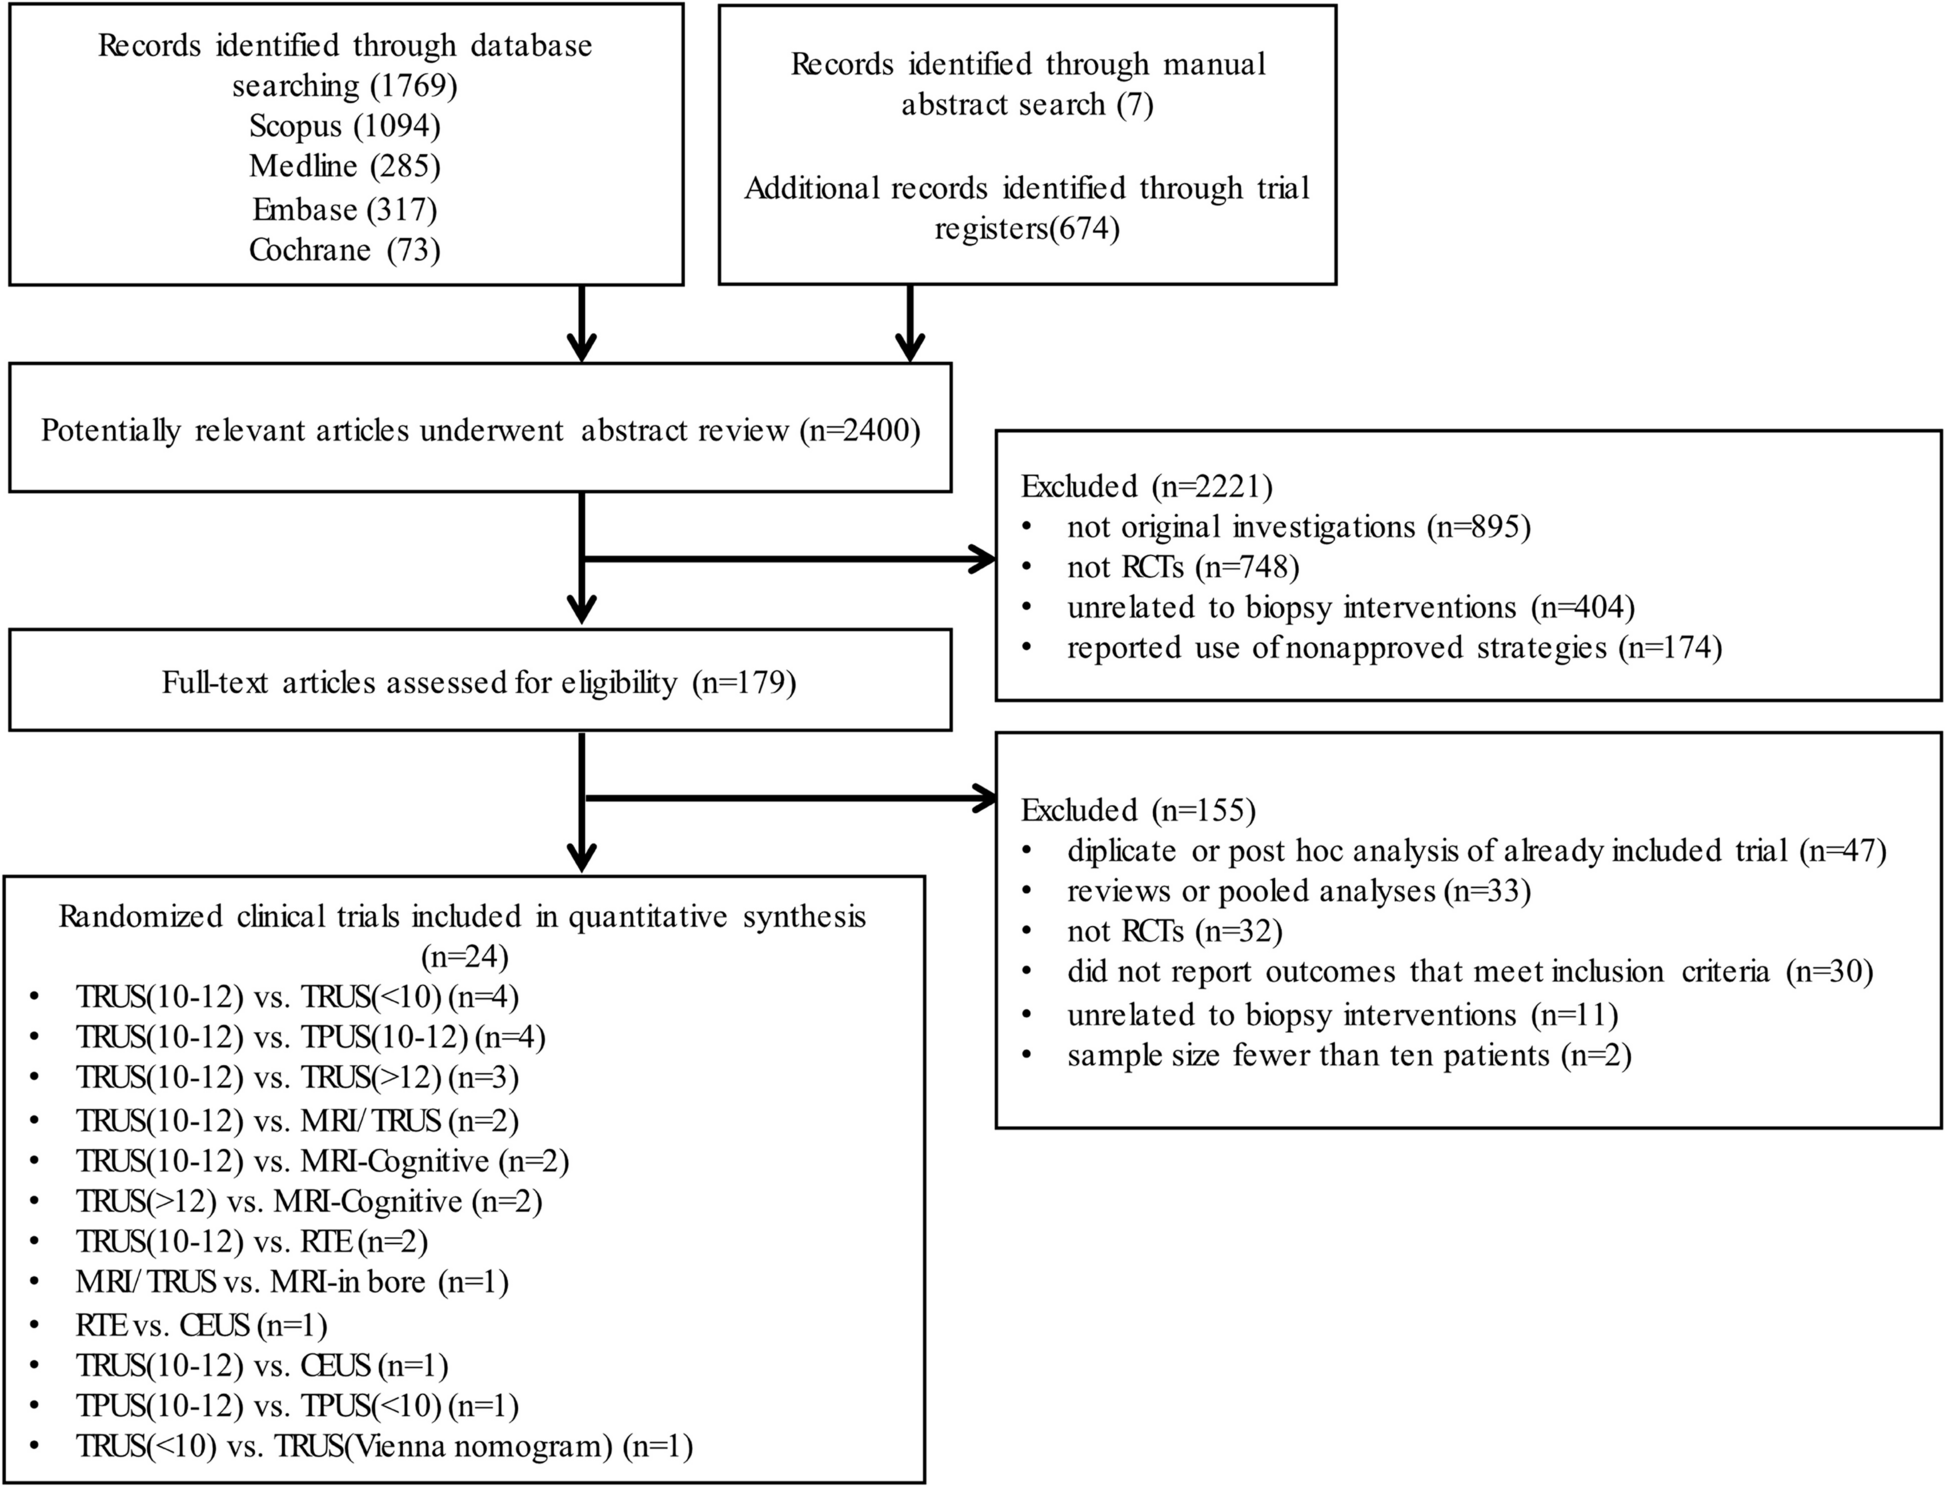


From a total of 2,369 citations identified using the search strategy, 24 randomized controlled trials (RCTs), including 6,497 participants, were included in this network meta-analysis (appendix 13). The PRISMA flowchart depicting electronic searching processes is presented in Fig. 1. The trials were conducted to compare 11 prostate biopsy strategies (Table 1). The number of patients allocated to each method ranged between 26 and 570 (median, 107 adults [interquartile range, 100–152]). All of the trials were two-armed and data were available for at least one of the outcomes.
Fig. 1
The flowchart of study selection. RCT = randomized controlled trial. MRI = magnetic resonance imaging. TRUS = transrectal ultrasound. RTE = real-time sonoelastography. CEUS = contrast-enhanced ultrasonography. TPUS = transperineal ultrasound
Table 1 General characteristics of the biopsy strategies includedThe network plot had a polygonal network configuration with mixed connections (Fig. 2 and appendix 5). All biopsy strategies had at least one controlled trial and were directly compared. For the primary outcome, 12 (22%) of 55 pairwise comparisons had direct evidence. TRUS(10–12)-PB was most investigated (18 trials; 2,174 patients), whereas three interventions were investigated by only one trial (MRI-in bore-, TRUS [Vienna nomogram]-, TPUS [< 10]-PB).
Fig. 2
Network of eligible comparisons. a Network of eligible comparisons for overall PCa detection rate; b Network of eligible comparisons for clinically significant PCa detection rate. c Network of eligible comparisons for clinically insignificant PCa detection rate; d Network of eligible comparisons for positive core rate. The width of the lines is proportional to the number of trials comparing every pair of treatments, and the size of every circle is proportional to the number of randomly assigned participants (sample size). MRI = magnetic resonance imaging. TRUS = transrectal ultrasound. RTE = real-time sonoelastography. CEUS = contrast-enhanced ultrasonography. TPUS = transperineal ultrasound
Population characteristicsAcross trials, the mean age of patients ranged from 61 to 88 years, the mean PSA value ranged from 4.4 to 23.3 ng/mL and the mean prostate volume ranged from 27.8 to 60 mL (Table 2 and appendix 3). The population investigated by 20 (83.3%) trials underwent an initial biopsy, 2 (8.3%) with previous negative biopsy population and 2 (8.3%) with mixed population. The baseline characteristics of image and biopsy protocol are described in appendix 3. MRI was performed in 7 (29%) of the involved studies, four of them employed PI-RADS classification for the evaluation of TB threshold.
Table 2 Randomized controlled trials included in the systematic review and network meta-analysisQuality assessmentOverall, 11 trials were regarded to be at high risk of bias. The risk of bias was high or unclear for adequate sequence generation in 11 trials; concealment of treatment allocation in 13 trials; masking of participants, masking of investigators, or both in 12 trials; completeness of outcome reporting in 8 trials and selective reporting of outcomes in 6 trials. None of the trials received financial funding from a commercial body and source of funding was unclear for 13 trials. The funnel plots for primary outcomes were not suggestive of any publication bias (appendix 4).
Network consistencyThe networks of individual intervention end points are exhibited in appendix 3. The common heterogeneity (τ2) was 0.48 (95% CrI 0.28–0.83) for overall PCa detection rate, 0.72 (95% CrI 0.24–1.76) for csPCa detection rate, 1.02 (95% CrI 0.33–1.95) for ciPCa detection rate and 0.27 (95% CrI 0.07–1.20) for positive core rate. By testing of global inconsistency, the network meta-analysis model gave an adequate fit to the data. Tests of local inconsistency showed no statistically significant inconsistency in the loops within the network for overall PCa detection rate and ciPCa detection rate. Most loops were consistent indicating lack of evidence of inconsistency in the network. Finally, by applying node-splitting model, we did not note any inconsistencies between evidence derived from direct and indirect comparisons in any of the primary or secondary analyses (appendix 6).
Pairwise and network resultsResults of direct pairwise meta-analysis are summarized in Table 3 and appendix 7. Only MRI/TRUS- and MRI-cognitive- were significantly better than TRUS(10–12)-PB [odds ratio (OR) 1.58, 95% confidence intervals (CIs) 1.35–1.86; OR 3.88, 95% CI 1.99–7.52] based on 2 studies (5,600 participants) regarding positive core rate. For other outcomes, there were no remarkable differences in the associations between any procedure (p > 0.05). Since some direct pairwise comparisons were conducted based on single trial, the p values for the network analysis are not available. P values can be obtained when at least 2 trials were included in the analysis. The unavailable p values in the Tables 3 are unlikely to influenced the results.
Table 3 Results of meta-analysis of direct comparisonsThe results of the network meta-analyses for the primary outcomes are presented as a league table in Fig. 3. Pooled estimated effects confirmed that six strategies (MRI-cognitive-, MRI/TRUS-, MRI-in bore-, RTE-, TRUS[> 12] CEUS-PB) improved overall PCa detection rate when compared with previously recommended standard method (TRUS [10,11,12]-PB). Of note, only for MRI-cognitive- (OR 2.66, 95% credibility intervals (CrIs) 1.44–4.72] enough evidence exists (p < 0.05) to support superiority when compared with TRUS(10–12)-PB. MRI-cognitive- was also associated with a significantly increased overall cancer detection rate than TPUS(10–12)- (OR 2.67, 95% CrI 1.23–5.54), TRUS(< 10)- (OR 3.23, 95% CrI 1.48–6.79), and TPUS(< 10)-PB (OR 4.59, 95% CrI 1.33–14.79) (Fig. 3a).
Fig. 3
a Summary odds ratio (OR) and credible intervals from network meta-analysis of overall PCa detection rate. b Summary odds ratio (OR) and credible intervals from network meta-analysis of clinically significant PCa detection rate. c Summary odds ratio (OR) and credible intervals from network meta-analysis of clinically insignificant PCa detection rate. d Summary odds ratio (OR) and credible intervals from network meta-analysis of positive core rate. Biopsy strategies are reported in order of efficacy ranking according to SUCRAs. Comparisons should be read from left to right. The efficacy estimate is located at the intersection of the column-defining treatment and the row-defining treatment. For efficacy (overall PCa detection rate), an OR over 1 favours the column-defining intervention. To obtain ORs for comparisons in the opposing direction, reciprocals should be taken. Numbers in parentheses indicate 95% credible intervals (95%CrIs). Significant results are in bold and underlined. MRI = magnetic resonance imaging. TRUS = transrectal ultrasound. RTE = real-time sonoelastography. CEUS = contrast-enhanced ultrasonography. TPUS = transperineal ultrasound. SUCRA = surface under the cumulative ranking curve
Results for secondary outcomes of csPCa detection rate and ciPCa detection suggested no significant difference between any group of biopsy techniques (Fig. 3b, Fig. 3c). In terms of positive core rate, RTE- was significantly effective than TRUS(10–12)- (OR 5.92, 95% CrI 2.20–16.20), TPUS- (OR 6.23, 95% CrI 2.04–19.73), and TRUS(> 12)-PB (OR 6.57, 95% CrI 2.01–21.61). MRI-cognitive was significantly effective than TRUS(10–12)- (OR 4.32, 95% CrI 1.45–13.30), TPUS(10–12)- (OR 4.55, 95% CrI 1.34–15.98) and TRUS(> 12)-PB (OR 4.80, 95% CrI 1.34–17.58) considering positive core rate (Fig. 3d).
RankThe ranking of interventions based on cumulative probability plots and surface under the cumulative ranking curve (SUCRA) is presented in the appendix 7. Regarding overall PCa detection rate, the most effective treatment was MRI-cognitive-PB (99.8%), followed by MRI/TRUS- (84%), MRI-in bore- (73.6%), RTE- (71%), CEUS- (50.1%), TRUS(10–12)- (39.9%), TPUS(10–12)- (38.7%), TRUS(> 12)- (37.3%), TRUS(Vienna nomogram)- (32.4%), TRUS(< 10)- (18.1%), and the least effective was TPUS(< 10)-PB (4.7%). Considering csPCa detection rate, MRI/TRUS PB (69.1%) was ranking the best, followed by MRI-cognitive- (66.2%), TPUS(10–12)- (56.4%), MRI-in bore- (54.4%), RTE- (40.7%), TRUS(> 12)- (39.9%), and TRUS(10–12)-PB (23.2%).
Subgroup and sensitivity analysisWe repeated all the Bayesian network meta-analysis using overall PCa detection rate as an end-point. With respect to the subgroup of patients ≥ 65 years, we found a significant superiority favoring MRI/TRUS PB compared with TRUS(10–12) PB (OR 2.47, 95% CrI 1.30–4.75). A similar preference was observed in the subgroup of PSA < 10 ng/ml (OR 2.45, 95% CrI 1.20–5.09) (appendix 8).
Results from multiple sensitivity analyses were reported in the appendix 9. In terms of overall PCa detection rates exclusively previously negative biopsy patients, we found robust improvements of 3.92 (95% CrI 2.17–6.41) for MRI-cognitive- and 1.78 (95% CrI 1.02–3.07) for MRI/TRUS- compared to TRUS(10–12)-PB. In terms of PCa detection when prostate volume ≤ 50 mm3, only MRI/TRUS- was significantly effective than TRUS(10–12)-PB (OR 1.78, 95% CrI 1.0–2.89). In the remaining sensitivity analyses with alternative statistical models and priors distribution, OR was similar in magnitude and direction of effect estimates without changing the rankings considerably (appendix 9).
Quality of EvidenceAccording to GRADE, there was moderate quality evidence for MRI-cognitive PB being associated with higher overall PCa detection rate compared with TRUS(10–12)-, TPUS(10–12)-, TRUS(< 10)-,and TPUS(< 10)-PB. The quality of evidence was mainly downgraded due to study imprecision and indirectness (appendix 10).
Comments (0)