
Remember me


This study was conducted in accordance with the principles of the Declaration of Helsinki and approved by the Medical Ethics Committee of Shunde Hospital, Southern Medical University. The requirement to obtain informed consent was waived because of the observational design of the study. Preoperative T1 mapping gadoxetic acid-enhanced MRI and clinical data were retrospectively collected from two institutions between January 2019 and May 2022. Data from Institution I were designated as the training and internal validation cohort, while data from Institution II served as the external validation cohort. Additionally, patients from Institution I were prospectively enrolled from June 2022 to December 2022 to form the prospective validation cohort. The training and internal validation cohorts were utilized as retrospective datasets, whereas the external validation cohort also comprised retrospective data. The prospective validation cohort, however, was derived from prospectively collected data. The data were reviewed on June 1, 2023.
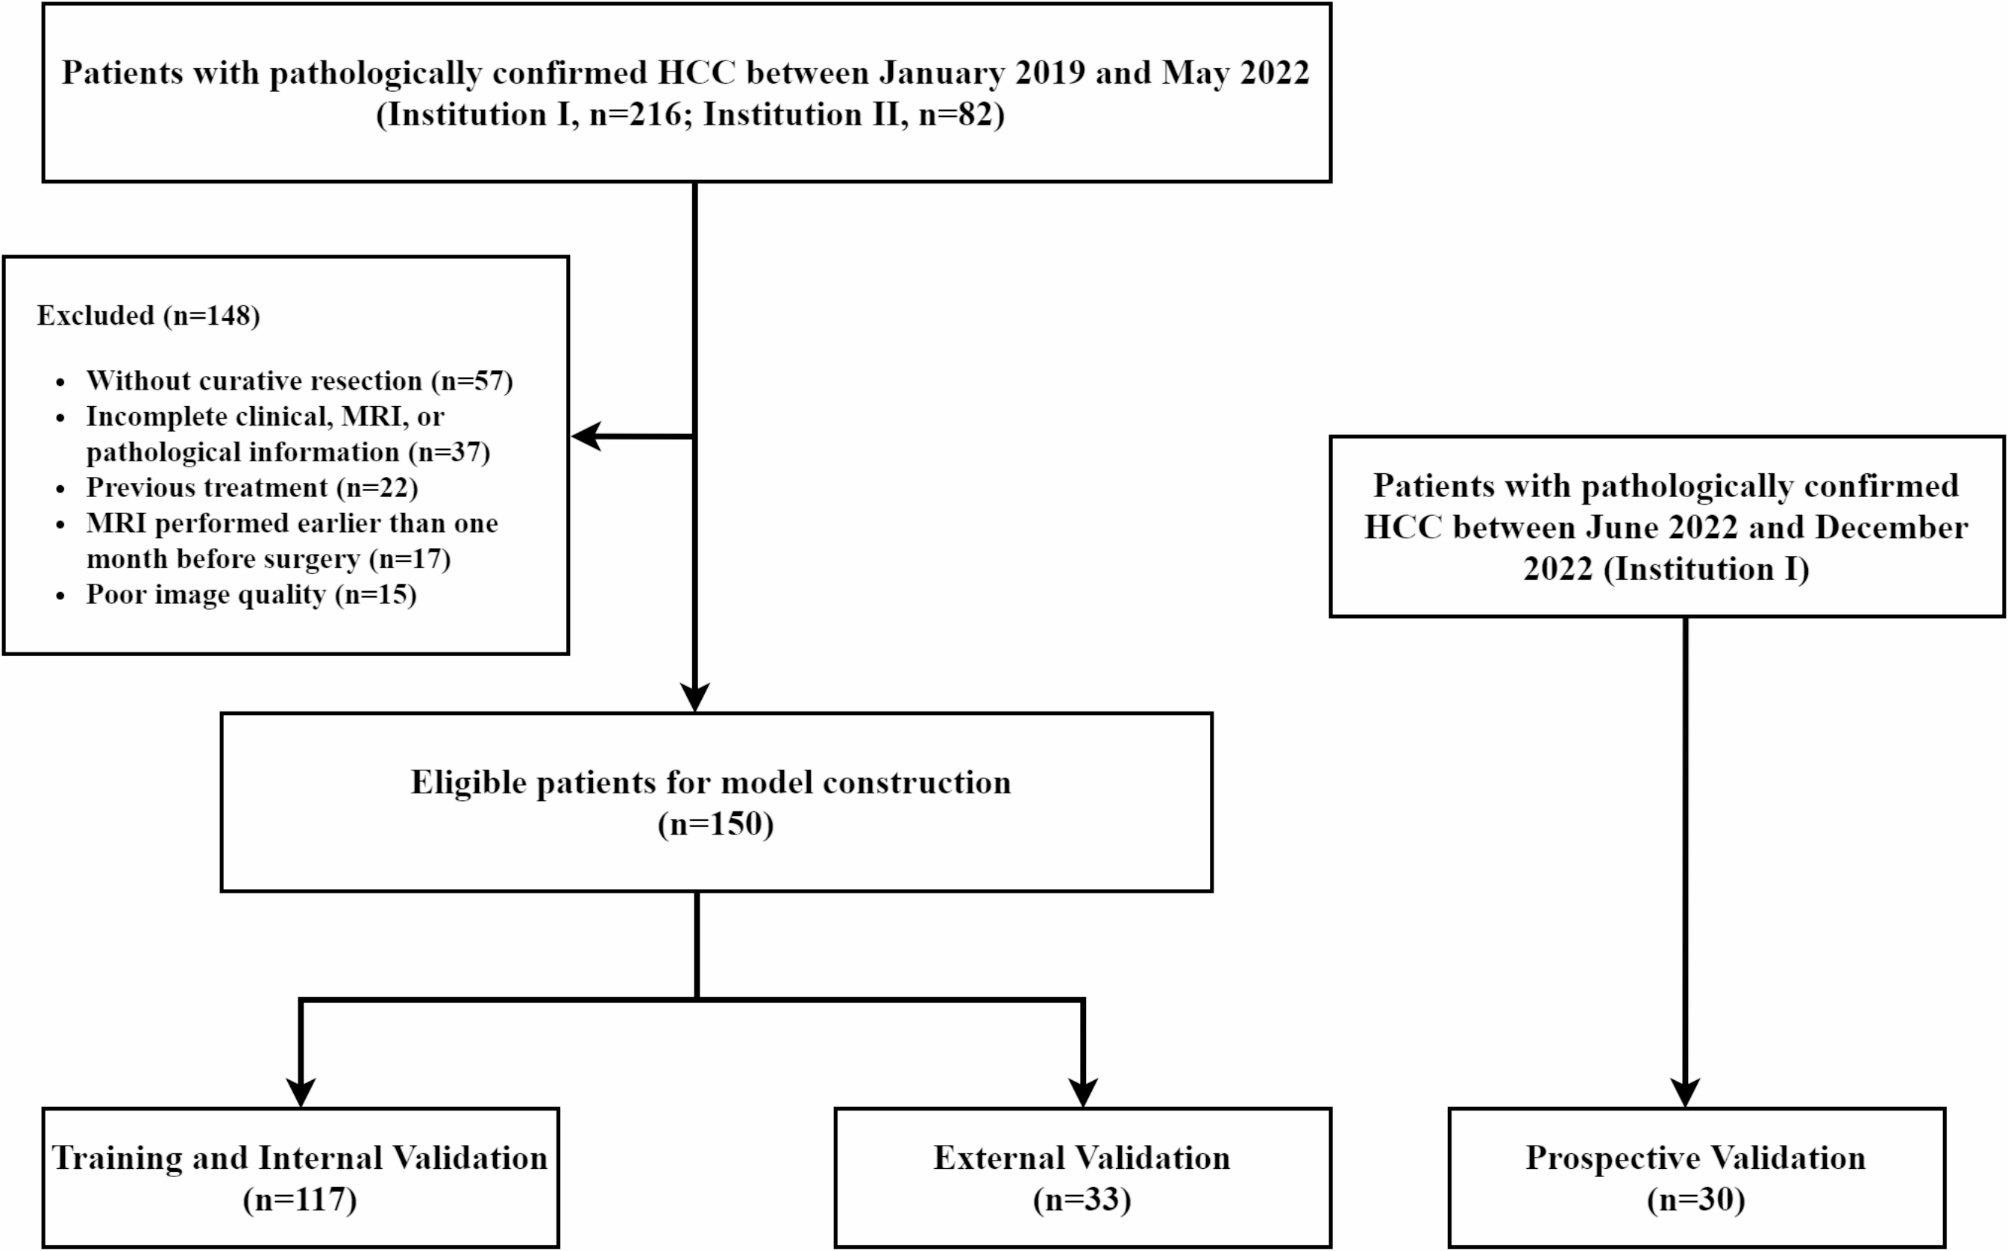
The inclusion criteria were as follows: (a) patients with pathologically confirmed HCC and CK19 status; (b) underwent curative hepatic resection; (c) those with preoperative T1 mapping gadoxetic acid-enhanced MRI imaging. The exclusion criteria were as follows: (a) patients who did not receive curative resection; (b) those with a lack of complete clinical data or whose MRI and pathological images were unavailable; (c) those who received previous treatment; (d) those with imaging data of poor quality with obvious artifacts; and (e) those who underwent MRI examination more than one month before surgery. The patient recruitment process and study design are shown in Fig. 1.
Fig. 1
Patient recruitment and study design
Clinical data collectionClinical and laboratory data of the patients were recorded, including sex, age, hepatitis, levels of alpha-fetoprotein (AFP, µg/L), alanine aminotransferase (ALT, U/L), aspartate aminotransferase (AST, U/L), and gamma-glutamyltransferase (GGT, U/L), neutrophil-to-lymphocyte ratio (NLR), platelet-to-lymphocyte ratio (PLR), Child-Pugh classification, and the modus operandi.
MRI examinationAll patients from institutions I and II were underwent scanning using the Magnetom Skyra, Lumina, or Verio 3.0T MRI system (Siemens Healthcare Sector, Erlangen, Germany) equipped with a dedicated abdominal coil. All patients fasted for more than 6 h and underwent breathing training before the scan. The patients were instructed to adopt a head-advanced supine position, with examinations ranging from the upper edge to the lower edge of the liver. The standard imaging protocol consisted of T1-weighted imaging (T1WI), T2-weighted imaging (T2WI), diffusion-weighted imaging (DWI), and T1 mapping. Gadoxetic acid was used for enhanced MRI (Primo-vist; Bayer Schering Pharma AG, Berlin, Germany, 0.1 mmol/kg), the flow rate was set at 1.0 mL/s, and 30 mL physiological saline was then used for rinsing. Multiphase enhancements, including the arterial, portal, equilibrium, and hepatobiliary phases (HBP), were obtained at 20–30 s, 60–90 s, 150–180 s, and 20 min, respectively. T1 mapping included pre-enhancement and enhancement after 20 min. The specific scanning parameters are listed in Supplement Table 1.
Table 1 Clinical data in different cohortMRI feature analysisThe MRI qualitative features were independently evaluated by two abdominal radiologists (with 5 and 10 years of experience, respectively) from institution I who were blinded to the clinical and pathological information. In case of conflicting opinions, a third senior abdominal radiologist (with 15 years of experience) would participate in the discussion for a consensus. In patients with multiple tumors, the largest tumor was analyzed. The following MRI image features were evaluated (Supplement Method 1 and Supplement Fig. 1): (1) tumor margin; (2) tumor capsule; (3) cystic or necrosis portion; (4) fat deposition; (5) signal intensity on T2WI; (6) hemorrhage; (7) target sign on DWI; (8) target sign on HBP; (9) arterial rim enhancement; (10) peritumoral enhancement; (11) peritumoral hypointensity; and (12) satellite nodules.
Quantitative MRI features were measured by an abdominal radiologist (with 5 years of experience) from institution I using the RadiAnt DICOM Viewer 2022.1.1 software (https://www.radiantviewer.com). Tumor size was defined as the maximum tumor diameter on the axial or coronal HBP. The tumor region of interest (ROI) was then drawn to select the largest slice of the tumor on the apparent diffusion coefficient (ADC) and T1 mapping to avoid blood vessels. The ROI was set as the maximum cross-sectional area of the tumor. Another abdominal radiologist (with 10 years of experience) from institution I edited and confirmed the ROIs. The average of the results measured by the two radiologists was used as the final value, and the interclass correlation coefficient (ICC) was evaluated. The ADC value, T1 relaxation time of pre-enhancement (T1rt-pre), and T1 relaxation time of 20 min after enhancement (T1rt-20 min) were recorded, and the reduction rate of T1 relaxation time (rrT1rt) was calculated using the following formula: rrT1rt = (T1rt-pre - T1rt-20 min) / T1rt-pre.
Histopathological examinationAll histopathological examinations were conducted by two pathologists (with over 5 and 10 years of experience in liver pathology) who were blinded to the clinical and imaging information. If all of the following criteria are met, the pathological diagnosis is HCC with cholangiocyte phenotype. (1) microscopic morphological features of HCC; (2) positive expression of hepatocyte paraffin antigen 1 (HepPar-1), glypican-3 (GPC-3), or glutamine synthetase (GS) in tumor cells; and (3) positive expression of CK19 in tumor cells (≥ 15%) [3]. All patients were divided into two groups: cholangiocyte phenotype-positive HCC groups and classical (cholangiocyte phenotype-negative) HCC groups. The detailed measurements of CK19 are described in the Supplement Method 2.
Model development and validationThe clinical and MRI features were screened using the least absolute shrinkage and selection operator (LASSO), and the most significant clinicoradiological features were obtained through logistic regression analysis with stepwise selection. A five-fold stratified cross-validation was performed. Four groups, accounting for 90% of the total sample, formed the training cohort for model construction, whereas the remaining patients formed the internal validation cohort to evaluate model performance. Stratified sampling ensured that the distribution of the patients in the two cohorts was similar to the total sample to reduce systematic errors caused by the division of datasets.
Five machine learning models were constructed based on the most significant clinicoradiological features: random forest (RF), K-nearest neighbor (KNN), support vector machine (SVM), eXtreme Gradient Boosting (XGBoost), and logistic regression (LR). The entire process was repeated 100 times via bootstrapping to ensure model stability; one round of cross-validation is shown in Supplement Fig. 2. One external validation cohort and one prospective cohort were used to validate the prediction performance.
Fig. 2
Algorithm schematic of machine learning analysis for the entire process. The most significant features were screened by LASSO and logistic regression analysis. Five different machine learning models were constructed by these features. To obtain the best prediction model, the prediction performance of the models was compared by the mean ROC, and the SHAP was used to analyze the diagnostic process of the best model
Explanation of the SHAP algorithmThrough a comprehensive comparison, an optimal machine-learning model was obtained, and the model results were visualized using SHAP. SHAP is a game-theoretic approach for interpreting machine learning model predictions by quantifying the contribution of each feature to the final output. The Shapley algorithm calculates the Shapley value of each variable in the training cohort, explains the relationship between the input variables and the output results of the model, and improves model interpretability. The Shapley value of the input variable reflects the contributing weight of the feature in the model, and the red and blue colors represent positive and negative effects, respectively. A schematic of the machine learning analysis algorithm for the entire process is shown in Fig. 2. The detailed demonstration process and the formulas are provided in the Supplement explanation.
Follow-upFrom institution I, Two patients who were lost to follow-up, and the remaining 115 patients were followed up by ultrasonography, CT, or MRI every 3–6 months after surgery until recurrence or final review of the data. The Relapse-free survival (RFS) was defined as intrahepatic recurrence or distant metastasis, including residual liver lesions, and organ, lymph node, and peritoneal metastasis. The RFS rates were recorded. Then, XGBoost models were constructed based on the data of the training and internal validation cohorts. Patients were divided into high-risk and low-risk groups based on the best cut-off of the XGBoost predicted values.
Statistical analysisThe quantitative data are expressed as means ± standard deviations or medians (minimum, maximum range). Qualitative data are expressed as numbers and percentages. The ICC was used to evaluate the consistency of measurements between the two radiologists (ICC > 0.75: good, 0.65–0.75: general, and ICC < 0.65: poor). The prediction efficiency of each model was evaluated using the area under the curve (AUC), accuracy, sensitivity, and specificity values obtained from the mean receiver operating characteristic curve. The DeLong test was used to compare the differences in AUCs among the different models. The confidence intervals (CIs) in this study were set to 95%, and P < 0.05 indicated statistically significant differences. Survival curves were drawn using the Kaplan Meier method and compared using the log rank test. All statistical analyses were performed using the SPSS (version 25.0) or R (version 3.6.1; http://www.rproject. org) software.
Comments (0)