
Remember me
All reagents were obtained from Millipore Sigma unless specified otherwise. Buffers were prepared in ultrapure water. Room temperature (RT) indicates 22–25 °C.
Plasmid constructionPlasmids for recombinant-protein expression in Escherichia coliPlasmids were derived from vector pET-28b(+) (Novagen) and are listed in Supplementary Table 1 along with details about their construction and relevant GenBank accession numbers. All constructs were codon-optimized for E. coli and verified by whole-plasmid sequencing. The construct for expressing the N-terminal unstructured region (including the YG domain) of PEX13 was described previously17. For constructs fused to GST, the GST coding sequence was first amplified by PCR from vector pGEX-6P-3 (Cytiva), incorporating at the 5′ end the nucleotide sequence CAT (which creates an NdeI restriction site in combination with the downstream start codon) and at the 3′ end the nucleotide sequence 5′-GGATCCGACTTGGAAGTACTGTTTCAGGGTCCCTAACTCGAG-3′ that encodes a short linker consisting of the amino acids GSD, a 3C protease-cleavage site (amino acids LEVLFQGP), a TAA stop codon and a XhoI restriction site. The complete backbone of vector pET-28b(+) was next amplified by PCR, starting with nucleotides 5′-GCTAACAAA-3′ downstream of the multiple-cloning site and proceeding through nucleotides 5′-GGAGATATA-3′ upstream of the multiple-cloning site. Both PCR amplicons were ligated by Gibson assembly (New England Biolabs). The coding sequence of individual constructs was then inserted immediately downstream of the 3C protease-cleavage site. Truncations and deletions were performed by site-directed mutagenesis (Agilent).
Plasmids for recombinant-protein expression in Pichia pastorisPlasmids were assembled in the integrating vector pPICZα-LINK20 and are listed in Supplementary Table 2 along with details about their construction and relevant GenBank accession numbers. The vector was first modified to include the coding sequence of GST, followed by a tobacco etch virus (TEV) protease-cleavage site exactly as described previously24. The coding sequence of individual constructs was then inserted immediately downstream of the TEV protease-cleavage site by Gibson assembly.
Plasmids for genomic integration in S. cerevisiaePlasmids are listed in Supplementary Table 3 along with details about their construction and relevant GenBank accession numbers.
To assemble plasmid MSV-262, the following components were amplified by PCR and ligated by Gibson assembly: a segment of plasmid pWCD1401 located between and including the two NotI restriction sites (containing a high-copy ColE1 origin of replication and bacterial kanamycin-resistance cassette)54; the yeast PEX7 coding sequence along with 80 bp of the 5′ untranslated region; the yeast ADH1 terminator (that is, the last 13 bp of the ADH1 reading frame along with 190 bp of the 3′ untranslated region) flanked at the 5′ end by the nucleotide sequence 5′-GGCGCGC-3′ (to introduce an AscI restriction site) and at the 3′ end by the nucleotide sequence 5′-GATCCGCTAGATCTCGAGC-3′ (to introduce BglII and XhoI restriction sites); a hygMX6 hygromycin-resistance cassette (Addgene, catalogue number 19342), followed by an MfeI restriction site; and 80 bp of the 3′ untranslated region immediately downstream of the PEX7 reading frame. Using site-directed mutagenesis, the nucleotide pair GC was next inserted immediately upstream of the PEX7 start codon to introduce an SphI restriction site, nucleotides 462 and 468 within the PEX7 coding sequence were mutated to T and C, respectively, to destroy two BamHI restriction sites and the last four nucleotides of the PEX7 coding sequence (TTGA) were converted to CTAGC to introduce an NheI restriction site.
To assemble plasmid MSV-269, the TAG stop codon in plasmid MSV-262 was replaced by the nucleotide sequence 5′-TCTGGTGATTACAAAGATGATGATGACAAGTAA-3′, which encodes a short linker comprising the amino acids SG, followed by a FLAG tag (amino acids DYKDDDDK) and a new stop codon.
To assemble plasmid MSV-322, the nucleotides GC immediately upstream of the PEX7 start codon were replaced by a tetracycline-responsive riboswitch (5′-GGCCTAAAACATACCAGATCGCCACCCGCGCTTTAATCTGGAGAGGTGAAGAATACGACCACCTAGGCC-3′)39 preceded by a short linker (5′-ATCGTACG-3′) and followed by a minimal Kozak sequence (AAA).
Plasmid MSV-282 was assembled like plasmid MSV-262, with the following modifications. Fragments containing the ColE1 origin of replication and kanamycin-resistance cassette, as well as the ADH1 terminator region, were amplified by PCR as described earlier. These were ligated by Gibson assembly to the yeast PEX13 coding sequence and 69 bp of the 5′ untranslated region, a natMX6 nourseothricin-resistance cassette (Addgene, catalogue number 19343) and 68 bp of the 3′ untranslated region downstream of the PEX13 reading frame. The nucleotide sequence 5′-AGCTCCGAGGATCTGTACTTTCAGAGCTATCCATATGATGTTCCAGATTACGCT-3′, which encodes a linker composed of the amino acids SS, followed by a TEV protease-cleavage site (amino acids EDLYFQS) and an haemagglutinin tag (amino acids YPYDVPDYA), was then inserted immediately upstream of the PEX13 stop codon. Modifications of the PEX13 coding sequence were performed by site-directed mutagenesis.
Plasmid MSV-324 was assembled like plasmid MSV-282, except using the coding sequence of yeast PEX39, 80 bp of the 5′ and 3′ untranslated regions, and the yeast LYS2 auxotrophic marker (Addgene, catalogue number 64188)55. The nucleotide sequence 5′-GGTTCTGGTGATTACAAAGATGATGATGATAAG-3′, which encodes a linker composed of the amino acids GSG, followed by a FLAG tag, was then inserted immediately upstream of the PEX39 stop codon.
Yeast strains and growth conditionsYeast strains were routinely cultivated on YPD medium (1% wt/vol yeast extract, 2% wt/vol peptone and 2% wt/vol dextrose) at 30 °C, unless stated otherwise; for plates, 2% wt/vol agar (Becton Dickinson, catalogue number 214010) was added to the medium.
P. pastoris strains were derived from the SMD1168 parental strain56 and are listed in Supplementary Table 4. Expression cassettes for PEX7 and PEX7–GFP were inserted at the AOX1 locus by homologous recombination using the integrating plasmids described earlier. Plasmids were linearized using the restriction enzyme PmeI (New England Biolabs) and delivered into the yeast cells by electroporation. Transformants were selected on YPD agar supplemented with 1 M sorbitol and 500 µg ml−1 zeocin (Thermo Fisher, R25001). Correct insertion was validated by PCR.
S. cerevisiae strains were derived from the BY4742 reference strain57 and are listed in Supplementary Table 5. Deletions and insertions were performed by homologous recombination in a BY4742 derivative (referred herein as strain MSB-462) that expresses the peroxisomal PTS1 enzyme FOX2 fused at the N terminus to red fluorescent protein (RFP–FOX2) as well as the peroxisomal PTS2 enzyme POT1 fused at the C terminus to green fluorescent protein (POT1–GFP)58. For gene deletions, the appropriate antibiotic-resistance cassette or auxotrophic marker was amplified by PCR from the plasmids listed in Supplementary Table 3 using primers that introduce 60-bp overhangs corresponding to the 5′ and 3′ untranslated regions immediately upstream and downstream of the target open reading frame, respectively. The resulting amplicon was delivered into the yeast cells by lithium acetate-based transformation59. Transformants were selected on YPD agar supplemented with 250 µg ml−1 hygromycin (Thermo Fisher, catalogue number 10687010), 500 µg ml−1 geneticin (Thermo Fisher, catalogue number 10131035) or 100 µg ml−1 nourseothricin (Jena Bioscience, AB-101), as appropriate, or on synthetic defined agar medium lacking the appropriate amino acid or nucleotide (Sunrise Science). For inserting mutant genes or epitope tags, the relevant reading frame was first knocked out and then replaced by the modified coding sequence using the integrating plasmids described earlier. The plasmids were linearized using the restriction enzyme NotI (New England Biolabs) before lithium acetate-based transformation. All deletions and insertions were validated by PCR.
Protein purificationPurification of PEX7 and PEX7–GFPPEX7 and PEX7–GFP were produced in P. pastoris as fusions to an N-terminal GST tag and a TEV protease-cleavage site, and purified by glutathione-affinity and size-exclusion chromatographies as described previously24 with the following modifications. Cells were cultured in 2-l baffled flasks for 36 h at 30 °C on an orbital shaker in BM medium (100 mM KH2PO4·KOH pH 6.0 at RT, 0.34% wt/vol yeast nitrogen base, 1% wt/vol ammonium sulfate and 4 × 10⁻⁵% wt/vol d-biotin) supplemented with 1% vol/vol glycerol. The cells were next sterilely resuspended in BM medium supplemented with 0.75% vol/vol methanol in clean 2-l baffled flasks and cultured for an additional 24 h at 28 °C. The final cell pellets were weighed and suspended (at a ratio of 1 ml g−1 wet cell weight) in lysis buffer (30 mM Tris–HCl pH 7.5 at RT, 500 mM NaCl, 5% wt/vol glycerol, 1 mM EDTA and 2 mM dithiothreitol (DTT)) supplemented with protease-inhibitor tablets (Roche, catalogue number 5056489001) according to the manufacturer’s instructions. The cell suspension was divided among 50-ml beadbeater canisters (BioSpec, catalogue number 110803-50SS), supplemented with 2 mM phenylmethylsulfonyl fluoride, and the cells were lysed by beadbeating at 4 °C with 0.5-mm glass beads (BioSpec, catalogue number 11079105). The lysate was supplemented with 0.05% wt/vol Tween 20 and clarified by centrifugation at 40,000g and 4 °C for 40 min. The resulting supernatant was incubated overnight at 4 °C with glutathione agarose (Prometheus). The beads were washed with excess wash buffer (30 mM Tris–HCl pH 7.5 at RT, 300 mM NaCl and 1 mM DTT) and bound protein was eluted at RT with elution buffer (30 mM HEPES·KOH pH 7.8 at RT, 150 mM NaCl, 5% wt/vol glycerol, 1 mM DTT, 0.5 mM EDTA and 20 mM reduced glutathione). To remove the GST tag, the eluate was mixed with homemade His-tagged TEV protease60 and dialysed overnight at 4 °C against elution buffer lacking glutathione. The dialysed solution was incubated with glutathione agarose and Ni-NTA agarose (Thermo Fisher) to adsorb the GST tag and TEV protease. The resulting flow-through was gel-filtered into 30 mM HEPES·NaOH (pH 8), 300 mM NaCl, 5% wt/vol glycerol and 1 mM DTT (at 4 °C) either on a Cytiva HiLoad 16/600 Superdex 75 prep-grade (for PEX7) or a Cytiva HiLoad 16/600 Superdex 200 PG (for PEX7–GFP) column. Peak fractions were pooled and concentrated before being snap-frozen and stored as single-use aliquots at −80 °C.
Purification of the YG-domain fragment of PEX13The unstructured N-terminal region (including the YG domain) of A. thaliana PEX13 was produced in E. coli BL21 Rosetta 2(DE3) cells (Novagen) as a fusion to an N-terminal 14×His tag and a TEV protease-cleavage site, and purified under denaturing conditions in 8 M urea as previously described17.
Purification of all other recombinant proteinsProteins were produced in E. coli BL21 Rosetta 2(DE3) cells as fusions containing an N-terminal GST tag and a 3C protease-cleavage site. The proteins were purified by glutathione-affinity and size-exclusion chromatographies as described previously15 with the exception that after proteolytic removal of the GST tag using 3C protease, the proteins were gel-filtered into 25 mM HEPES·NaOH pH 7.8 at RT, 150 mM NaCl, 5% wt/vol glycerol and 1 mM DTT before being snap-frozen as single-use aliquots.
Peptide synthesisLyophilized peptides (Genscript) were dissolved in 1 M HEPES·NaOH pH 7.5 at RT, 10 mM tris(2-carboxyethyl)phosphine (TCEP) and 1 mM EDTA to a final concentration of 10 mM, snap-frozen as single-use aliquots and stored at −80 °C. The KPWE peptide corresponds to the amino-acid sequence CSSTAVPRPKPWETSASLEE consisting of residues 2–20 of S. cerevisiae PEX13 and an additional N-terminal cysteine for coupling to thiol-reactive agarose beads. In the scrambled peptide, amino acids 8 and 10–13 were rearranged into the sequence CSSTAVPEPRWKPTSASLEE. The PTS2 peptide corresponds to the amino-acid sequence SQRLQSIKDHLVESRS consisting of residues 2–15 of the S. cerevisiae peroxisomal thiolase POT1, followed by the amino acids R and S to improve solubility.
Peroxisome inductionPeroxisome biogenesis was induced in S. cerevisiae using an established procedure61. Briefly, cells were subcultured twice in YPD medium to mid-log phase (optical density at 600 nm (OD600) ≈ 2), harvested through centrifugation at 2,000g and 30 °C for 10 min, sterilely resuspended to an OD600 of 0.5 in YPGO medium (1% wt/vol yeast extract, 2% wt/vol peptone, 2% vol/vol glycerol, 0.1% wt/vol oleic acid and 0.25% vol/vol Tween 40) and cultured for an additional 16 h at 30 °C. For experiments involving PEX7 riboswitch constructs, cultures in YPGO were supplemented with 250 µM tetracycline (Millipore Sigma, T7660) as described previously62.
Peroxisomal protein import assay in S. cerevisiaeS. cerevisiae cells expressing RFP–FOX2 and POT1–GFP (MSB-462) were induced to form peroxisomes as described earlier. A 1-ml aliquot of each culture was sedimented by centrifugation for 30 s at 13,000g and RT, and the cells were resuspended in 7 µl of RT complete synthetic defined medium (Sunrise Science, catalogue number 1001) supplemented with 10 mM potassium phosphate pH 6 at RT, 4 mM magnesium sulfate, 25 mM ammonium sulfate and 2% wt/vol d-glucose. An aliquot of the resulting suspension was spotted on a clean glass slide (Thermo Fisher, 22-310397), covered by a 22 × 22 mm no. 1.5 square glass coverslip (VWR, 48366-227) and imaged immediately.
The cells were imaged on a spinning-disk confocal platform consisting of a Nikon Eclipse Ti inverted microscope, a Yokagawa CSU-X1 spinning-disk confocal scanner, a Hamamatsu ORCA-Fusion BT sCMOS camera and a Prior Proscan II motorized stage. Samples were illuminated sequentially by solid-state 65 mW 561-nm and 80 mW 488-nm lasers through a Di01-T405/488/568/647 dichroic (Semrock). Fluorescence was collected using a red-emission ET605/52 m (605 ± 26 nm) or a green-emission ET525/50 m (525 ± 25 nm) single-band bandpass filter (Chroma), respectively, through either a Nikon ×100 1.45 numerical aperture (NA) Plan Apo Lambda or Nikon ×40 0.95 NA Plan Apo Lambda air objective. Images were acquired using the Nikon NIS-Elements software with a 16-bit digitizer without binning. Multiple non-overlapping positions arrayed around the centre of the coverslip were imaged for each sample, with focus being maintained at a preset distance from the coverslip using the Nikon PFS. Imaging parameters were configured to maximize the signal-to-noise (SNR) ratio while avoiding saturation. All samples intended to be compared were imaged using identical acquisition settings.
Preparation of Xenopus egg extractInterphase-locked egg extract lacking filamentous actin was prepared exactly as described in a previously published protocol37 using adult female X. laevis wild-type pigmented African clawed frogs (aged 20–30 yr; Xenopus1). The frogs were handled strictly within the confines of the Amphibian/Aquatics facility of the Cell Biology Department at Harvard Medical School according to protocols fully approved by the Harvard Institutional Animal Care and Use Committee (protocol number IS00000098-9).
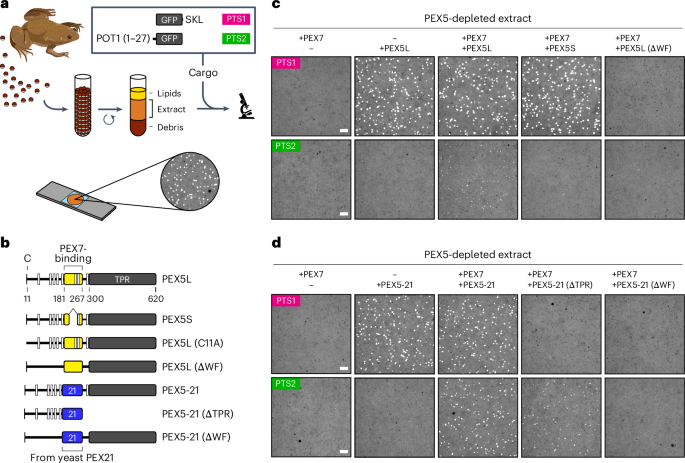
Peroxisomal protein import assay in Xenopus egg extractImport reactions were performed exactly as described in a previously published protocol37. Briefly, extract was mixed with 500 nM of the indicated cargo and 100 nM of the indicated receptor variants with or without 100 nM PEX7, and incubated at 24 °C. Where stated, endogenous PEX5 was first depleted from the extract using agarose beads covalently conjugated to the high-affinity PEX5-binding domain from PEX14. Recombinant proteins were diluted in XBHS buffer (40 mM HEPES·KOH pH 7.7 at RT, 100 mM KCl, 1 mM MgCl2, 0.1 mM CaCl2 and 250 mM sucrose) before being added to the reactions. For imaging, an aliquot of each reaction was sandwiched between two 22 × 22 mm no. 1.5 square glass coverslips (VWR, 48366-227) that had been passivated with 20 kDa polyethylene glycol (JenKem, M-SLN-20K). The sandwich was mounted on a 25 × 75 mm aluminium slide and sealed with a mixture of Vaseline, lanoline and paraffin. The slides were imaged on a spinning-disk confocal platform consisting of an inverted Nikon Eclipse Ti2 microscope and a Yokagawa CSU-W1 spinning-disk confocal scanner. The samples were illuminated by an 80-mW solid-state 488-nm laser through a Di01-T405/488/568/647 dichroic (Semrock), and fluorescence was collected through a Nikon ×100 1.45 NA Plan Apo Lambda oil-immersion objective and a green-emission ET525/50 m (525 ± 25 nm) single-band bandpass filter (Chroma). Images were acquired using the Nikon NIS-Elements software with a Hamamatsu ORCA-Fusion BT CMOS camera with 2 × 2 binning and a 16-bit digitizer. For each sample, multiple non-overlapping positions arrayed around the centre of the coverslip were imaged using a Prior Proscan III motorized stage operating at 20% of the maximum speed (to avoid shaking the extract). Focus was maintained at a preset distance from the coverslip using the Nikon Perfect Focus System. Imaging parameters were configured to maximize the SNR ratio while avoiding saturation. All samples intended to be compared were imaged under identical acquisition settings.
Electrophoresis and immunoblottingSamples in Laemmli buffer (50 mM Tris–HCl pH 6.8 at RT, 10% vol/vol glycerol, 2% wt/vol SDS, 0.01% bromophenol blue and 700 mM β-mercaptoethanol) were heated for 5 min at 95 °C and then electrophoretically resolved under denaturing conditions on 4–20% TGX precast polyacrylamide gels (Bio-Rad, catalogue number 5671095). For immunoblotting, samples were transferred from the gels to Immun-Blot PVDF membranes (Bio-Rad, catalogue number 13709A06) for 12 h at 25 V and RT in 25 mM Tris, 192 mM glycine and 10% vol/vol methanol. The membranes were blotted in 20 mM Tris–HCl pH 7.5 at RT, 150 mM NaCl, 0.01% vol/vol Tween 20 and 3% wt/vol fat-free milk solids (Apex, catalogue number 20241) using antibodies to the FLAG epitope (Sigma, F7425) and compatible horseradish peroxidase-conjugated secondary antibodies (Cytiva, NA934). The blots were developed by chemiluminescence (Perkin Elmer, NEL103001EA) and scanned on an Amersham ImageQuant 800 imaging system. For staining with Coomassie blue, gels were fixed in 50% vol/vol methanol and 10% vol/vol acetic acid for 30 min at RT, incubated for 30 min in 50% vol/vol methanol, 10% vol/vol acetic acid and 0.001% wt/vol Coomassie brilliant blue R-250 (Bio-Rad), and destained overnight in 10% vol/vol acetic acid before washing into water. The stained gels were digitized on an Epson Perfection V700 scanner using the Epson Scan 2 software.
Cell fractionation and FLAG immunoprecipitationCells cultured in YPGO medium (200 ml) were collected by centrifugation at 2,000g and 4 °C for 5 min, resuspended in an equivalent volume of water and re-pelleted. The final cell pellet was suspended in 3 ml chilled lysis buffer (20 mM HEPES·KOH pH 6.8 at RT, 150 mM potassium acetate, 5 mM magnesium acetate, 250 mM sorbitol and 1 mM EDTA) supplemented with protease-inhibitor tablets. The cell suspension was divided among three 2-ml screw-cap tubes on ice, supplemented with 1 mM phenylmethylsulfonyl fluoride and lysed by beadbeating with 0.5 mm glass beads on a mini-beadbeater (BioSpec). The cell debris was removed by centrifugation at 2,000g and 4 °C for 10 min, and the resulting lysate (2 ml) was further fractionated into a soluble supernatant and a membrane pellet by centrifugation at 20,000g and 4 °C for 30 min. A 1-ml aliquot of the supernatant fraction was supplemented with 1% wt/vol highly pure Triton X-100 (Thermo Fisher, catalogue number 85111) and incubated with anti-FLAG agarose beads (Millipore Sigma, A2220) for 1 h at 4 °C. The pellet fraction was gently washed with lysis buffer, resuspended in 2 ml lysis buffer supplemented with 1% Triton X-100, solubilized for 15 min on ice and clarified by centrifugation at 20,000g and 4 °C for 10 min. A 1-ml aliquot of the resulting solubilisate was incubated with anti-FLAG beads as described earlier. The beads were washed several times with lysis buffer supplemented with 0.01% Triton X-100 and finally boiled in an equivalent volume of 2×Laemmli buffer.
YG hydrogel permeation assayA solution of the purified wild-type YG-domain polypeptide (or the variant lacking the KPWE motif) was concentrated to 2 mM in 50 mM HEPES·NaOH pH 7.8 at RT, 2 M urea and 2 mM TCEP. Aliquots of 2 µl were then spotted on the bottom of multiple wells of a 96-well glass-bottomed plate (Cellvis, P96-1.5H-N), which was then sealed with a gas-impermeable AlumaSeal II film (Hampton Research, HR8-069) to prevent desiccation and incubated at RT for 24 h. Before each assay, the resulting gels were equilibrated overnight at RT in a 100-fold excess of Assay Buffer (25 mM HEPES·NaOH pH 7.8 at RT, 150 mM NaCl and 1 mM TCEP). A 0.5 µM solution of fluorescently labelled protein in Assay Buffer was then added to the samples, with or without additional components at the concentrations indicated in the text, and incubated at RT. Gels were imaged at the times indicated in the text using a Nikon A1R point-scanning confocal system consisting of an inverted Nikon Eclipse Ti microscope and a Nikon ×20 0.75 NA Plan Apo air objective. The objective was centred on the gel edge and focus was maintained 5 µm above the glass surface using the Nikon Perfect Focus System. Fluorescence was excited through a 405/488/561/647 quad-band dichroic (Chroma), using a 488-nm solid-state laser (Coherent) and a galvano scanner. A 50-nm emission band was collected on a gallium arsenide phosphide detector, using an ET525/50m (525 ± 25 nm) single-band bandpass filter (Chroma) and a pinhole dilated to 0.9 Airy units. Images were acquired using the Nikon NIS-Elements software with a pixel size of 1 µm and a 12-bit digitizer. Imaging parameters were configured to maximize the SNR while avoiding saturation. All samples intended to be compared were imaged using identical acquisition settings.
YG hydrogel release assayYG hydrogels were prepared in a glass-bottomed plate as described earlier and equilibrated for 3 h at RT in Assay Buffer containing 0.5 µM PEX7–GFP or PEX5–GFP with or without PTS2 peptide and receptor at the concentrations specified in the text. Following the initial incubation, the hydrogels were imaged on a Nikon A1R point-scanning confocal system, as described earlier, with a Nikon ×10 0.45 NA Plan Apo air objective, a pinhole dilated to 1.4 Airy units and a pixel size of 2 µm. A solution of purified PEX39 was then spiked into each reaction and the hydrogels imaged every 2 min for an additional 1 h at RT.
Bead-binding assaysCysteine-containing peptides were covalently conjugated to thiol-reactive SulfoLink coupling resin (Thermo Fisher, catalogue number 20401) according to the manufacturer’s instructions. The prepared beads were then mixed with Assay Buffer containing the fluorescently labelled protein as well as additional components indicated in the text, and the resulting bead suspensions were transferred to a 384-well glass-bottomed plate (Cellvis, P384-1.5H-N). GST-fusion proteins were instead mixed with glutathione agarose 4B (Prometheus, 20-543) in Assay Buffer containing the fluorescently labelled protein and additional components indicated in the text; the resulting bead suspensions were then transferred to a glass-bottomed plate as above. The plates were incubated at RT for the durations specified in the text and directly imaged on the spinning-disk confocal platform described earlier for peroxisomal import reactions in Xenopus egg extract. Note that imaging the beads directly in the binding reaction preserves the equilibrium and thereby allows even weak interactions to be detected. Fluorescence was collected through a Nikon ×10 0.45 NA Plan Apo air objective, and images were acquired using the Nikon NIS-Elements software and a 16-bit digitizer without binning. Imaging parameters were configured to maximize the SNR while avoiding saturation. Samples intended to be compared were imaged using identical acquisition settings.
Quantitative binding assaysFor the assay shown in Fig. 5d, 15 µl glutathione agarose 4B (Prometheus, 20-543) was mixed with 1 µM purified recombinant yeast PEX7 and varying concentrations of the GST-tagged variants of yeast PEX39, as indicated in the text, in a final volume of 50 µl. Reactions were prepared in Assay Buffer in low protein-binding tubes (Eppendorf, catalogue number 022431081) to minimize sample adhesion to the tube walls. The reactions were incubated at 25 °C for 1 h with agitation. The beads were then quickly sedimented for 30 s at 16,000g and RT, and 20 µl of each supernatant fraction was boiled in reducing Laemmli buffer. The samples were resolved by SDS–PAGE and stained with Coomassie blue as described earlier.
For the assay shown in Fig. 8b, the beads were first incubated with yeast PEX7 and the GST-tagged ∆APH variant of yeast PEX39 (each at 1 µM) for 30 min at 25 °C with agitation. Varying concentrations of the peptides, as indicated in the text, were then added and the reactions were incubated for a further 1 h under the same conditions. The beads were finally sedimented and the resulting supernatant fractions resolved by SDS–PAGE as above.
Statistics and reproducibilityAll experiments were repeated independently at least three times. No data were excluded from the analyses. Mathematical fitting was performed in GraphPad Prism using least-squares regression.
Bioinformatic analysisProteins containing KPWE motifs (or conservative variants) were identified in different species using the MOTIF Search tool at GenomeNet (https://www.genome.jp). Amino-acid sequences were aligned using Clustal Omega63. Secondary structure predictions were performed with AlphaFold 3 (ref. 64). Amino-acid conservation was calculated using ConSurf65. Helical-wheel diagrams were prepared using HeliQuest66.
Image analysisAll analyses were performed on the original unmodified images using routine functions in ImageJ67. Fluorescence images were first background-subtracted before further analysis.
For the YG hydrogel permeation assay, images were first oriented such that each gel edge faced the same direction. Fluorescence profiles across the buffer–gel interface were then generated by centering a 60 × 300 µm rectangular area on the gel edge and then measuring the mean fluorescence at each position within this selection. To express the resulting values in terms of fold enrichment, the fluorescence at each position along the selection was normalized to the average fluorescence in the buffer and plotted in terms of the distance from the gel edge.
For the PEX7-release assay from YG hydrogels, the total fluorescence within a 30-µm-wide band in the gel extending for 150 µm from the gel edge into the gel was measured at each time point. This distance was sufficient to fully encompass the permeation front of each fluorescent species. The resulting values were then normalized to the total fluorescence inside the gel at the start of the experiment and plotted as a function of time.
To calculate permeation rates through the YG hydrogel, a 60 × 300 µm rectangular area was first centred on the gel edge. The resulting region was then thresholded to demarcate the permeation zone (that is, the distance traversed by the fluorescent species) from the buffer and non-permeated part of the gel. The width of the area above the threshold was then measured and plotted as a function of time. A linear fit to the data yielded the permeation rate.
To calculate import rates in Xenopus egg extract, images were first thresholded to identify peroxisomes that were within the focal plane. A circular area with a diameter of 3 pixels was then centred on each local maximum and the mean fluorescence within this area was measured; the average fluorescence in the cytosol was then subtracted from the measured values. The resulting difference (that is, the peroxisome-associated fluorescence) was subsequently converted into a GFP concentration using a calibration curve of GFP fluorescence in the egg extract measured at different concentrations. The peroxisome-associated GFP concentrations were finally plotted as a function of time; linear fits to the data yielded the import rate.
To calculate the fraction bound in the quantitative binding assay, digitized images of Coomassie-stained gels were first converted into 16-bit grayscale and their pixel intensities inverted. The mean pixel intensity was then measured within a rectangular selection encompassing each PEX7 protein band and the mean intensity of the background was subtracted from the measured values. The background-corrected intensities (corresponding to unbound PEX7 remaining in solution) were in turn subtracted from the intensity of the PEX7 band in a sample without PEX39 (that is, total PEX7). The resulting difference (corresponding to PEX7 that had bound to the beads) was finally divided by the total PEX7 intensity to yield the fraction bound. The data were fitted either to a standard binding isotherm or a competitive-binding isotherm, as appropriate, to estimate the observed binding constants.
Image processing for publication and figure assemblyAll images intended to be compared were processed identically. Fluorescence micrographs were normalized to the background before being linearly contrast-stretched in ImageJ to the same bit range. Digitized images of immunoblots and Coomassie-stained gels were linearly contrast-stretched in ImageJ to reveal relevant bands but avoid clipping of the background, whereas photographs of YG hydrogels were processed using Adobe Photoshop. Structural models of proteins were rendered using the PyMOL Molecular Graphics System (Schrödinger). Figures were assembled for publication in Adobe Illustrator.
Reporting summaryFurther information on research design is available in the Nature Portfolio Reporting Summary linked to this article.
Comments (0)