
Remember me
Patched-1-heterozygous mutant mice (Ptch1+/−) with Sleeping Beauty (SB) transposon-mediated mutagenesis are an immune-competent genetically engineered model of MB with leptomeningeal metastases (Math1-GFP/active SB/Ptch1+/− or Ptch-SB)13,20. The normal leptomeninges consist of the cells from the pia mater, the arachnoid mater and enfolded cell types of the leptomeningeal vasculature21,22. To study leptomeningeal metastases, post-mortem spinal leptomeninges from Ptch-SB animals were isolated by shallowly incising the pia mater along the long axis of the spinal cord, and subsequently microdissecting the leptomeninges away from the neuronal contents of the spinal cord (Supplementary Fig. 1). Isolation of the leptomeninges allows imaging of the entire leptomeningeal axis, as well as single-cell RNA sequencing (scRNA-seq) that focuses exclusively on leptomeningeal cell types, minimizing contamination by the more numerous neurons and glia of the spinal cord proper.
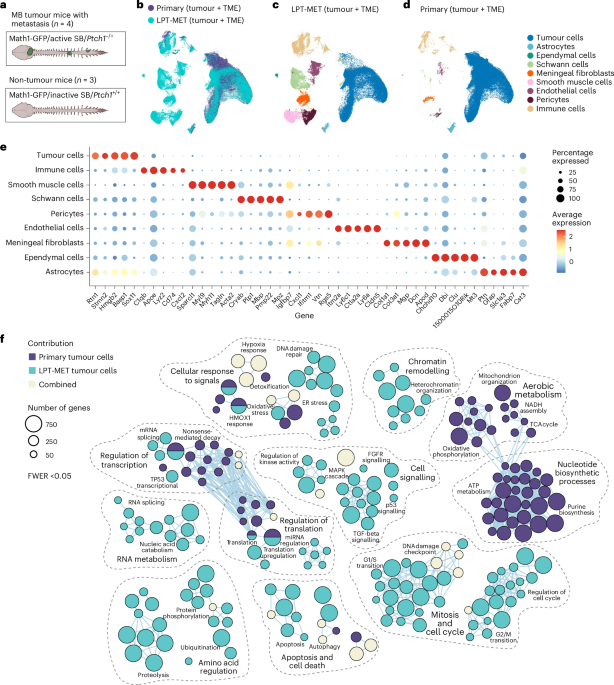
Primary tumour and spinal leptomeningeal dissections from Ptch-SB tumour-bearing mice with metastases and control leptomeninges from non-tumour-bearing mice were isolated for scRNA-seq (Fig. 1a). We first compared the transcriptomic data of 65,086 single cells from primary tumours and associated microenvironments, denoted as primary (tumour + tumour microenvironment (TME)), to 76,477 single cells from the spinal leptomeninges with metastases, denoted as LPT-MET (tumour + TME) (Fig. 1b). We observed a higher proportion of cells from the TME in the LPT-MET samples compared with primary tumour samples. Within both primary tumour and LPT-MET samples, we identified nine distinct, major cell clusters (Fig. 1c,d), including tumour cells, astrocytes, ependymal cells, Schwann cells, meningeal fibroblasts, smooth muscle cells, endothelial cells, pericytes and immune cell populations (Fig. 1e)23,24.
Fig. 1: MB primary and metastatic tumour cells are functionally distinct.
a, A schematic representation of mouse Ptch-SB primary tumour and spinal leptomeninges with metastasis (n = 4 mice) and Ptch-WT non-tumour spinal leptomeninges (n = 3 mice) collected for scRNA-seq. b, UMAP plot of cells from Ptch-SB cerebellar primary tumours with TME denoted as primary (tumour + TME), and spinal leptomeninges with metastasis denoted as LPT-MET (tumour + TME). c,d, UMAP plots of annotated cell populations from LPT-MET (tumour + TME) samples (c) and primary (tumour + TME) samples (d). e, A dot plot with expression across cell types of the top five markers by log fold change (MAST test, log fold change (LFC) >0.25, minimum percent expression >0.1). f, Gene Ontology (GO) terms associated with genes differentially expressed in primary and LPT-MET tumour cells. The circle sizes correspond to the number of differentially expressed genes found in each pathway (Holm FWER <0.05). See Supplementary Table 1 for the full gene list and pathways. ER, endoplasmic reticulum.
Comparison of single-cell transcriptional programs between pure primary tumour cells (which are less contaminated with TME cells) versus pure metastatic tumour cells revealed disparate cell-autonomous transcriptional programs with a switch from aerobic metabolism and nucleotide biosynthesis in primary tumours to amino acid metabolism in metastases (Fig. 1f, Extended Data Fig. 1a, b and Supplementary Table 1), suggesting a shift in metabolic states. LPT-MET tumour cells also differentially expressed genes associated with the cell cycle and growth factor signalling (Extended Data Fig. 1b). Thus, cell-autonomous tumour transcriptomes differ between the primary and metastatic MB compartments, as previously published13.
Pathway enrichment analysis of genes differentially expressed between primary tumours and metastases support a model in which the TME is distinct between primary MB and leptomeningeal metastases. Thus, we interrogated the niche-specific intercellular signalling by CellChat25. In the primary tumour, the tumour cells are the most active cell type in both ‘outgoing’ and ‘incoming’ intercellular signalling (Extended Data Fig. 2a). By contrast, intercellular signalling in LPT-MET samples was predominant between the TME and the tumour cells, or between distinct cell types of the TME (Extended Data Fig. 2b). We hypothesized that intercellular signalling between the metastatic tumour cells and the various cellular constituents of the TME might promote the colonization of the leptomeninges and the subsequent growth of metastatic MB.
Meningeal fibroblasts as a major source of signallingThe metastatic process is complex and requires multiple steps for colonization of new tumour sites. To determine potential molecular mechanisms by which tumour cells promote a hospitable niche within the leptomeninges, we compared the cell types in healthy, non-tumour-bearing leptomeninges (LPT-WT) and tumour-associated leptomeninges (LPT-MET). Although leptomeningeal metastases can occur at intracranial and spinal locations, we focused our analysis on the spinal leptomeninges. Single-cell transcriptomic data for 39,860 cells from LPT-WT and the 76,477 cells from LPT-MET were compared, revealing the presence of distinct cell types (Fig. 2a–c). All eight microenvironment cell types interacted with tumour cells and one another upon CellChat analysis (Fig. 2d), supporting a complex ecosystem in the metastatic niche. However, meningeal fibroblasts exhibited the strongest intercellular communication to metastatic tumour cells and the TME (Fig. 2e and Extended Data Fig. 3a).
Fig. 2: Distinct microenvironment signalling in the metastatic leptomeninges.
a, UMAP plot of cells from Ptch-WT control leptomeninges denoted as LPT-WT (ME only) and Ptch-SB leptomeninges with metastasis denoted as LPT-MET (tumour + TME). b,c, UMAP plots of annotated cell populations from LPT-WT (ME only) (b) and LPT-MET (tumour + TME) (c). d, Interaction plot of LPT-MET samples (the edge width represents the number of significant ligand–receptor pairs between any two cell populations, and the circle sizes represent the number of cells in each population). e, Detailed pie charts showing the proportion of interactions from the metastatic cells to the TME (left) and from the TME to the metastatic cells (right). f,g, Whole-mount Ptch-SB spinal leptomeninges with metastasis (LPT-MET) fluorescently labelled with GFP+ tumour and CD31+ endothelium (scale bar, 1,500 µm) (f) and GFP+ tumour, CD31+ endothelium and laminin with tumour cells associating with larger meningeal blood vessels (left) and a smaller network of vessels (right) (n = 47 images) (g). h, Representative whole-mount spinal leptomeninges from a Pdgfra-H2BeGFP reporter mouse fluorescently labelled with GFP+ meningeal fibroblasts, collagen IV (ColIV) basement membrane and DAPI. Fibroblasts are found in the extracellular space and surround blood vessels (left). At a higher magnification, fibroblasts are shown to closely associate with blood vessels (right) (n = 15 images). i, Spinal cord cross-sections of Ptch-WT LPT-WT and Ptch-SB LPT-MET fluorescently labelled with collagen I (Col1), PDGFRα+ fibroblasts, GFP+ tumour and DAPI. The left panels show the merge, and the right panels show the GFP and PDGFRα channels (yellow arrows highlight PDGFRα+ GFP− fibroblasts). j, The proportion of PDGFRα+ fibroblasts (PDGFRα+ GFP− cells) per field of view (n = 10 and n = 12 images for LPT-WT and LPT-MET, respectively). k, Phospho-histone H3 (PH3) and PDGFRα double-positive fibroblasts normalized to PDGFRα volume quantified per field of view (n = 15 and n = 28 images for LPT-WT and LPT-MET, respectively). P values were generated from two-tailed unpaired t-test with Welch’s correction, the centre line represents the mean and error bars represent the standard deviation for j and k. Scale bars, 120 µm (g–i).
We then interrogated the anatomical relationships between GFP-labelled tumour cells within the spinal leptomeninges and specific TME cell types in the Ptch-SB model. Although the degree and distribution of leptomeningeal metastases can vary between mice, GFP-labelled metastatic tumour cells can be found along the entire rostral–caudal extent of the spinal cord and in close physical relationship to the leptomeningeal blood vessels (Fig. 2f). The metastatic tumour cells reside in an extracellular matrix (ECM)-rich TME, surrounding both larger and smaller networks of vessels (Fig. 2g). Meningeal fibroblasts and oligodendrocyte precursor cells are known to express platelet-derived growth factor (PDGF) receptor α (PDGFRα)23,26. We confirmed that Pdgfra was expressed in the meningeal fibroblasts, along with the known meningeal fibroblast markers Col1a1, Dcn and Lum (Extended Data Fig. 4a–d). Oligodendrocyte precursor cell markers, Olig1 and Olig2, were nearly absent in our scRNA-seq data, with the exception of a few metastatic tumour cells (Extended Data Fig. 4e,f). As a proportion of metastatic tumour cells express Pdgfra (Extended Data Fig. 4a), we excluded the PDGFRα and GFP double-positive tumour cells from subsequent analyses. We visualized the meningeal fibroblasts through Pdgfra-H2BeGFP reporter mice27. Meningeal fibroblasts surround leptomeningeal blood vessels and are also found attached to the pia mater or arachnoid mater (Fig. 2h). Indeed, the distribution of meningeal fibroblasts mirrored the distribution of metastatic tumour cells (Fig. 2g,h). This close spatial approximation of metastatic tumour cells and meningeal fibroblasts support the relevance of the intercellular signalling relationships identified at a transcriptional level by CellChat. We also found that the metastatic leptomeninges contain more PDGFRα-positive meningeal fibroblasts (Fig. 2i,j) and were more proliferative than fibroblasts from healthy leptomeninges (Fig. 2k).
We also compared meningeal fibroblasts from high versus low regions of patient-derived tumour xenografts, demonstrating increased proliferative indices of high tumour burden meningeal fibroblasts as measured by Ki67 (Fig. 3a). To determine the potential molecular mechanisms by which metastatic tumour cells influence meningeal fibroblasts, we compared intercellular signalling networks between metastatic tumour cells and meningeal fibroblasts. PDGF signalling appeared to signal from the metastatic tumour cells to the meningeal fibroblasts (Fig. 3b). To test the causative role of PDGF signalling, we overexpressed the secreted ligand PDGFA in the group 3 MB line, D458, showing that PDGFA secreting D458 clones recruited more meningeal fibroblasts than vector control tumour cells but did not affect fibroblast proliferation (Fig. 3c). We also showed that, when PDGFA was overexpressed, tumour cells were more proliferative (Fig. 3d) and the overall survival of mice was reduced in vivo (Fig. 3e). Thus, tumour cells secreting PDGFA, which diffuses into the local microenvironment, recruit additional meningeal fibroblasts to the metastatic niche, ultimately increasing tumour proliferation and reducing overall survival in vivo.
Fig. 3: Meningeal fibroblasts are recruited and undergo proliferation in the presence of tumour cells.
a, Whole-mount spinal leptomeninges from Pdgfra-H2BeGFP/NSG mice implanted with MB813–mCherry and D458–mCherry cells into the lateral ventricle and fluorescently labelled with GFP+ fibroblasts, mCherry (MB813 tumour), Ki67 and DAPI. The proportion of PDGFRα and Ki67 double-positive cells in control (sham injection) and MB813 and D458 (tumour low and high regions) samples was quantified per field of view (n = 10, 8, 13, 9 and 12 images for control, MB813 low, MB813, D458 low and D458, respectively). b, A chord diagram of scRNA-seq data highlighting the signalling pathways from Ptch-SB metastatic tumour cells to the meningeal fibroblasts. c, A schematic representation of the experimental design with D458 cells overexpressing PDGFA and signalling to PDGFRα+ meningeal fibroblasts (far left). Whole-mount spinal leptomeninges fluorescently labelled with GFP+ fibroblasts, BFP+ tumour and Ki67 from Pdgfra-H2BeGFP/NSG mice implanted with D458 cells expressing control BFP and PDGFA-BFP into the lateral ventricle. The total PDGFRα+ cells and proportion of PDGFRα and Ki67 double-positive cells were quantified per field of view (n = 14 and n = 10 images for control BFP and PDGFA-BFP, respectively). d, Quantifications from whole-mount spinal leptomeninges of NSG mice implanted with D458 GFP-Luc control-BFP and D458 GFP-Luc PDGFA-BFP into the lateral ventricle and fluorescently labelled with Ki67. The total number of Ki67+ GFP+ tumour cells was normalized to the total GFP+ tumour volume per field of view (n = 10 images per group). e, Kaplan–Meier survival analysis from NSG mice implanted with D458 GFP-Luc control-BFP (n = 7 mice) and D458 GFP-Luc PDGFA-BFP (n = 7 mice) into the lateral ventricle (log-rank (Mantel–Cox) test was performed). P values were generated from two-tailed unpaired t-test with Welch’s correction, the centre line represents mean and the error bars represent the standard deviation for a, c and d. n.s., not significant (P = 0.3166). Scale bars, 120 µm (a and c).
LPT-MET fibroblasts are transcriptionally distinctTo define the transcriptional heterogeneity between meningeal fibroblasts in the metastatic niche, we compared the scRNA-seq data from 1,601 healthy LPT-WT fibroblasts and 4,510 LPT-MET associated fibroblasts. We identified a subpopulation of LPT-MET fibroblasts that were transcriptionally distinct from LPT-WT fibroblasts (Fig. 4a). We performed differential gene expression and pathway analysis to identify any functional heterogeneity (Fig. 4b and Supplementary Table 2). Transcriptional programs specific to LPT-MET fibroblasts included TGFβ, BMP, WNT and ERK1/2 pathways (Fig. 4b and Extended Data Fig. 5a). LPT-MET fibroblasts differentially expressed genes associated with ECM organization, leukocyte migration, angiogenesis, cell death, differentiation and proliferation (Extended Data Fig. 5b–d). Unsupervised clustering of meningeal fibroblast populations identified seven unique clusters of fibroblasts, which we have designated as LMF1 through LMF7 (Fig. 4c). Cluster LMF1 was associated with ECM remodelling genes, including Mfap4, Fbln1, Bgn, Itih5 and Vtn (Extended Data Fig. 6a) and was significantly higher in LPT-MET compared with LPT-WT fibroblasts (Fig. 4d and Extended Data Fig. 6b). By contrast, cluster LMF2 was higher in LPT-WT fibroblasts and marked by high expression of Tgfbi, Gpc3 and Trf (Fig. 4d and Extended Data Fig. 6a,b). Cluster LMF5 displayed a tumour-like signature with increased expression of Stmn1, Hmgb2 and Sox11, and cluster LMF7 expressed immunoregulatory genes, including C1qa, C1qb, Lyz2, Cd74 and Cxcl2 (Extended Data Fig. 6a).
Fig. 4: Meningeal fibroblast heterogeneity in the metastatic niche.
a, UMAP plot of meningeal fibroblast recluster from Ptch-WT control leptomeninges (LPT-WT) and Ptch-SB leptomeninges with metastasis (LPT-MET) samples. b, GO terms associated with the genes differentially expressed in meningeal fibroblasts from LPT-WT and LPT-MET samples. The circle sizes correspond to the number of differentially expressed genes found in each pathway (Holm FWER <0.05). See Supplementary Table 2 for the full gene list and pathways. c, UMAP plot of meningeal fibroblast recluster identities (LMF1–LMF7) from LPT-WT and LPT-MET samples. d, Pie charts showing the proportion of LMF1–LMF7 clusters in LPT-WT and LPT-MET samples. e, GO terms enriched in the LPT-MET LMF1 cluster (P values were generated using g:Profiler’s Significance Correction Strategy (gSCS))40. f, A dot plot showing the myofibroblastic, inflammatory, antigen-presenting and general CAF signature expression in LMF1–LMF7 clusters.
We focused on cluster LMF1 because it is overrepresented in LPT-MET samples as compared with LPT-WT controls (Fig. 4d) and has a transcriptional program associated with ECM organization, wound healing, cell adhesion and proliferation (Fig. 4e). LMF1-enriched transcriptional pathways closely resemble metastasis-associated pathways identified in Fig. 4b, consistent with LMF1-type meningeal fibroblasts being the dominant fibroblast population in the metastatic niche. Furthermore, as LPT-MET transcriptional programs resemble those of cancer-associated fibroblasts (CAF) from systemic (non-neural) tumours, we compared our LPT-MET fibroblast signatures with published CAF signatures28,29. The LMF1 cluster most closely resembled myofibroblastic CAFs, characterized by Col1a1, Col4a1, Tgfb1 expression and general CAFs, characterized by Pdgfra and Pdgfrb expression, whereas the LMF7 cluster resembled inflammatory, or antigen-presenting, CAF signatures (Fig. 4f). These findings are consistent with a model in which the presence of metastatic tumour cells recruit and reprogram meningeal fibroblasts.
CAFs progressively co-evolve with tumour cells over time as cancers progress30. To test the model of temporally evolving fibroblasts in our MB experimental system, we contrasted the meningeal fibroblasts between LPT-MET samples of low metastatic burden with higher metastatic burden (Extended Data Fig. 7a). Highly metastatic samples had a trend towards an increased representation of the LMF1 and LMF5 clusters as compared with LPT-MET samples with a lower metastatic burden (Extended Data Fig. 7b). Fibroblasts from low LPT-MET samples transcriptionally resembled inflammatory CAFs, while fibroblasts from high LPT-MET samples resembled myofibroblastic CAFs (Extended Data Fig. 7c). The differences between the transcriptional programs of the fibroblasts from low and high LPT-MET samples (Extended Data Fig. 7d and Supplementary Table 3) support a model in which the fibroblasts are progressively recruited and reprogrammed in the niche with the accumulation of metastatic tumour cells. Interference with the recruitment, reprogramming and/or intercellular signalling between tumour cells and meningeal fibroblasts in the metastatic niche could represent a strategy for the prevention of metastatic MB or the treatment of established metastases.
Fibroblast-derived BMP ligands enhance metastatic growthTo determine the specific molecular mechanisms by which meningeal fibroblasts support metastatic cells, we analysed the incoming tumour-specific CellChat data. Prominently, BMP signalling from the meningeal fibroblasts was enriched in LPT-MET samples (Extended Data Fig. 8a,b). Most of the major signalling pathway networks were between neuronal cell types, and there were only a few pathways, including BMP, HSPG, FGF, WNT and HH signalling, in which the ‘sender’ population was from the leptomeningeal microenvironment (Extended Data Fig. 8b). In control LPT-WT samples, Bmp5 was expressed by the meningeal fibroblasts and signalled to pericytes (Fig. 5a,d). With low metastatic burden, meningeal fibroblasts expressed Bmp4, Bmp5 and Bmp7 to signal to the metastatic tumour cells and local astrocytes, ependyma, smooth muscle cells and pericytes (Fig. 5b,d). Upon progression to high metastatic burden, meningeal fibroblasts express Bmp4 and Bmp7 to act on the tumour cells (Fig. 5c,d). We confirmed that BMP4 and BMP7 protein was detected in the LPT-MET niche, but not primary tumours, using immunofluorescence (IF) (Fig. 5e,f). BMP4 and BMP7 signals preferentially associated with the GFP-labelled LPT-MET cells, as compared with the GFP-negative microenvironment cells (Fig. 5e and Fig. 5f, respectively). BMP signalling activity can be measured by phosphorylation of SMAD1 and SMAD5 (pSMAD1/5)31. Indeed, LPT-MET cells exhibited elevated levels of pSMAD1/5 not observed in primary tumour controls (Fig. 5g). Furthermore, BMP target genes, Id1 and Id2 (ref. 32), were transcriptionally upregulated in LPT-MET tumour cells, as compared with primary tumour cells (Fig. 5h). In an orthogonal model, sonic hedgehog (SHH) MBs from Smoothened A1 genetically engineered mice also exhibited increased expression of BMP4, BMP7 and pSMAD1/5 in the LPT-MET samples as compared with the primary tumour (Extended Data Fig. 9a–c)33.
Fig. 5: Meningeal fibroblast-derived BMP ligands signal to metastatic tumour cells.
a–c, Chord diagram (top) and schematic diagram (bottom) demonstrating the BMP signalling interactions from meningeal fibroblasts to the microenvironment of non-tumour leptomeninges (LPT-WT) (a), low leptomeningeal metastatic burden (low LPT-MET) (b) and high leptomeningeal metastatic burden (high LPT-MET) samples (c), with BMPR1A_R2 denoted as 1A_R2 and BMPR1B_R2 denoted as 1B_R2. d, Violin plots showing Bmp5, Bmp4 and Bmp7 expression in meningeal fibroblasts from LPT-WT, low LPT-MET and high LPT-MET scRNA-seq samples. e,f, Ptch-SB spinal cord with metastasis (LPT-MET) and primary tumour cross-sections fluorescently labelled with GFP, ERTR7, DAPI and BMP4 (e) or BMP7 (f). The proportion of tumour cells (GFP+) and microenvironment cells (GFP−DAPI+) close to BMP4-positive signal (n = 14 and n = 15 images for LPT-MET and primary, respectively) (e) and BMP7-positive signal (n = 13 and n = 8 images for LPT-MET and primary, respectively) (f) was quantified per field of view. g, Ptch-SB spinal cord LPT-MET and primary tumour cross-sections fluorescently labelled with GFP, pSMAD1/5 and ERTR7. The pSMAD and GFP double-positive cells normalized to total GFP volume were quantified in LPT-MET samples and primary tumour core and boundary regions per field of view (n = 37, 10 and 9 images for LPT-MET, core and boundary, respectively). P values were generated using two-tailed unpaired t-test with Welch’s correction, the centre line represents the mean and error bars represent the standard deviation, *P < 0.0001. Scale bars, 120 µm (e–g). h, Box plots showing Id1 and Id2 mean expression per sample in primary tumour (n = 4 mice) and LPT-MET tumour cells (n = 4 mice) from the scRNA-seq data. The centre line represents the median (50% percentile), the hinges represent 25% and 75% percentiles, and the whiskers represent the 1.5 interquartile range. P values were generated using a two-tailed Student’s t-test.
As ID1 is a BMP target gene, we compared single-cell transcriptomes of Id1-positive versus Id1-negative LPT-MET tumour cells to identify BMP-associated transcriptional programs, which showed elevated transcription of cell cycle progression genes in the Id1-positive cells (Fig. 6a). Consistently, approximately 27% of ID1-positive cells expressed the proliferation marker Ki67 (Fig. 6b). We conclude that reprogrammed fibroblasts secrete BMP4 and BMP7 in the metastatic niche, enhancing the BMP signalling and proliferation of LPT-MET cells.
Fig. 6: Enhanced cell cycle progression and leptomeningeal colonization in metastatic tumour cells with active BMP signalling.
a, Violin plots showing cell cycle progression gene expression in Id1− and Id1+ LPT-MET tumour cells from the scRNA-seq data. Two-tailed Student’s t-test was performed. *P < 2.22 × 10⁻¹⁶. b, Whole-mount Ptch-SB spinal leptomeninges with metastasis fluorescently labelled with GFP, ID1 and Ki67 with the proportion of ID1 and Ki67 double-positive cells quantified per field of view (n = 5 images; the centre line represents the mean, and error bars represent the standard deviation; scale bars, 120 µm). c, BLI 38 days after NSG mice were implanted with D458 Luc-ZsGreen tumour cells expressing control and BMPR1A-CA into the lateral ventricle (cohort of n = 5 mice per group are shown). d, Total flux (photons s−1) quantifications of D458 Luc-ZsGreen control and BMPR1A-CA (n = 10 mice per group). e, The proportion of GFP-positive area on the surface of the brain, spinal cord and peripheral nerves of D458 Luc-ZsGreen control and BMPR1A-CA (n = 10 mice per group). P values were generated using two-tailed unpaired t-test with Welch’s correction, the centre line represents the mean, and error bars represent the standard deviation for d and e. f, Kaplan–Meier survival analysis from NSG mice implanted with D458 Luc-ZsGreen control (n = 9 mice) and BMPR1A-CA (n = 10 mice) into the lateral ventricle (log-rank (Mantel–Cox) test was performed).
To formally test a causative role for fibroblast-derived BMP signalling in LPT-MET cells, we overexpressed a constitutively active (CA) BMPR1A (Q233D) in D458 MB tumour cells expressing luciferase and ZsGreen (Luc-ZsGreen)34. BMPR1A-CA-expressing tumour cells and vector control cells were implanted into the lateral ventricle of immunocompromised (NOD.Cg-Prkdc scid Il2rg tm1Wjl/SzJ; NSG) mice to assess leptomeningeal colonization. BMPR1A-CA-expressing tumour cells, but not vector control cells, exhibited enhanced leptomeningeal colonization, with a greater proportion of mice displaying spinal colonization (3/5 mice), as compared with control tumour cells (0/5 control mice; Fig. 6c,d). We also quantified the GFP-positive area along the craniospinal axis as a measure of tumour burden after the humane endpoint and demonstrated increased tumour burden in mice engrafted with BMPR1A-CA-expressing cells (Fig. 6e). Furthermore, mice engrafted with BMPR1A-CA-expressing cells displayed worse overall survival compared with control mice (Fig. 6f). These findings are consistent with BMP signalling from recruited and reprogrammed fibroblasts promoting the growth of established leptomeningeal metastases.
Metastasis-associated fibroblasts support tumour colonizationTo further investigate the function of reprogrammed fibroblasts in the metastatic cascade, we performed in vivo co-implantation studies using group 3 MB patient-derived xenografts. The MB411 line was transduced with GFP and luciferase (GFP-Luc) and implanted into the cerebellum of NSG mice. At the humane endpoint, the primary tumour and spinal leptomeninges with metastasis were collected, and a single-cell suspension was generated for fluorescence-activated cell sorting (FACS). To isolate the PDGFRα-positive fibroblasts from the metastatic leptomeninges (MB-MAFs), we followed a gating strategy that excluded the GFP-labelled tumour cells, pericytes/smooth muscle cells (marked by CD146), immune cells (CD45) and endothelial cells (CD31) (Fig. 7a). We also sorted the GFP-positive MB411 primary tumour cells for co-implantation with the isolated PDGFRα-positive fibroblasts (designated as MB411 + MB-MAFs) into the lateral ventricles of NSG mice (Fig. 7b,c). Eight weeks after implantation, the bioluminescence signal along the craniospinal axis was higher in the mice co-implanted with MB411 + MB-MAFs, as compared with mice implanted with MB411 cells alone (Fig. 7d). Furthermore, mice co-implanted with MB411 + MB-MAFs developed spinal colonization more frequently (4/5 mice) than mice implanted with MB411 cells alone (1/5 mice; Fig. 7d). Quantification of the GFP-positive area along the craniospinal axis demonstrated that the addition of MB-MAFs massively increased the tumour burden as compared with controls (Fig. 7e,f). This observed increase in tumour burden led to worse overall survival in mice co-implanted with MB-MAFs compared with control mice (Fig. 7g). We conclude that reprogrammed MB-MAFs play an active causal role in the establishment of leptomeningeal metastases.
Fig. 7: Metastasis-associated fibroblasts support leptomeningeal colonization.
a,b, FACS plots demonstrating the gating strategy used to sort live GFP−/CD45−/CD146−/CD31−/PDGFRA+ fibroblasts from the spinal leptomeninges (a) and live GFP+ tumour cells from the primary tumour of NSG mice with cerebellar implantation of MB411 GFPLuc (b). The proportions of cells within the indicated gates are shown. See also Supplementary Data 1 for the full gating strategy. c, A schematic representation of the co-implantation experiments into the leptomeninges of NSG mice. d, BLI and total flux (photons s−1) quantifications 8 weeks after NSG mice were implanted with MB411 GFPLuc alone and MB411 GFPLuc co-implanted with metastasis-associated fibroblasts (MB411 + MB-MAFs) isolated by FACS (n = 5 mice per group). e, Stereomicroscope images of dissected peripheral nerves (highlighted in schematic with dashed red box) from NSG mice implanted with MB411 alone and MB411 + MB-MAFs (scale bars, 1 mm). f, The proportion of GFP-positive area on the surface of the brain, spinal cord and peripheral nerves of NSG mice implanted with MB411 alone and MB411 + MB-MAFs into the lateral ventricle (n = 5 mice per group). P values were generated using two-tailed unpaired t-test with Welch’s correction; the centre line represents the mean, and error bars represent the standard deviation for d and f. g, Kaplan–Meier survival analysis from NSG mice implanted with MB411 alone and MB411 + MB-MAFs into the lateral ventricle (n = 3 mice per group). h, A schematic representation of the anti-PDGFRα treatment experiments. i, BLI 19 days after treatment of NSG mice implanted with D458 Luc-ZsGreen into the lateral ventricle with either IgG control or anti-PDGFRα neutralizing antibody administered into the lateral ventricle (cohort of n = 5 mice per group are shown). The dashed magenta box highlights spinal colonization. j, Kaplan–Meier survival analysis from NSG mice implanted with D458 Luc-ZsGreen and treated with either IgG control (n = 10 mice) or anti-PDGFRα neutralizing antibody (n = 9 mice). P values were generated using log-rank (Mantel–Cox) test for survival analyses in g and j.
To target MB-MAF function, we treated xenografted mice with a PDGFRα neutralizing antibody. The D458 Luc-ZsGreen tumour cells were implanted into the lateral ventricle of NSG mice. Ten days after implantation, IgG control and anti-PDGFRα neutralizing antibody was administered into the lateral ventricles of xenografted mice and the mice were monitored until the humane endpoint (Fig. 7h). After anti-PDGFRα treatment, there was a reduced proportion of mice with spinal colonization (2/5 mice) compared with mice treated with the IgG control (4/5 mice; Fig. 7i), leading to prolonged survival (Fig. 7j). Thus, metastasis-associated fibroblasts support leptomeningeal colonization, and inhibiting fibroblast function improves overall survival in patient-derived xenograft models.
Together, our findings support a model in which meningeal fibroblasts are recruited in the presence of metastasis, partly through PDGFA secretion. Meningeal fibroblast recruitment is followed by proliferation and reprogramming to become MB-MAFs, which subsequently secrete BMP4/7, driving tumour cell division and enhancing leptomeningeal colonization. In turn, the MB-MAFs in a ‘folie a deux’ support additional leptomeningeal colonization and growth of existing metastases (Extended Data Fig. 10).
Comments (0)