
Remember me

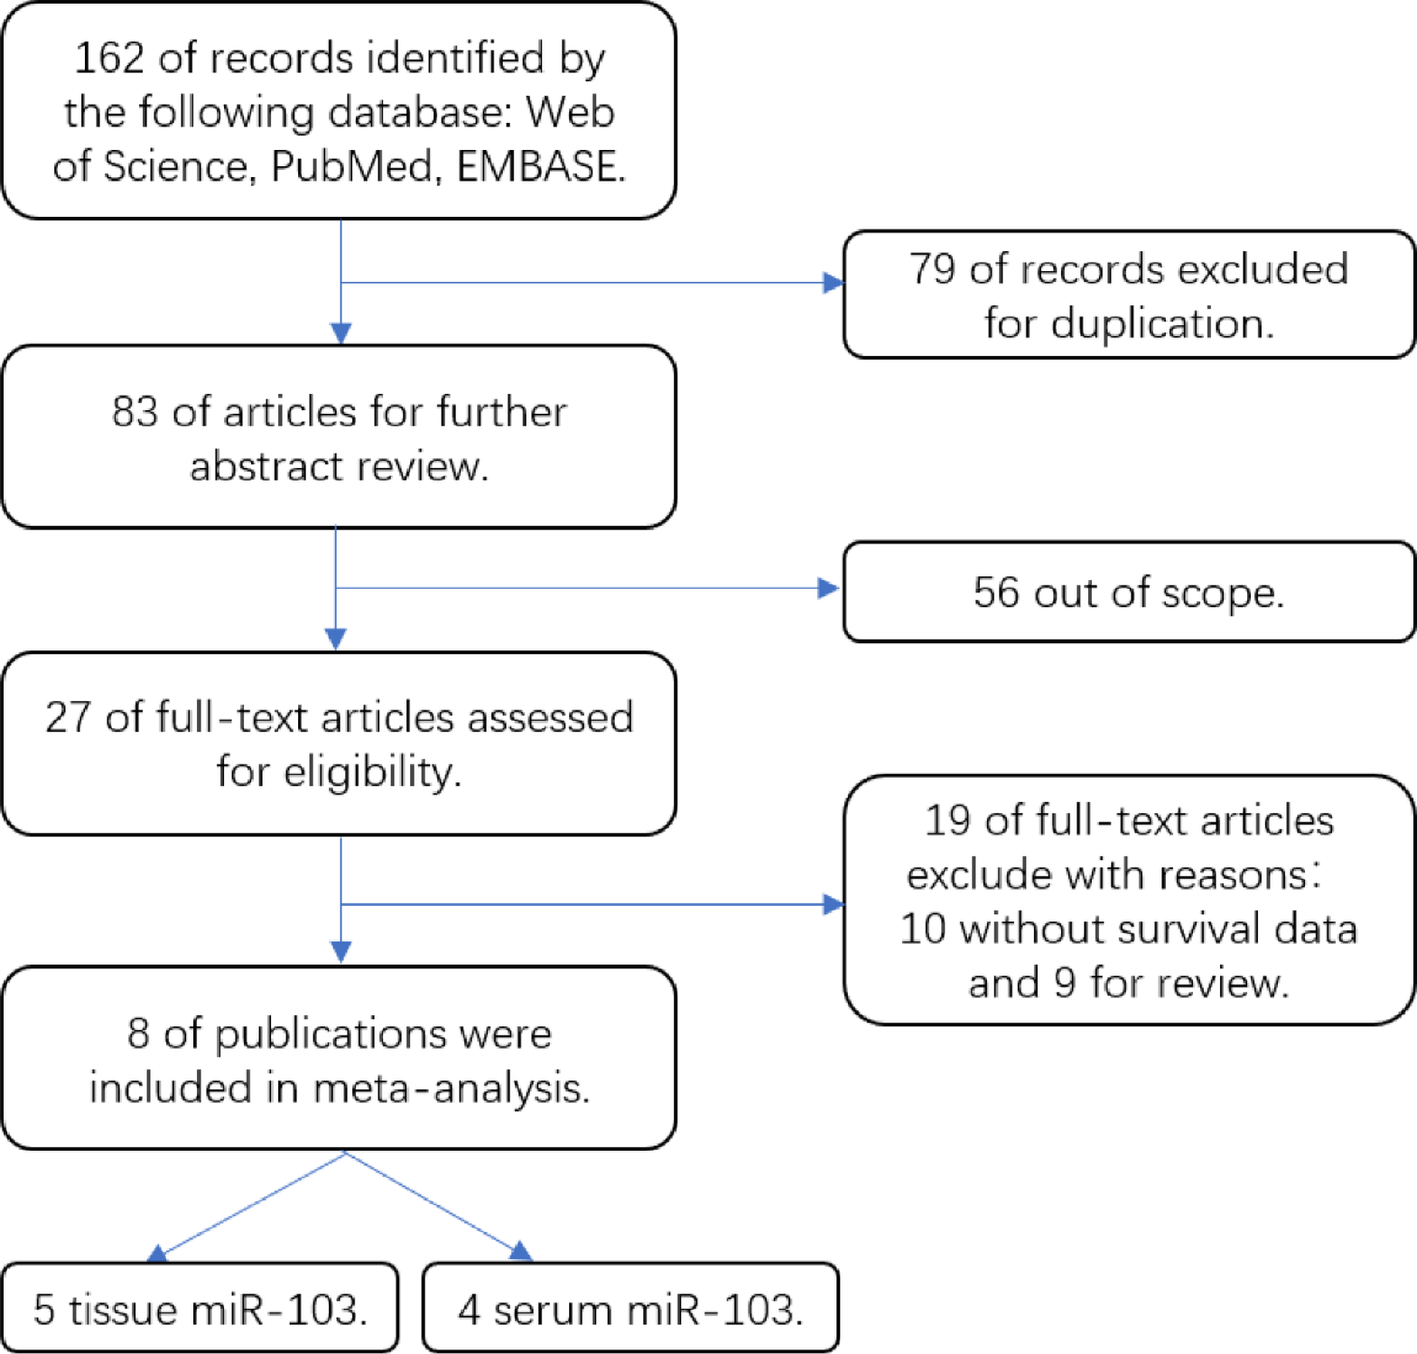

In total, 162 relevant articles were retrieved from the PubMed, Web of Science, and EMBASE databases, of which, nine studies from eight articles were eligible meta-analyses, as shown in Fig. 1. The final analysis included 825 patients (average sample size = 91.7; range: 38–131) with six different solid tumour types, gastric cancer, colorectal cancer (CRC), breast cancer, squamous cell carcinoma of the oral tongue, nasopharyngeal carcinoma, and triple negative breast cancer. The patients were followed for less than 60 months in one study [21], but for greater than or equal to 60 months in the other eight studies [16, 19, 22,23,24,25,26], with Berania et al.‘s article containing two studies [22]. All eight articles were written in English, six were from China [16, 19, 21, 23,24,25], one from Canada [22], and one from Italy [26] and they were published from 2014 to 2018. All research explored the correlation between microRNA-103 and cancer prognosis in tissue [16, 19, 21, 22] or serum [23,24,25,26], with the serum studies having a better NOS score than the tissue studies (mean NOS score: 7.5 vs. 7). Table 1 summarises the main study characteristics.
Fig. 1
Study Flow Diagram. Selection of clinical studies for meta-analyses of associations between solid tumor and tissue or serum microRNA-103
Table 1 Main character of 9 studies included in the meta-analysis7.2 Meta-analysis of microRNA-103 and OS: heterogeneity analysis in the tissue sample groupThe studies of solid tumour tissue samples revealed that microRNA-103 overexpression was not associated with OS (RR = 1.88, 95% CI: 0.89–3.98, P = 0.097) and heterogeneity observed between studies (I2 = 77.9%, P = 0.001) (Fig. 2). According to the sensitivity analysis, the data of Zheng (2017) had a great impact on the overall results, so this data was excluded and the results recombined (Fig. 3), showing that high microRNA-103 expression in tissue samples was associated with poor prognosis (RR = 2.65, 95% CI: 1.79–3.93, P = 0.000). There was no qualitative evidence of RR heterogeneity (I2 = 0.00%, P = 0.895).
Fig. 2
Meta-analysis between poor patient overall survival and overexpression of microRNA-103 in tissue sample group
Fig. 3
Meta-analysis between poor patient overall survival and overexpression of microRNA-103 in tissue sample group after eliminate the first data
7.3 Meta-analysis of microRNA-103 and OS: heterogeneity analysis in the serum sample groupAccording to Fig. 4, high microRNA-103 expression in serum was associated with poor prognosis (RR = 3.31, 95% CI: 2.04–5.36, P = 0.000). There was no qualitative evidence of RR heterogeneity (I2 = 46.5%, P = 0.132).
Fig. 4
Meta-analysis between poor patient overall survival and overexpression of microRNA-103 in serum sample group
7.4 Comprehensive analysis of microRNA-103 and OS: heterogeneity in the two sample groupsA comprehensive analysis of all data (Fig. 5) showed that high expression of microRNA-103 in tissues and serum was associated with poor prognosis (RR = 2.90, 95% CI: 2.25–3.74, P = 0.000). There was no qualitative evidence about RR heterogeneity (I2 = 0.00%, P = 0.476).
Fig. 5
Meta-analysis between poor patient overall survival and overexpression of microRNA-103 in all sample groups
7.5 Human tissue tests showed high expression of miRNA-103 in tumour patientsRT-qPCR shows that the relative expression level of microRNA-103 in serum and tissue is higher than normal patient (Fig. 6), indicating that serum and tissue microRNA-103 is a potential marker to predict the prognosis of human solid tumours.
Fig. 6
Relative expression level of MicroRNA-103 in serum and tissue. (A) Tissue sample group. (B) Serum sample group. All data are displayed as means ± SD; mean values for the normal group were normalized to 1.0; **P < 0.01 and @@P < 0.01 vs. normal group; n = 20
7.6 Publication bias and sensitivity analysisAs shown in Fig. 7A and C, the funnel plot is asymmetrical, P Begg’s test = 0.806, and P Egger’s test = 0.594, therefore there is no significant publication bias in the tissue sample studies. Similarly, there was no publication bias in the serum sample studies (PBegg’s test = 1.000, PEgger’s test = 0.431) according to Fig. 7B and D. As shown in Fig. 8, the OS sensitivity analysis of the tissue sample and the serum sample studies was negative.
Fig. 7
Begg’s test and Egger’s test for publication bias test for OS. (A) Tissue sample group Begg’s test, (B) Serum sample group Begg’s test, (C) Tissue sample group Egger’s test, (D) Serum sample group Egger’s test
Fig. 8
Sensitivity analysis between high expression of microRNA-103 and poor OS. (A) Tissue sample group, (B) Tissue sample group after eliminate the first data, (C) Serum sample group, (D) Comprehensive analysis of all sample
Comments (0)