
Remember me


Utilizing the DepMap Achilles project database, this research conducted an analysis of 31 ESCA cell lines, which included 7 ESCC cell lines and 24 EAC cell lines. Following a stringent selection process, 1,745 genes with an average dependency score greater than 0.5 were ultimately identified, regarded as potential survival dependency genes (SDGs). Subsequently, KEGG enrichment analysis (Fig. 2A) of these 1,745 genes demonstrated significant enrichment in biological processes including the cell cycle, ribosome biogenesis, proteasome function, DNA replication, RNA degradation, and oxidative phosphorylation.
Gene Ontology (GO) enrichment analysis (Fig. 2B) indicated that SDGs were primarily enriched in biological processes (BP) associated with ribonucleoprotein complex biogenesis and ribosome biogenesis. In terms of cellular components (CC), SDGs were predominantly enriched in spliceosomal complexes and ribosomes. They were primarily enriched in molecular functions (MF) related to ATP hydrolysis activity.
Fig. 2
Identification of survival-dependent genes. (A) SDGs were gathered for KEGG enrichment analysis. (B) SDGs were gathered for GO enrichment analysis
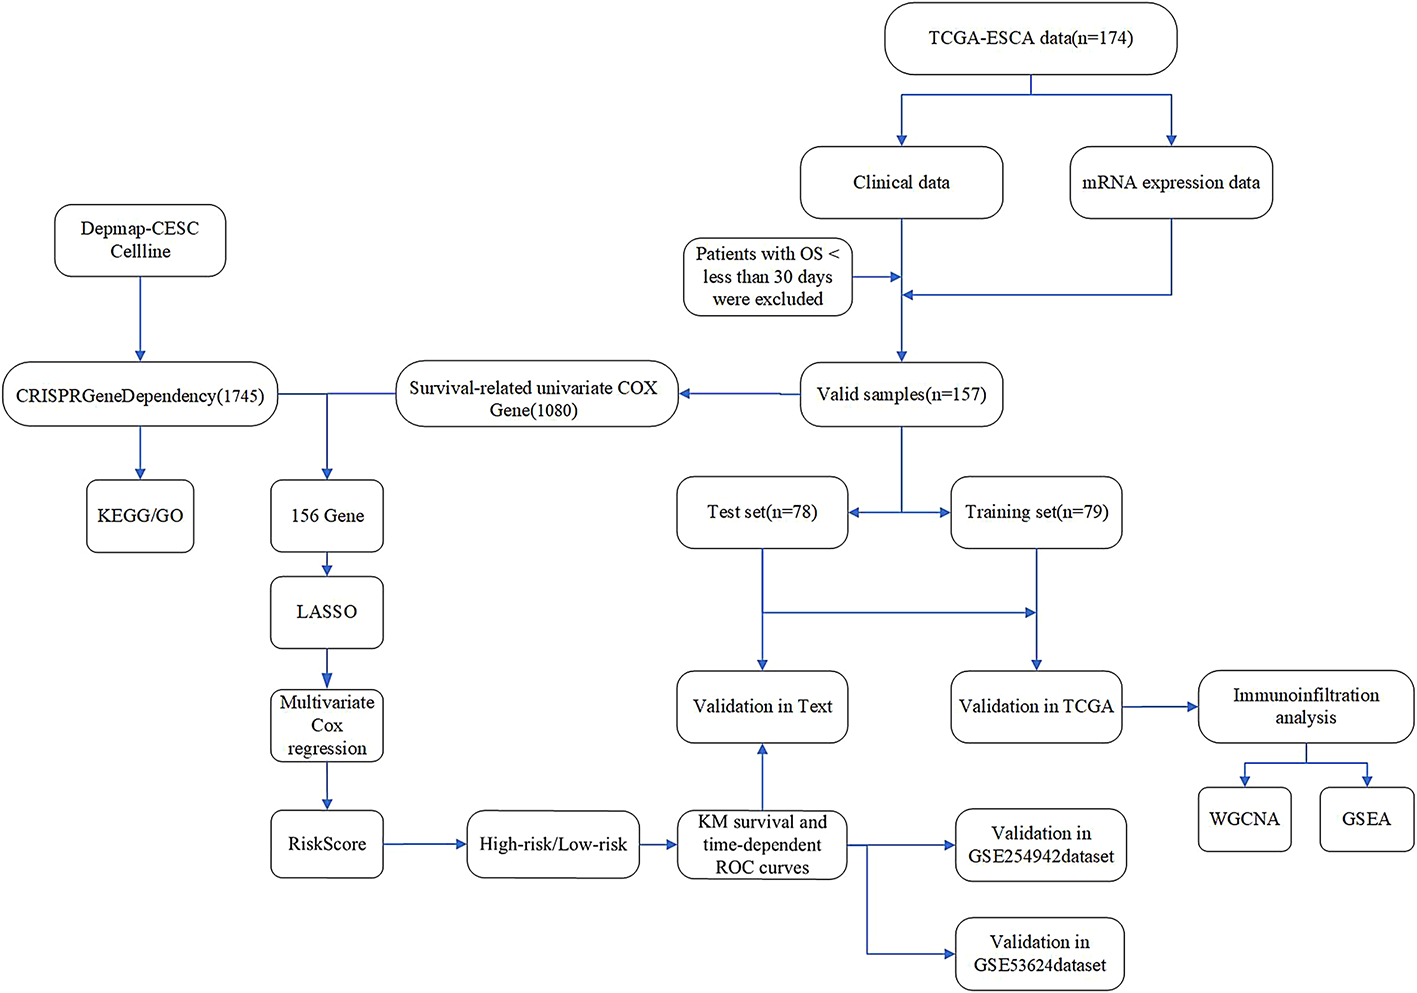
3.2 Identification of Prognosis-Associated sdgs, development of prognostic features, and validationAfter excluding samples with a survival time of less than 30 days, we randomly divided the TCGA-ESCA cohort (n = 157) into two groups: a training group of 79 patients and a testing group of 78 patients. From the 1,080 genes identified through univariate Cox analysis that were associated with survival in the TCGA-ESCA dataset, we found that 156 genes were also included among the potential SDGs. To investigate the relationship between SDGs and prognosis in esophageal cancer patients, we applied the LASSO algorithm to the training set. The regularization parameter (λ) was determined through 10-fold cross-validation: dividing the training set into 10 subsets, training the model on 9 subsets, validating on 1 subset, testing different λ values, and selecting the λ that minimized the mean squared error on the validation set, leading to the identification of 7 key genes (Figs. 3A, B). Through multivariate Cox regression analysis, we ultimately identified four genes and developed a risk scoring model based on these genes. Among the four genes, the hazard ratio (HR) for CPSF6 is 4.3 (95% CI: 1.32–13.9), with a P value of 0.016; the HR for IGBP1 is 3.4 (95% CI: 1.52–7.6), with a P value of 0.003; the HR for MTG2 is 2.9 (95% CI: 0.89–9.7), with a P value of 0.078; and the HR for TCP1 is 3.8 (95% CI: 1.39–10.5), with a P value of 0.009 (Fig. 3C). Using this risk model, patients in the training group were categorized into high-risk and low-risk groups. Figure 3D presents a circular schematic illustrating the chromosomal locations of four genes associated with esophageal cancer prognosis: CPSF6, IGBP1, MTG2, and TCP1.CPSF6, located on chromosome 12, is involved in cellular physiological regulation. IGBP1 resides on the X chromosome and may have functions influenced by specific genetic patterns. MTG2, positioned on chromosome 20, is linked to cellular growth and differentiation. TCP1, found on chromosome 6, plays a role in immune response. These genes affect esophageal cancer development and prognosis via the functional roles associated with their respective chromosomal locations. Additionally, Fig. 3E illustrates the risk score rankings of patients in the training set, while Fig. 3F depicts the survival status of each patient, revealing a significantly higher mortality rate in the high-risk group. These findings underscore the potential of the identified genes as prognostic biomarkers in esophageal cancer. Kaplan-Meier survival analysis revealed that the overall survival rate (OS) for the high-risk group was significantly lower compared to the low-risk group (Fig. 3G). Figure 3H presents a heatmap illustrating the expression patterns of four genes—CPSF6, IGBP1, MTG2, and TCP1—in high- and low-risk esophageal cancer groups. The heatmap reveals that in high-risk samples, these genes predominantly display red or reddish hues, indicating elevated expression levels. Conversely, in low-risk samples, they mainly show blue or bluish hues, reflecting lower expression levels. To verify the model’s reliability, we performed validation on multiple datasets. In the test group (n = 78, Fig. 4A), the TCGA-ESCA cohort (n = 157, Fig. 4B), GSE 254,942 (n = 106, Fig. 4C), and GSE 53,624 (n = 238, Fig. 4D), from scatter plots and risk score change curves to survival curves, all results indicated that the overall survival rate of the high-risk group was significantly lower than that of the low-risk group (all P < 0.05). Notably, the hazard ratio (HR) values for the four genes CPSF6, IGBP1, MTG2, and TCP1 in the forest plot were all greater than 1, indicating significantly elevated expression levels in the high-risk group (Figs. 3H and 4E). To improve the clarity of our findings, we provide a brief overview of the biological functions of the four identified genes. CPSF6 (cleavage and polyadenylation specificity factor 6) is involved in the 3’-end processing of pre-mRNA, which regulates the stability of gene expression. Dysregulation of CPSF6 has been linked to cancer cell proliferation and metastasis. IGBP1 (insulin-like growth factor-binding protein 1) modulates the activity of insulin-like growth factors, influencing cellular metabolism, proliferation, and survival. MTG2 (myeloid translocation gene 2) functions as a transcriptional regulator and is involved in chromatin remodeling and gene expression regulation, playing established roles in hematopoietic development and tumor suppression. TCP1 (T-complex protein 1), a member of the chaperone family, facilitates proper protein folding and helps maintain proteostasis. Abnormal expression of TCP1 has been associated with tumor cell proliferation and drug resistance. Understanding these molecular functions offers mechanistic insights into the potential contributions of these genes to esophageal cancer prognosis.
Fig. 3
Construction and validation of an ESCA-related risk signature for prognostic assessment in the training set. (A) Gene intersection analysis of survival-dependent genes between TCGA and SDGs. (B) Utilizing the LASSO-Cox regression model, we calculated coefficients of potential biomarkers, ultimately identifying a set of proliferation-essential dependence genes (SDGs) that are significantly associated with ESCA prognosis. (C) Forest plot of prognostic proliferation-related genes in the training group. (D) The location of genes on chromosomes. (E, F). The risk scores and survival status distributions of patients within the train cohort were presented and analyzed. (G) Plot showing the Kaplan–Meier distribution for the train cohort. (H) Heatmap of the expression of these genes in the train group
Fig. 4
Results are presented for the Test cohort, the TCGA External Validation cohort, and the GSE254942 and GSE53624 External Validation cohorts. (A) Distribution of risk scores and survival status in the test cohort, along with a Kaplan-Meier plot illustrating the survival distribution. (B) Distribution of risk scores and survival status in the External Validation cohort TCGA, along with a Kaplan-Meier plot illustrating the survival distribution (C) Distribution of risk scores and survival status in the External Validation cohort GSE254942, along with a Kaplan-Meier plot illustrating the survival distribution. (D) Distribution of risk scores and survival status in the External Validation cohort GSE53624, along with a Kaplan-Meier plot illustrating the survival distribution (E) Heatmap Illustrating Gene Expression Levels in the Test Cohort, TCGA - ESCA Cohort, and Survival - Prediction - Oriented GSE254942 and GSE53624 Cohorts
3.3 Independent variable analysis for disease prognosisWe presented the distribution of high-risk and low-risk patients across various subgroups of TCGA-ESCA (Fig. 5A). Figure 5B shows that the risk score features are significantly correlated with patient status (P = 0.00021), N stage (P = 0.027), and M stage (P = 0.0034). Kaplan-Meier analysis indicates that in subgroups such as age ≤ 60 (P = 0.0042), > 60 (P = 0.037), male (P < 0.0001), T3 + T4 (P = 0.00035), stage III + IV (P = 0.0092), and G2 + G3 (P = 0.0032), high-risk patients (red curve) have significantly worse survival. In subgroups such as female (P = 0.37), T1 + T2 (P = 0.14), N- (P = 0.52), N+ (P = 0.056), M0 (P = 0.1), M1 (P = 0.13), stage I + II (P = 0.29), and G1 (P = 0.99), no significant survival difference was observed between risk groups, or differences were marginally close to significance (Supplementary Fig S1). This may be due to limited sample size; future studies should consider larger cohorts for validation. Following this, we conducted univariate and multivariate Cox analyses within the TCGA cohort to evaluate whether the risk scoring model serves as an independent prognostic factor for overall survival. Figure 5C and D present the results of univariate and multivariate Cox analyses, respectively. In Fig. 5C, the univariate Cox analysis indicates that the risk factor (risk score) has a P-value of less than 0.001 and a hazard ratio (HR) of 2.779 (95% confidence interval: 1.521–5.076), demonstrating a significant association with mortality risk. The tumor stage factor also shows a significant association, with a P-value of less than 0.001 and an HR of 2.751 (95% CI: 1.878–4.029).In contrast, factors such as age and others do not exhibit a statistically significant association with overall survival. Figure 5D presents the results of the multivariate Cox analysis, indicating that the risk factor has a P-value of 0.022 and a hazard ratio (HR) of 2.064 (95% CI: 1.110–3.838), confirming it as a significant independent prognostic factor for overall survival. The tumor stage factor has a P-value of less than 0.001 and an HR of 2.201 (95% CI: 1.445–3.352), further demonstrating a significant independent effect. In contrast, the lymph node metastasis status (N factor) has a P-value of 0.268, indicating no significant independent effect. Collectively, these results confirm that the risk score model can act as an independent prognostic factor for overall survival in patients with esophageal cancer, aiding in the stratification of patient survival.
Fig. 5
Clinical data from TCGA-ESCA along with independent prognostic factors (A) In the TCGA-ESCA dataset, this figure illustrates the expression levels of four genes (IGBP1, TCP1, CPSF6, and MTG2) in conjunction with various clinical characteristics of the samples, including risk class, grade, stage, sex, T stage, N stage, M stage, and age. Different colors denote distinct classifications, with the color intensity in the heatmap reflecting the gene expression levels (B) Some patients grouped according to clinical information are compared with riskscore (C) Univariate Cox analysis of survival for Risk, Stage, Age and Primary (D) Multivariate Cox analysis of survival for risk and stage
3.4 Nomogram Building and assessmentTo quantitatively predict the survival probability of esophageal cancer patients using four genes as prognostic features, we constructed a prognostic nomogram based on Cox proportional hazards regression analysis to estimate 1-year, 2-year, and 3-year overall survival (OS) (Fig. 6A). The nomogram is calculated based on the Cox proportional hazards regression model, with the weighted score for each predictor variable determined by the regression coefficients. These scores are summed to yield a comprehensive risk score, where higher scores indicate an increased risk of mortality. Finally, using the predetermined scales of the nomogram, the scores are converted into predicted survival probabilities for 1 year, 2 years, and 3 years, enabling the transformation of multivariable data into personalized survival risk assessments. The calibration curve (Fig. 6B) visually demonstrates the high consistency between the nomogram’s predicted survival probabilities for esophageal cancer patients at 1 year, 2 years, and 3 years and the actual observed outcomes. Quantitative analysis further confirms its excellent performance: the mean absolute error (MAE) for the 1-year prediction is 0.020 with an R² value of 0.978; the MAE for the 2-year prediction is 0.027 with an R² value of 0.982; and the MAE for the 3-year prediction is as low as 0.007 with an R² value reaching 0.999. The MAE reflects the average deviation between predicted and actual values, while the R² quantifies the goodness of fit of the model to the data, both indicating the predictive accuracy of the nomogram at different time points. Additionally, the concordance index results (Fig. 6C) further validate the high efficacy of this nomogram in predicting survival in esophageal cancer. Figure 6D illustrates the survival analysis based on risk stratification derived from the nomogram. Based on the risk scores from the nomogram, patients were categorized into high-risk and low-risk groups. The survival curves of the two groups are clearly separated, with the high-risk group showing a more rapid decline in survival probability over time. The log-rank test reveals a p-value of less than 0.0001, indicating a highly significant difference between the groups. Overall, these findings support the utility of the nomogram as a practical tool for clinical decision-making in esophageal cancer management.
Fig. 6
Nomogram model construction and validation (A) Nomogram was used to assess the probability of survival of esophageal carcinoma patients based on risk score, stage (B) Calibration curves of the nomogram predicting the overall survival (OS) at 1-, 2-, and 3-year intervals in the TCGA ESCA dataset (C) The C-Index value of the riskScore and Stage was utilized to analyze the concordance index of the nomogram, evaluating the predictive model’s agreement between its predictions and actual outcomes (D) The results of survival analysis based on risk stratification from the nomogram
3.5 WGCNA and GSEATo explore the mechanisms of high-risk and low-risk prognoses in esophageal cancer, we utilized weighted gene co-expression network analysis (WGCNA) to identify co-expressed genes. We divided patients into high-risk and low-risk groups based on the risk scores of TCGA-ESCA patients and performed clustering of the included samples using the average linkage hierarchical clustering method. In constructing the scale-free network, a soft threshold parameter of b = 8 was selected. As shown in Fig. 7A, this value yields a high R² of 0.9 in the “Scale independence” plot, indicating strong scale-free characteristics. Additionally, in the “Mean connectivity” plot, the average connectivity is maintained within an appropriate range, balancing gene connections and network density to ensure the quality of subsequent analyses. Through average linkage hierarchical clustering, a total of 12 modules were determined (Fig. 7B). It was observed that different modules were associated with the high-risk population (Fig. 7C), particularly the black and yellow modules which were positively correlated with high risk (Fig. 7D), while the magenta, pink, red, and green modules were negatively correlated with high risk (Fig. 7E). The genes from these modules were combined for Gene Ontology (GO) analysis. The results of the GO analysis revealed (Fig. 7F) that these genes were involved in the regulation of immune effector processes, immune receptor activity, and cytokine functions, as well as biogenesis of ribonucleoprotein complexes, ribosome biogenesis, cytoplasmic translation, and rRNA processing. We performed HALLMARK enrichment analysis on the genes from the magenta, pink, red, and green modules, identifying key pathways related to immune responses in the HALLMARK analysis (Fig. 7G), including allograft rejection, interferon-gamma response, interferon-alpha response, and inflammatory response. In addition, gene set enrichment analysis (GSEA) was performed on gene sets in the high-risk and low-risk groups from the Cancer Genome Atlas (TCGA)-esophageal squamous cell carcinoma (ESCA) dataset, and multiple gene sets related to immune responses were identified. Figure 8A shows the distribution of gene set enrichment scores for various gene sets. Among these gene sets, we found that immune-related pathways such as interferon - gamma response, il6 jak stat3 signaling pathway, inflammatory response, coagulation, complement, and allograft rejection are suppressed. In Fig. 8B and C, it is observed that these gene sets exhibit inhibitory effects in the high-risk group compared to the low-risk group.
Fig. 7
Construction of Weighted Gene Co-Expression Network Analysis (WGCNA) network. (A) The scale-free fit index for various soft-thresholding powers. The mean connectivity for various soft-thresholding powers. (B) Shows the original and combined modules under the clustering tree (C) Heatmap depicting the traits relationship between low- and high-risk groups. (D) MM vs. GS scatter plot of high. E. MM vs. GS scatter plot of low (F) KEGG hallmark enrichment analysis. (G) GO enrichment analysis based on biological processes (BP), cellular compartments (CC), and molecular functions (MF)
Fig. 8
Gene Set Enrichment Analysis (GSEA) of high - and low-risk groups in the TCGA-ESCA dataset. Panel A shows the enrichment results with adjusted p-values indicated; Panels B and C display the running enrichment scores across ranked gene lists for different gene sets
3.6 Determine the link between risk score and immune infiltration patternsWe further compared immune scores, stromal scores, and ESTIMATE scores to evaluate the differences in immune status between the high-risk and low-risk groups. As depicted in Fig. 9A, there is a significant difference in ESTIMATE scores between the high-risk and low-risk groups, with a p-value of 0.00025; for immune scores, the p-value for the difference between the two groups is 0.01070; and in the stromal score comparison, the p-value for the difference between the two groups is 8.1e-05. These results suggest that the immune scores, stromal scores, and ESTIMATE scores are significantly lower in the high-risk population. This finding suggests that a lower immune status may be associated with a poorer prognosis in esophageal cancer patients, highlighting the potential role of the immune microenvironment in disease progression.
To gain a deeper understanding of the relationship between risk scores and tumor-infiltrating immune cells, we conducted single-sample gene-set enrichment analysis (ssGSEA).As illustrated in Fig. 9B, our analysis showed that the infiltration levels of 19 types of immune cells were significantly lower in the high-risk group. The affected immune cells include Eosinophil, Immature B cell, Mast cell, T follicular helper cell, Activated B cell, Plasmacytoid dendritic cell, Immature dendritic cell, Central memory CD4 T cell, MDSC, Effector memory CD 8 T cell, Macrophage, Activated dendritic cell, Effector memory CD4 T cell, Natural killer cell, Regulatory T cell, Type 1 T helper cell, Central memory CD8 T cell, Natural killer T cell, Type 2 T helper cell. This finding underscores the significant differences in immune cell infiltration within the tumor microenvironment between the high-risk and low-risk groups. The results indicate that the decreased presence of immune cells in the tumor microenvironment may contribute to the greater invasiveness observed in high-risk tumors, potentially leading to adverse effects on patient prognosis. Correlation analysis revealed that the risk score was negatively correlated with 25 of the 28 immune cell types, while exhibiting a positive correlation with three immune cell types: Activated CD8 T cells, Activated CD4 T cells, and CD56dim natural killer cells (Fig. 9C). Notably, these findings suggest a potential association between tumor immune infiltration and the poor prognosis observed in the high-risk population. This indicates that the composition of the immune cell landscape may play a crucial role in determining patient outcomes in esophageal cancer.
Fig. 9
Correlation between risk score and immune infiltration in ESCA (A) Differences in ESTIMATE score, immune score, and stromal score between the high-risk and low-risk groups. (B) Analyzing immune cell type variations among high-risk vs. low-risk cohorts for 28 distinct types. (C) Investigating the link between risk scores and 28 immune cell types
Comments (0)