
Remember me


ECFCs can be identified by a combination of cell surface markers [5]. Previously we have demonstrated that ECFCs exhibit high expression of endothelial markers CD31 and CD105, low/negligible expression of hematopoietic markers CD14 and CD45, and varied expression of stem/progenitor marker CD34 [2]. Since EPCR has been identified as a marker of vascular endothelial stem cells in mice [9], we assessed its expression in human cord blood-derived ECFCs. Here we show cell surface expression of EPCR, CD157, and CD34 on ECFCs (Fig. 1a). The % of expression and the median fluorescence intensity are both significantly higher for EPCR when compared to CD157 and CD34 (Fig. 1b, c). EPCR expression was also the most homogeneous among ECFCs from nine different donors as demonstrated by all assessments showing > 95% positivity. The expression of CD157 and CD34 was heterogeneous. CD157 exhibited expression levels from 48 to 82%, and CD34 from 11 to 72% (Fig. 1b). In addition, immunofluorescence of EPCR confirmed its widespread expression on the cell surface (Fig. 1d). To corroborate our findings, we assessed ECFC transcriptomes generated by other groups [14]. Publicly available data from GEO with IDs GSE263058 and GSE131995 were analyzed [15, 16]. We found that human cord blood-derived ECFCs showed significant higher PROCR mRNA expression than human induced pluripotent stem cells (Supplementary Fig. 1a). Similarly, peripheral blood-derived ECFCs exhibited a significantly higher expression of PROCR mRNA than subcutaneous adipose tissue-derived stromal vascular fraction (Supplementary Fig. 1b). Furthermore, to establish the biological relevance of EPCR in the in vivo setting, we harnessed data from the single-cell transcriptomic atlas from a mouse model of lung microvascular regeneration [17], which is publicly available in GEO with ID GSE211335. This model of severe acute lung injury is induced by intratracheal instillation of diphtheria toxin in mice genetically modified to express the human diphtheria receptor in endothelial cells. This leads to the selective ablation of more than 70% of lung endothelial cells, which triggers vasoreparative mechanisms that achieve replenishment of endothelial cells by 7 days post-injury. Focusing on the expression of Procr, the gene that codes for EPCR, in the different cell types within this acute lung injury model, we confirmed that Procr was expressed at higher levels in mouse lung endothelial cells in comparison to other lung cell types (Fig. 1e), and there was a clear upregulation in Procr expression in response to injury. The increase in Procr expression was specific to endothelial cells and was quantified to be over two-fold increase by day 3 in 9.68% of cells (Fig. 1f). A gene correlation analysis of Procr with other reported marker genes for endothelial progenitor/stem cells, identified Procr clustering together with Cd34 and Sox9 having a positive strong correlation (Fig. 1g). Interestingly, there was a negative correlation between Procr and endothelial differentiation markers including Cdh5 (Ve-cadherin), Cd31 (Pecam), and Eng (Endoglin). Moreover, a second in vivo mouse lung injury model was examined. This model employed LPS to induce lung endothelial injury through inflammation and trigger vasoreparative processes [18]. Results indicated that Procr increased significantly after LPS exposure (Supplementary Fig. 2a). This Procr mRNA expression increase was already evident 6 h post LPS, reached highest levels at 24 h post LPS, and was not detectable at 72 and 168 h post LPS (Supplementary Fig. 2b). This suggested that EPCR expression in endothelial cells was associated with acute endothelial injury and early reparative mechanisms. Taken altogether, both the murine lung and human ECFC results confirm that EPCR (PROCR) is a robust marker for vasoreparative cells.
Fig. 1
ECFCs show widespread expression of EPCR on cell surface. a Cell surface expression by flow cytometry of EPCR (pink histogram), CD157 (orange histogram), and CD34 (blue histogram) relative to unstained sample (grey histogram). Violin plots show distribution of (b) % Expression and (c) MFI (median fluorescence intensity) for EPCR, CD157, and CD34, n = 9. d Immunofluorescence of EPCR (AF488) in green shows widespread distribution on cell surface. Nucleus stained with DAPI in blue. Scale bar 50 µm. One-way ANOVA was performed, ns = not significant, **p < 0.01; ***p < 0.001, ****p < 0.0001. e Procr average expression by cell type from a model of severe acute lung injury GSE211335. f Procr percentage expression across lung cell types and timepoints after injury g Spearman correlation of Procr transcript with reported markers of endothelial stemness and differentiation
In vitro cell functionality in ECFCs is dependent on EPCR presenceTo determine the role of EPCR expression on ECFCs functionality, PROCR, the gene coding for EPCR, was knocked down by siRNA. Protein evaluation by Western blot indicated a 95% decrease in EPCR expression (Fig. 2a, Supplementary Fig. 3). This knockdown led to a significant decrease in proliferative, tubulogenic, and migratory capacities, as shown by clonogenics (Fig. 2b), tubulogenesis (Fig. 2c), and scratch migration assays (Fig. 2d). In addition, endothelial barrier formation (Fig. 2e) is impeded when PROCR is silenced in ECFCs, measured by a significant reduction in cell index recorded during barrier formation (2.28 h) and after plateau (12 h). The full trace of barrier formation and stability over 18 h is available in Supplementary Fig. 4. Disruption of the endothelial barrier with thrombin treatment highlighted a greater response in PROCR siRNA cells compared to control siRNA, with a significant reduction in normalized cell index and a delay in barrier recovery after thrombin (Fig. 2f). In addition, we also evaluated the role of EPCR in more complex in vitro models including the 3D vasculature-on-chip and the MSC aggregates model. In agreement with previous results, EPCRhigh ECFCs showed a significant larger area for sprouting and vascular network formation than EPCRlow ECFCs (Supplementary Fig. 5). Human MSC aggregates were cocultured with EPCR knocked down ECFCs or controls. We observed less intra-aggregate RFP vascular structures in EPCR knocked down ECFCs than in control ECFCs (Supplementary Fig. 6). Taken together, our evidence demonstrated that ECFCs in vitro functionality is dependent on the presence of EPCR.
Fig. 2
Expression of EPCR in ECFCs is essential for endothelial functionality. a PROCR silencing by PROCR siRNA confirmed in Western blot. Quantification of protein levels showed significant reduction in EPCR expression (49 kDa) relative to β-actin (42 kDa) in PROCR siRNA group compared to control untransfected and control siRNA groups, n = 4. Endothelial cell functional assays performed comparing control untransfected, control siRNA, and PROCR siRNA groups to include: b clonogenics assay and quantification of % colony area, n = 5, c tubulogenesis assay and quantification of % tube area, n = 6, d scratch migration assay from 0 to 6 h and quantification of distance migrated, n = 4, e barrier formation and quantification of cell index at 2.28 h and 12 h, n = 3 and f normalized cell index after thrombin treatment and quantification, n = 3. In all assays, control siRNA and PROCR siRNA groups are normalized to control untransfected, which is represented by the black dashed line, and analyzed by paired t-test. *p < 0.05, **p < 0.01; ***p < 0.001
ECFCs with knocked-down PROCR exhibited a negative enrichment for cell cycle gene signatureHaving observed significant functional decline in ECFCs with PROCR silencing, bulk RNA sequencing was performed with six biological replicates of ECFCs transfected with PROCR siRNA vs control siRNA. We found 1,101 differentially expressed genes, 727 upregulated and 374 down regulated, as shown in the MA plot (Fig. 3a). KEGG pathway analysis revealed that the most down regulated gene signatures were DNA_REPLICATION and CELL_CYCLE, and the most up regulated gene signatures were FOCAL_ADHESION and TGF_BETA_SIGNALING_PATHWAY (Supplementary Fig. 7). Gene Set Enrichment Analysis (GSEA) for the REACTOME cell cycle gene signature confirmed a significant negative enrichment (Fig. 3b, d). We also found, as expected, that the TGF beta pathway gene signature was significantly enriched (Fig. 3c, e). Another link of Procr expression with cell proliferation was observed in the single cell RNA-seq atlas from mouse lung injury. Results from this mouse dataset indicated that Procr expression was the highest in proliferative lung capillaries, as annotated by the authors, in 50% of cells, at day 3 after injury (Supplementary Fig. 8a). Further gene correlation analysis identified Procr expression to be positively correlated with Apelin (Apln), Ki67 (Mki67), Nrarp, Hmgb1, and Col18a1 (Supplementary Fig. 8b).
Fig. 3
ECFCs with knocked-down EPCR by PROCR siRNA exhibited a negative enrichment for cell cycle gene signature. Bulk RNA-seq of 6 biological replicates highlighted 1,101 differentially expressed genes presented in (a) MA plot of PROCR siRNA vs control siRNA, n = 6. KEGG pathway analysis revealed that among the most down regulated gene signatures was CELL_CYCLE (b), and among the most up regulated was TGF_BETA_SIGNALING_PATHWAY (c). Heatmap showing cell cycle associated genes significantly downregulated (d) and upregulated (e) in PROCR siRNA compared to control siRNA
Knocking down PROCR in ECFCs induced cell cycle arrest in G1Next, we performed an in-depth functional study of the cell cycle in PROCR knocked down ECFCs. First, established markers of proliferation Ki67 and PCNA were used to confirm that EPCR expression on ECFCs drives proliferation. In the PROCR siRNA group, Ki67 (Fig. 4a) and PCNA (Fig. 4b, Supplementary Fig. 9) were significantly reduced compared to the control siRNA group. Secondly, cell surface immunophenotyping by flow cytometry, showed that the cell cycle arrest was not associated with increased cell death. ECFCs did not undergo apoptosis and remained viable, as shown by the lack of uptake of 7AAD, when EPCR was knocked down by ~ 84% (Fig. 4c, d). We found reduced incorporation of EdU, to around half when PROCR is silenced (Fig. 4e) and a reduction of G2/M peak using DyeCycle stain (Fig. 4f), which indicated an arrest in the G1 phase of the cell cycle. When quantified, there is a significant increase in cells within G1, and a concomitant reduction in cells within G2/M phases (Fig. 4g). Furthermore, we used the flow cytometry-based CytPix technology and automated image analysis (AIA) to define cell cycle status, which further confirmed the loss of cells in G2/M (Supplementary Fig. 11a-e). Beyond this, it showed an increase in the pseudo diameter of PROCR knocked down cells (Fig. 4h; Supplementary Fig. 11f). This correlates to morphological changes observed, where PROCR knocked down ECFCs appear bigger, more elongated, and lose their cobblestone morphology, compared to untransfected and control siRNA groups (Supplementary Fig. 12). This blockage of cell cycle progression is further confirmed by RT-qPCR gene expression data (Fig. 4h, Supplementary Fig. 10) which shows a significant reduction in expression of G1 checkpoint (CDK, E2F2) and G2/M checkpoint (CCNA2, CCNB2) genes, and a significant increase in expression of G1 blocker genes (p53, p21) when PROCR is knocked down. No significant change in apoptosis-related BAX gene agrees with previous 7AAD cell viability data.
Fig. 4
Knocking down PROCR in ECFCs halted the cell cycle in G1 phase. a Immunofluorescence staining of Ki67 (AF488 in green) in PROCR siRNA group vs control untransfected and control siRNA, nucleus stained with DAPI (blue), scale bar 50 µm. Violin plots show % ki67 positive nuclei quantified, n = 3 biological replicates, each technical replicate has been plotted. b PROCR silencing leads to decrease in PCNA (30 kDa) expression in western blot, relative to β-actin (42 kDa); quantification shows significant decrease in PCNA expression in PROCR siRNA group compared to control untransfected and control siRNA groups, n = 4. Control untransfected, control siRNA, and PROCR siRNA groups were assessed by flow cytometry and % expression quantified (in all plots grey histogram represents unstained control). c EPCR expression (pink histogram) and quantification, n = 6, d 7AAD expression (blue histogram) and quantification, n = 3. e EdU cell proliferation assay (purple histogram) and quantification, n = 5. f Cell cycle analysis using Vybrant dye cycle by flow cytometry (green histogram) shows distribution of G0/G1 (1st peak) and G2/M (2nd peak) phases of cell cycle. g Quantification of % cells within G0/G1 and G2/M phases n = 4, analyzed by 2-way ANOVA. h Histogram of PseudoDiameterMicrons generated from automated image analysis (AIA) using Attune CytPix. i RT-qPCR displayed as heatmap shows changes in gene expression in PROCR, G1 checkpoint genes (CDK, E2F2), G1 blocker genes (p53, p21), G2/M checkpoint genes (CCNA2, CCNB2), and apoptosis related BAX gene, comparing control untransfected, control siRNA, and PROCR siRNA groups, n = 6. ns = not significant, *p < 0.05, **p < 0.01; ***p < 0.001, ****p < 0.0001. In all graphs, the dotted line represents the average of control untransfected group
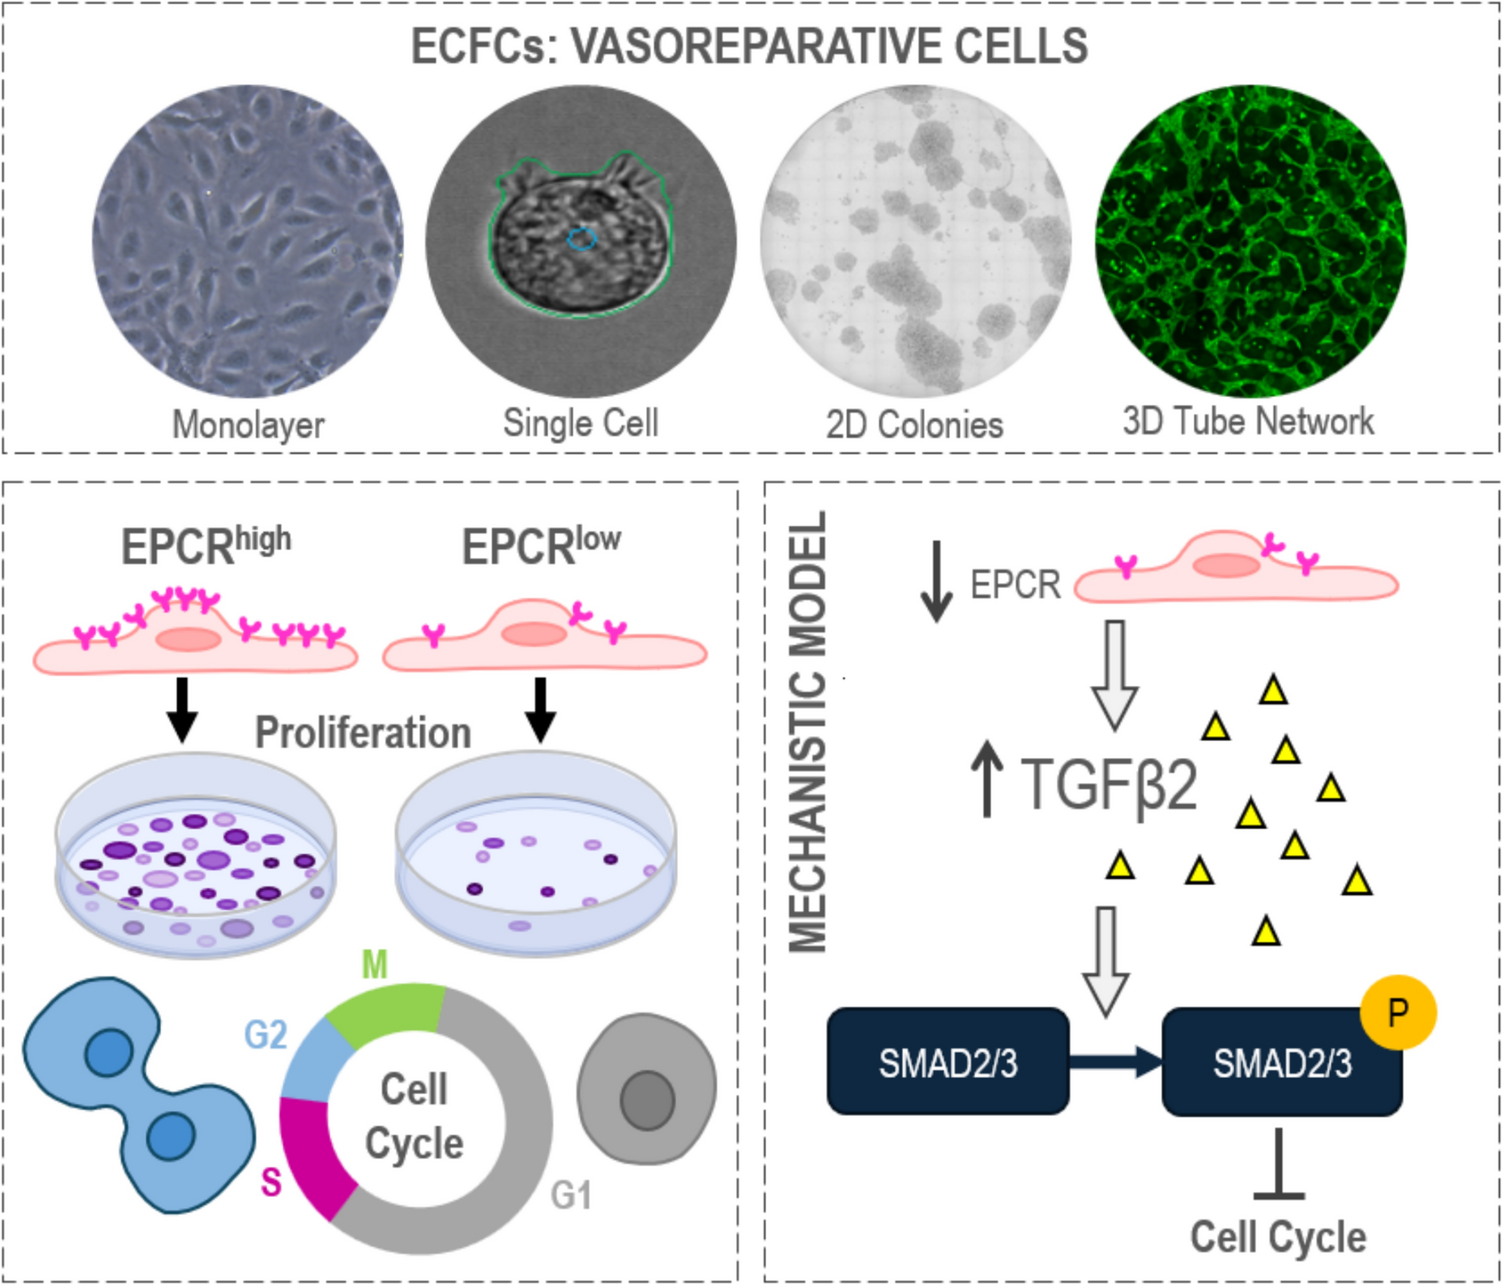
Diminished EPCR expression led to increased pSMAD2/3 and pERKTo characterize the signaling pathways associated with the cell cycle arrest induced by the PROCR knockdown, we evaluated SMADs phosphorylation. Results highlight a significant increase in pSMAD2/3 (Fig. 5a, b) and no changes in pSMAD1/5 (Supplementary Fig. 13). In addition, we found a significant increase in pERK (Fig. 5a, c) and Transgelin (Fig. 5a, d), while there was a significant decrease in pFAK (Fig. 5a, e). Interestingly, the expression of Alk5, which is the receptor upstream of pSMAD2/3, showed a second band of lower molecular weight, evident only in PROCR knockdown ECFCs (Supplementary Fig. 13). Considering that Alk5 is activated by multiple ligands, we queried our transcriptome results for Alk5 ligand changes with PROCR knockdown. We evaluated eight Alk5 ligands: TGFB1, TGFB2, TGFB3, INHBA, INHBB, GDF9, GDF11, and MSTN1 (Supplementary Fig. 14) and found a significant increase in the mRNA expression for TGFB2, INHBA, and GDF11 when PROCR was knocked down. Thus, we measured TGFβ2 protein in the cell supernatant. ECFCs knocked down for PROCR showed a significant increase in TGFβ2 secretion in collected conditioned media, compared to control siRNA, with an average fold increase of 3.6 (Fig. 5f). We also tested the dependence of the TGFβ2 increase on SMAD2/3 signaling by employing the Alk5 inhibitor SB525334. We observed a significant decrease in TGFβ2 release in PROCR knocked down cells when treated with Alk5 inhibitor (Fig. 5g). Taken together, these data enabled us to propose a mechanistic model whereby the reduced expression of EPCR induced TGFβ2 release, which acts in an autocrine manner by binding to Alk5 and promoting phosphorylation of SMAD2/3, leading to increased pERK and Transgelin, with decreased pFAK.
Fig. 5
Diminished EPCR expression led to increased pSMAD2/3 and pERK via TGFβ2 signaling pathway as shown by Western blot (a) and densitometry quantification for pSMAD2/3 (b), pERK (c), Transgelin (d), and pFAK (e). f TGFβ2 secretion from control siRNA and PROCR siRNA assessed by ELISA. g Evaluation of TGFβ2 release when PROCR siRNA ECFCs were treated with Alk5 inhibitor SB525334. All data analyzed using a ratio paired t test, n = 4, *p < 0.05, **p < 0.01
EPCR levels are decreased in quiescent ECFCsTo validate our results in a different model without gene knockdown, we use the quiescence cell model. ECFCs were cultured at high density until fully confluent, kept for 3 days and then serum starved, before sampling. Single cell RNA sequencing of ECFCs, made quiescent by contact inhibition, revealed a significant reduction in PROCR mRNA expression in quiescent cells when compared to proliferating cells (Fig. 6a). In addition, we explored PROCR expression changes throughout the in vitro expansion of ECFCs. We found that PROCR mRNA expression remained stable from P9 to P26 (Supplementary Fig. 15). Nevertheless, we observed that the frequency of ECFCs with the lowest expression of PROCR (bottom quartile) increased from 7% at P9, to 13% at P19, and 30% at P26. To corroborate the quiescence model findings at the protein level, we performed flow cytometry for EPCR expression. DyeCycle histograms confirmed the quiescent and proliferating phenotypes in ECFCs by cell cycle phase (Fig. 6b). Cell cycle analysis demonstrated that quiescent ECFCs show loss of G2/M peak, which was associated with a significant loss of EPCR expression, as demonstrated by the significant reduction in median fluorescence intensity (MFI) and % expression (Fig. 6b). To further confirm the relationship between EPCR expression and proliferation, we used a third model by FACS (fluorescently activated cell sorting), based on EPCR expression levels (Fig. 6c) into EPCRlow, EPCRmid, and EPCRhigh expressing ECFCs. Sorted populations were cultured and colony formation evaluated (Fig. 6d). EPCRlow expressing ECFCs produce significantly less colonies than EPCRmid and EPCRhigh expressing ECFCs (Fig. 6e). Furthermore, EPCRhigh expressing ECFCs yield significantly more HPP (high proliferative potential) colonies and significantly less LPP (low proliferative potential) colonies than both EPCRlow and EPCRmid ECFCs. In addition, co-staining of EPCR sorted cells with cell cycle analysis further demonstrates the association of EPCR expression with cell cycle status by a stepwise reduction in G1/G2M ratio from EPCRlow through to EPCRhigh ECFCs (Fig. 6f, Supplementary Fig. 16). ECFCs with higher expression of EPCR exhibited the higher frequency of cells in G2M phase. These results using non-genetically modified ECFCs confirmed that EPCR expression is tightly modulated during the quiescence-proliferation dynamics in ECFCs.
Fig. 6
PROCR mRNA expression levels are associated with proliferative status in ECFCs a Expression of PROCR in scRNAseq of quiescent vs proliferating ECFCs. PROCR expression sub-divided by cell cycle phases using gene signatures, G1 (blue), G2M (yellow), S (red). b Cell cycle distribution by flow cytometry confirms quiescent ECFC monolayers (red histogram) are arrested in G1 phase and have loss of G2M peak compared to proliferating ECFCs (blue histogram). EPCR expression is presented as median fluorescence intensity (MFI). Grey histograms represent unstained control. Quantification of EPCR MFI and % expression analyzed by paired t-test, n = 4, *p < 0.05, **p < 0.01. c Contour plot shows gating strategy for EPCRlow, EPCRmid, and EPCRhigh populations which were sorted (by FACS) and plated for d clonogenic assay. e Violin plots show quantification of total number of colonies, as well as % high proliferative potential (HPP) and % low proliferative potential (LPP). Data analyzed by one-way ANOVA, ns = not significant, **p < 0.01, *** p < 0.001, ****p < 0.0001, n = 3 biological replicates, each technical replicate has been plotted. f Sorted populations of EPCRlow, EPCRmid, and EPCR.high were analyzed by flow cytometry for cell cycle distribution using Violet dye cycle and the ratio of G1/G2M populations quantified using one-way ANOVA, n = 4, *p < 0.05, **p < 0.01
Comments (0)