
Remember me


We first analyzed GPR182 expression levels in patients with HCC using publicly available data from TCGA. Our analysis revealed that GPR182 expression was significantly lower in liver hepatocellular carcinoma (LIHC) compared to normal tissues (Fig. 1A). Additionally, high GPR182 expression correlated with improved overall survival (OS) and disease-free survival (DFS) (Figs. 1B and C). To further validate these findings, we performed immunohistochemistry (IHC) on HCC samples, which demonstrated that GPR182 was barely detectable in the tumoral region compared to the peri-tumoral area (Fig. 1D). Next, we examined the spatio-temporal expression pattern of gpr182 during HCC progression within zebrafish model using whole-mount in situ hybridization (WISH). The zebrafish HCC model was established using the transgenic line Tg(fabp10a: tetON; tre: eGFP-krasv12), where the kras oncogene is specifically activated in hepatocytes upon doxycycline (DOX) induction [14]. Tumor induction began at 3 days post-fertilization (dpf), and gpr182 expression was assessed at 0-, 1-, 2-, and 4-days post-induction (dpi) (Fig. 1E). Our results indicate a marked reduction in gpr182 expression in the liver of the zebrafish HCC model, with levels progressively decreasing as tumor progression advanced (Fig. 1E).
Fig. 1
Downregulation of GPR182 in HCC correlates with poor prognosis. (A) Comparative expression analysis of GPR182 in normal liver versus HCC tissues within the TCGA-LIHC dataset. (B and C) Kaplan-Meier survival curves for overall survival (OS) and disease-free survival (DFS) of HCC patients with high and low expression levels of GPR182 in TCGA-LIHC dataset. (D) Representative IHC staining for GPR182 in peritumoral and tumoral regions of HCC tissues. (E) Whole-mount in situ hybridization analysis of gpr182 expression in zebrafish HCC models at various stages of tumor progression and in controls during development
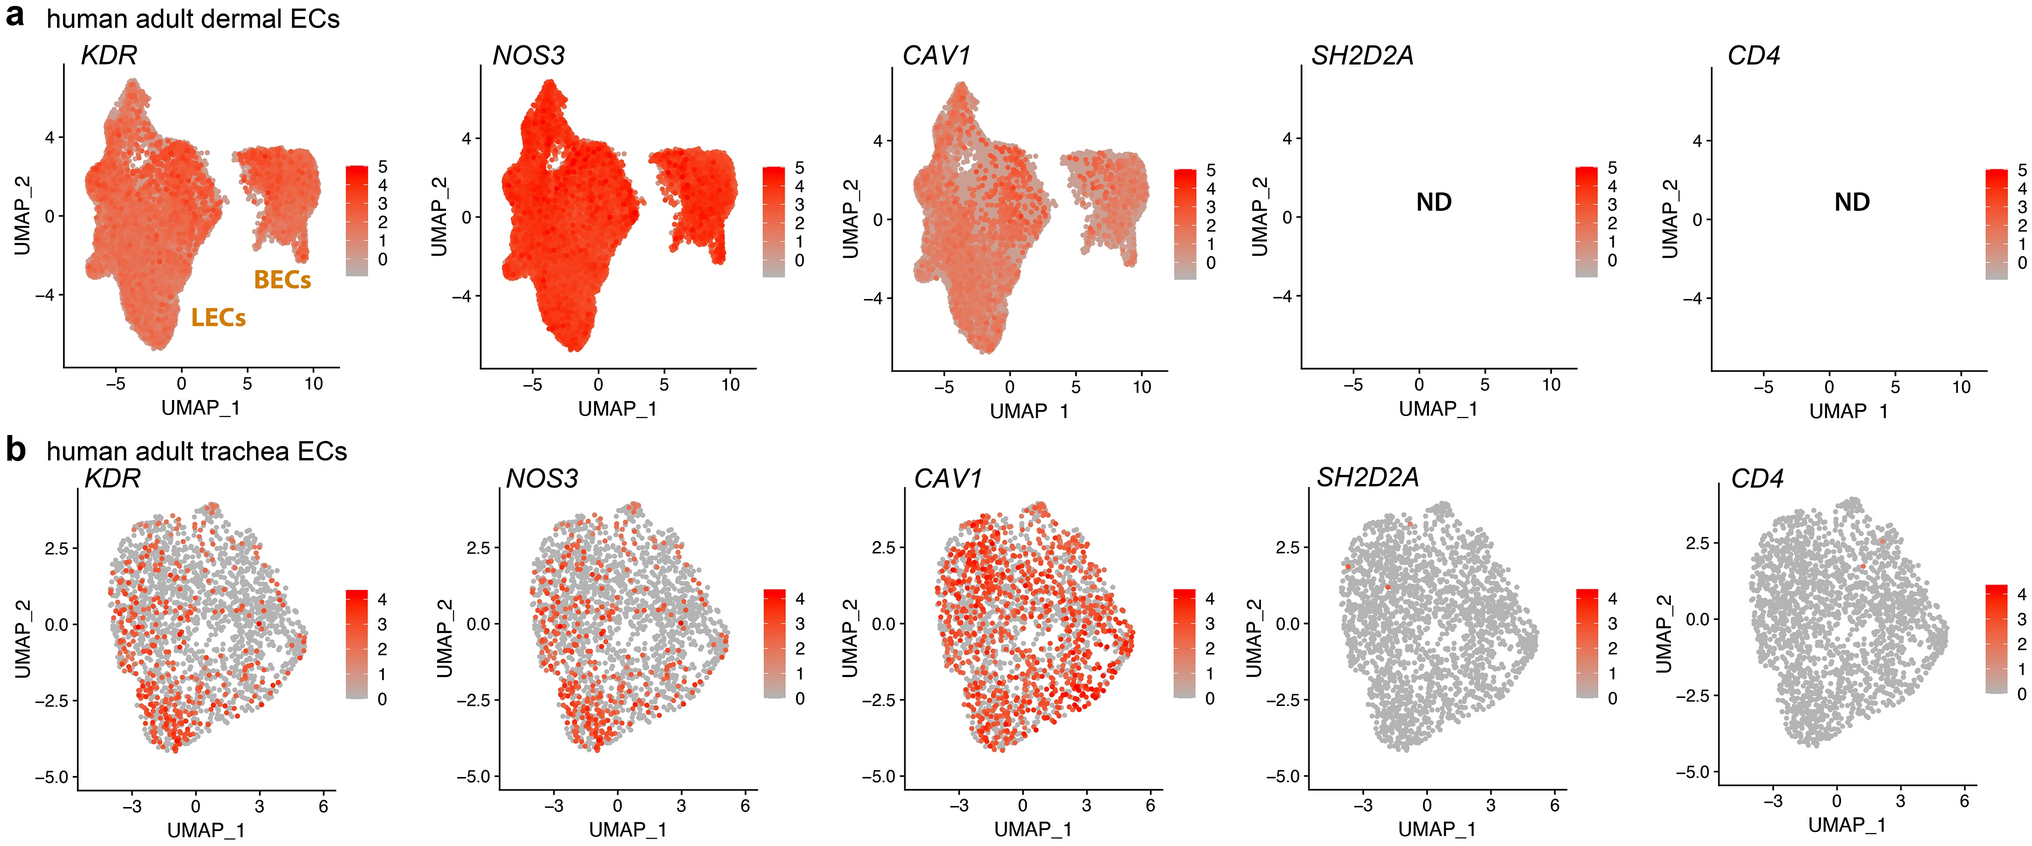
GPR182 is highly enriched in ECs but negatively correlated with EC marker CD31To characterize the expression pattern of GPR182 in different species, we reanalyzed single-cell RNA sequencing (scRNA-seq) datasets from human (GSE134355), mouse (GSE198832), and zebrafish samples (GSE198832) [15, 16]. Unsupervised dimensionality reduction and graph-based clustering analysis were performed with the datasets, and distinct cell clusters were visualized by the UMAP method (Fig. 2A, D, and G). GPR182 gene was found to be highly enriched and expressed in EC clusters in all species (Fig. 2A-I). We further explored the relationship between GPR182 and the continuous EC marker CD31 in HCC tissues through immunofluorescence and immunohistochemistry (Fig. 2J and K). The results showed that CD31 expression was elevated in tumoral regions where GPR182 was seldom observed (Fig. 2J). Conversely, GPR182 was highly expressed in peritumoral areas, inversely correlating with blood vessel density (Fig. 2K and L). Additionally, through the analysis of single-cell RNA sequencing data (GSE47067) derived from mouse tissues [17], we observed that Gpr182 is highly expressed in liver sinusoidal endothelial cells (LSECs), exhibiting a similar expression pattern to other LSEC-specific markers, including Oit3, Lyve1, Cd36, and Stab2 (Fig. 2M). Whole-mount in situ hybridization (WISH) assays confirmed that zebrafish gpr182 was expressed throughout the vascular system during embryogenesis (Fig. 2N-R). Notably, gpr182 expression was observed in the dorsal aorta (DA) and posterior cardinal vein (PCV) at 24 h post fertilization (hpf), with sustained high levels in the PCV up to 48 hpf (Fig. 2N-P). The hybridization signal was apparently displayed in developing intersegmental vessels (ISVs) from 24 hpf onwards, with a pronounced concentration in the ventral half, diminishing by 48 hpf (Fig. 2N-P). At the later stage of zebrafish embryogenesis, gpr182 mRNA was evident in the liver (Fig. 2Q and R). The temporal and spatial expression of gpr182 in the zebrafish vascular system encompasses many key steps in embryonic angiogenesis [13], suggesting its regulatory role in angiogenesis.
Fig. 2
Comparative expression of GPR182 across species. (A, D, G) UMAP visualizations depict the distribution of GPR182 in the Human, Mouse, and Zebrafish cell atlases, respectively. (B, E, H) Relative distribution patterns of GPR182 across various cell clusters in Human, Mouse, and Zebrafish. (C, F, I) Mean expression levels of GPR182 within distinct cell clusters for each species. (J) Immunofluorescence staining of peritumoral and tumoral regions in HCC sections showing expressions of CD31 (a pan-endothelial marker) and GPR182. (K and L) Quantitative analysis of GPR182 expression intensity and microvessel density in peritumoral and tumoral regions of HCC sections (n = 10). Data are presented as mean ± SD, with statistical significance determined by Student’s t-test. ****, p < 0.0001. (M) Expression profiling of LSEC-specific markers in liver cell populations. (N-R) Whole-mount in situ hybridization of embryos reveals high gpr182 expression in the zebrafish vascular system and liver. The hybridization signals in developing ISVs, PCV, DA, and liver are indicated by green, blue, red, and magenta arrowheads, respectively
Loss-of-function in Gpr182 promotes sprouting angiogenesisTo characterize the role of Gpr182 in sprouting angiogenesis, a splicing blocking MO-mediated knockdown was utilized to downregulate gpr182 expression in the transgenic line Tg(fli1ep: EGFP-CAAX)ntu666, in which a chimera endothelial enhancer/promoter fragment (fli1ep) was employed to drive the specific expression of EGFP in ECs, and the CAAX membrane targeting motif enabled the localization of EGFP at the EC surface. Zebrafish harbor a single ortholog of the human GPR182 gene, with high sequence homology and conserved protein domains, as demonstrated through multiple alignments and structural predictions (Supplementary Fig. 1). This conservation suggests a preserved functional role across species. In vivo confocal imaging of the trunk vasculature in the gpr182 morphants of Tg(fli1ep: EGFP-CAAX)ntu666 zebrafish revealed abnormal angiogenic sprouts emerging from the dorsal aspect of intersegmental vessels (ISVs) or dorsal longitudinal anastomotic vessels (DLAVs) at 32 hpf (Fig. 3A). The excessive growing blood vessels anastomosed with ISVs or DLAVs at 48 hpf and evolved into a complex vascular network at 72 hpf without vascular retraction (Fig. 3A). Various aberrant vascular phenotypes were observed in gpr182 morphants, including Y-shaped structure formed by a single ISV gave rise to two sprouts connected to DLAV, H-shaped structure formed by an additional sprout connected two neighbor ISVs laterally, and a parallel ISV formed in close proximity to the pre-existing one (Fig. 3A). Compared to control siblings, these morphants displayed an increased number of ectopic sprouts and elongated ISVs in the trunk region (Fig. 3B-D). Importantly, the hyperbranching vascular phenotype was rescued by overexpressing gpr182 (Supplementary Fig. 2).
Fig. 3
Gpr182 deficiency promotes sprouting angiogenesis in zebrafish embryos. (A) Trunk vascular morphology in control MO and gpr182-MO-injected Tg(fli1ep: EGFP-CAAX)ntu666 embryos at 32, 48, and 72 hpf. Gpr182 deficiency results in increased ISV sprouting. Dashed rectangles highlight aberrant vascular phenotypes, and red arrowheads point to the sprouts. Scale bar, 100 μm. (B-D) Quantitative analysis of ectopic sprouts at 32 hpf and total ISV length at 48 and 72 hpf. (E) Confocal microscopy analysis of ISV tip cell filopodia in 24-hpf Tg(fli1ep: EGFP-CAAX)ntu666 embryos and ISV endothelial cells in 32- and 72-hpf Tg(fli1a: nEGFP) embryos. (F) Number of ISV tip cell filopodia per ISV in control and gpr182 morphant embryos at 24 hpf. (G and H) Number of ECs per ISV in control and gpr182 morphant embryos at 32 and 72 hpf, respectively. Data are presented as mean ± SD, with each data point representing an individual fish. A total of 10 fish were analyzed per group. Statistical significance was determined using Student’s t-test. ****, p < 0.0001
During the process of vascular pruning and remodeling, excessive blood vessels typically undergo retraction if they lack blood flow. However, in our study, we observed that these abnormally formed vessels persisted post-remodeling at 72 hpf. To investigate this phenomenon, we assessed blood flow in embryos harboring erythrocyte-labeled gata1:DsRed reporter and discovered that these aberrant vessels were not only lumenized but also perfused with blood (Supplementary Fig. 3A). Moreover, the aberrant vascular phenotypes could be recapitulated within gpr182 morpholino-injected Tg(flt1BAC:YFP); Tg(kdrl: ras-mCherry) double transgenic embryos, in which the arterial vessels are labeled with YFP and the whole vasculature are labeled with mCherry (Supplementary Fig. 3B), excluding a potential mistargeting effect of gpr182 morpholino.
To evaluate the effects of Gpr182 loss-of-function on EC behaviors, we conducted a detailed analysis of endothelial tip cell migration in 24-hpf embryos of Tg(fli1ep: EGFP-CAAX)ntu666, as well as stalk cell proliferation in 32 and 72 hpf embryos of Tg(fli1a: nEGFP) (Fig. 3E). Our findings revealed a significant increase in the number of filopodia in primary angiogenic sprouts at 24 hpf and in endothelial cell counts per ISV at both 32 and 72 hpf in the gpr182 morphants compared to control groups (Fig. 3F-H).
To substantiate the impact of GPR182 on angiogenesis, we utilized lentiviral transduction to knock down GPR182 in HUVECs. Our in vitro assays revealed that the knockdown of GPR182 significantly enhanced HUVEC migration, as depicted in Fig. 4A and B. Concurrently, the ability of these cells to form tubes was markedly elevated following GPR182 knockdown, characterized by an increase in the number of junctions and meshes, as well as the total mesh area and tube length of the vascular network (Fig. 4C-G).
These results collectively highlight a novel regulatory role for GPR182 in sprouting angiogenesis. The loss of GPR182 function stimulates EC migration and proliferation in both in vivo and in vitro settings, thereby driving the process of sprouting angiogenesis.
Fig. 4
Loss of GPR182 promotes EC migration and tube formation. (A and B) EC migration is assessed using the wound closure assay in HUVECs. Scale bar, 100 μm. (C) Representative microscopic images display tube formation by HUVECs. Scale bar, 100 μm. (D-G) Quantitative analysis of the number of junctions, meshes, total mesh area, and total tube length in HUVECs. Data are presented as mean ± SD. Statistical significance was determined using Student’s t-test. ****, p < 0.0001
Gpr182 loss-of-function leads to enhancement of cxcr4a expressionTo uncover the molecular mechanisms by which Gpr182 deficiency promotes sprouting angiogenesis, we conducted a comprehensive analysis of gene expression changes in gpr182 knockdown embryos at 36 and 48 hpf using bulk RNA transcriptomic profiling (Fig. 5A). Our analysis revealed significant alterations in a suite of genes pivotal to angiogenesis. Notably, the chemokine receptor cxcr4a, recognized for its role as an endothelial tip cell marker and a key promoter of angiogenic sprouting [18, 19], was markedly upregulated in the absence of Gpr182 (Fig. 5A). Furthermore, the expression of vegfaa, a principal regulator of angiogenesis, and esm1, another tip cell marker, was also elevated in the Gpr182 loss-of-function scenario (Fig. 5A). The expression of cxcr4a, vegfaa, and esm1 was verified by qPCR and WISH assay, respectively (Fig. 5A-B). Additionally, treatment of shGPR182-transfected HUVECs with AMD3100, a CXCR4 signaling inhibitor [20, 21], effectively restored the abnormal phenotype resulting from GPR182 loss of function (Fig. 4). These findings prompt the hypothesis that GPR182 may modulate sprouting angiogenesis through a CXCR4-dependent mechanism.
Fig. 5
Whole-genome transcriptomic profiling of control embryos and gpr182 morphants. (A) Heatmaps based on bulk RNA-seq data represent the expressions of cardiovascular-related genes in 36 and 48 hpf embryos. Zebrafish cxcr4a, vegfaa, and esm1 are upregulated in gpr182 morphants. (B and C) Expression levels of cxcr4a, vegfaa, and esm1 are validated by qPCR and WISH. Data are presented as mean ± SD, with statistical significance determined by Student’s t-test. *, p < 0.05; **, p < 0.01; ***, p < 0.001
GPR182 lacks intracellular G protein-mediated downstream signaling in response to ligand bindingCXCR4, a prototypical chemokine receptor, is typically modulated by atypical chemokine receptors (ACKRs), such as ACKR3 (also known as CXCR7) [22, 23]. These ACKRs, while structurally similar to GPCRs, lack the DRYLAIV motif necessary for G protein coupling and subsequent intracellular signaling [24]. Human GPR182 (hGPR182), akin to ACKR3, is missing this motif, implying potential atypical signaling characteristics. However, whether GPR182 acts as an ACKR that fails to initiate G protein-mediated signaling remains a subject of debate [8, 25]. To elucidate the signaling mechanisms of GPR182, we employed a live-cell fluorescence imaging system designed to monitor the dynamics of GPCR downstream signaling [26]. This system utilized two stable Hela cell lines genetically engineered to express biosensors for real-time detection of cAMP, Ca2+, RhoA, and ERK signals. These cell lines were co-transfected with hGPR182 expression plasmids and selected using puromycin to isolate GPCR-expressing cells.
Using CXCL12, the specific ligand for CXCR4, we stimulated GPR182, as previous studies have shown high-affinity binding between CXCL12 and GPR182 [8]. The activation dynamics of cAMP, Ca2+, RhoA, and ERK in response to CXCL12 were quantified using the live-cell imaging system. HeLa cells with GPR182 expression showed no alteration in cAMP and RhoA signaling in response to CXCL12 stimulation, similar to cells lacking GPR182 expression (Fig. 6A-D). Despite elevated basal levels of ERK and Ca2+ in control cells, GPR182 expression did not augment these signals (Fig. 6E-H).
Fig. 6
GPR182 does not trigger downstream signaling in response to CXCL12. (A and G) and (B and H), HeLa/cAMP/Ca2 + cells expressing GPR182 or an empty vector were treated with CXCL12. (C and D) and (E and F), HeLa/RhoA/ERK cells expressing GPR182 or an empty vector were treated with CXCL12. The addition CXCL12 starts at 5 min. Representative images of different biosensors before (left) and after (right) the stimulation of CXCL12. The response of the biosensors for cAMP levels (I and M), RhoA activity (J and N), ERK activity (K and O), and Ca2 + levels (L and P) is normalized by dividing by the averaged value before stimulation and plotted as a function of elapsed time after stimulation. The red and gray lines represent the time-course for the average and individual cells, respectively
Our findings suggest that GPR182 fails to trigger downstream signaling cascades following CXCL12 stimulation, reinforcing its classification as an atypical chemokine receptor.
GPR182 regulates CXCL12 bioavailability through chemokine scavengingOur research uncovers that GPR182 functions as an ACKR that fails to trigger downstream G protein-mediated signaling upon chemokine binding. However, how does GPR182 regulate CXCL12/CXCR4 signaling remains unrecognized. As the closest paralogue of GPR182, ACKR3 adopts two strategies for regulating CXCL12-CXCR4 axis-mediated signaling: by heterodimerizing with CXCR4 to facilitate its internalization and degradation, and by acting as a decoy receptor for CXCL12 scavenging [23]. To explore the potential interaction between GPR182 and CXCR4, we utilized the Förster resonance energy transfer (FRET) assay. This technique enables the detection of receptor dimerization at the single-cell level. FRET occurs when two proteins tagged with a fluorescence donor and acceptor are in close proximity, typically within 100 Å, the maximum distance for protein-protein interaction. In our experiments, human CXCR4 (hCXCR4) and human GPR182 (hGPR182) were fused to the FRET donor CFP and acceptor YFP, respectively. The CFP-tagged hCXCR4 (hCXCR4-CFP) and YFP-tagged hGPR182 (hGPR182-YFP) were co-transfected into HEK293T cells and subjected to acceptor-photobleaching-based FRET analysis. If energy transfer occurs from the donor to the acceptor, the fluorescence intensity of the donor decreases. When the acceptor fluorophore is bleached, the energy transfer from donor to acceptor is prevented, and thus the fluorescence intensity of the donor increases. Figure 7A presents the confocal images of HEK293 cells coexpressing hCXCR4-CFP and hCXCR4-YFP. ROI1 underwent acceptor photobleaching, while ROI2 served as an untreated control. A robust FRET signal, indicative of hCXCR4-CFP and hCXCR4-YFP interaction, was observed in ROI1 (Fig. 7A and B, Table 1), thereby confirming the homodimerization of CXCR4 [27]. Furthermore, the addition of CXCL12 to the culture medium led to a modest enhancement in FRET signals between CXCR4 homodimers, as detailed in Supplementary Table 1. In the absence of acceptor photobleaching, the fluorescence intensity of CFP in ROI2 continuously diminished (Fig. 7A and C). In comparison, the FRET phenomenon between hCXCR4-CFP and hGPR182-YFP was absent (Fig. 7D-F). These results suggested that the deduction that GPR182 physically interacts with CXCR4 for receptor internalization and degradation is precluded.
Fig. 7
GPR182 modulates CXCR4 signaling through internalizing CXCL12. (A and D) FRET analyses via acceptor photobleaching assess the formation of CXCR4 homodimers (positive control) and CXCR4/GPR182 heterodimers. Representative images display CFP and YFP fluorescent signals before and after photobleaching. White rectangles indicate the regions of interest (ROI) for photobleaching; negative controls lack photobleaching. (B, C, E, and F) Relative intensities of CFP and YFP in the corresponding ROIs for panels A (B and C) and D (E and F). (G) Confocal microscopy images depict CXCL12 internalization mediated by GPR182. HEK293T cells expressing YFP-tagged GPR182 are incubated with or without CXCL12, and endocytosis is assessed using an anti-CXCL12 antibody. (H) Quantification of intracellular GPR182 localization as shown in panel G. (I) Intracellular colocalization of GPR182 and Rab5 upon CXCL12 addition. HEK293T cells expressing YFP-tagged GPR182 are incubated with or without CXCL12, and cells are stained with an anti-Rab5 antibody
To determine if GPR182 acts as a decoy receptor modulating CXCL12 levels, we tracked CXCL12 internalization in HEK293T cells expressing YFP-tagged hGPR182 (Fig. 7G). In the absence of CXCL12, GPR182 was primarily localized to the cell membrane (Fig. 7G). However, upon CXCL12 stimulation, the receptor translocated intracellularly accompanied by the chemokine (Fig. 7G-H). Further analysis of GPR182 co-localization with the endosome marker Rab5 following CXCL12 treatment revealed a concentrated cytoplasmic signal, indicating that GPR182’s intracellular translocation is mediated by endocytic trafficking (Fig. 7I).
Table 1 FRET analysis for CXCR4 and GPR182 homo- and heterodimersInhibition of CXCR4 signaling normalizes the vasculature in HCCTo assess the functional relevance of cxcr4a upregulation in the excessive sprouting observed in gpr182 morphants, we treated them with CXCL12/CXCR4 signaling inhibitor, AMD3100. Treatment with AMD3100 effectively mitigated the hyperbranching phenotype in the trunk vasculature of Gpr182-deficient embryos (Fig. 8A and B). Further, to explore the therapeutic potential of CXCR4 inhibition in HCC, we administered AMD3100 to the zebrafish HCC model and analyzed liver vascular changes. The HCC liver vasculature exhibited disorganized features such as complex networks, excessive branching, and irregular growth patterns compared to controls (Fig. 8C and D). To quantify the vascular parameters, we reconstructed the three-dimensional structure of the liver vasculature (Fig. 8F, G, I and K). Quantifications of the liver vasculature showed significant increases in total hepatic vessel length and vascular branching points (Fig. 8M and N), indicative of tumor neoangiogenesis during HCC progression. Although the mean diameter of the liver vessel in HCC was not different from that in controls (Fig. 8O), the HCC liver vasculature had more uneven lumen calibers (Fig. 8P). These morphological characteristics closely resemble the phenotype observed in human liver cancer [28]. Treatment with AMD3100 normalized the aberrant liver vasculature in the HCC model (Fig. 8E, H, and L-P). In addition, inhibiting CXCR4 signaling significantly improved the survival rate of HCC zebrafish (Fig. 8Q). These results suggest that targeting the CXCR4 signaling pathway could be a promising therapeutic strategy for vascular normalization in HCC.
Fig. 8
Inhibition of CXCR4 signaling normalizes the vasculature in gpr182 morphants and the liver of HCC model. (A) Confocal microscopy images of trunk vessels in 48-hpf Tg(fli1ep: EGFPCAAX)ntu666 control embryos, embryos injected with gpr182 MO, embryos injected with gpr182 MO and gpr182 mRNA, and embryos injected with gpr182 MO and AMD3100. (B) Quantitative analysis of total ISV length. (C-E) Confocal images of liver vasculature in control zebrafish, HCC model zebrafish, and AMD3100-treated HCC zebrafish at 7 dpf. (F-L) Three-dimensional reconstructions of liver vasculature in controls, HCC zebrafish, and AMD3100-treated HCC zebrafish. Vascular vessels and branching points are indicated by green and orange, respectively. (M-O) Quantifications of total hepatic vessel length, number of vascular branching points, and vessel diameters of liver vasculature. Data are presented as mean ± SD. One-way ANOVA analysis was applied. Not significant (ns); ****, p < 0.0001. (P) Vessel diameter distribution in controls, HCC zebrafish, and AMD3100-treated HCC zebrafish. (Q) Survival rates of controls, HCC zebrafish, and AMD3100-treated HCC zebrafish until 10 dpf
Comments (0)