
Remember me
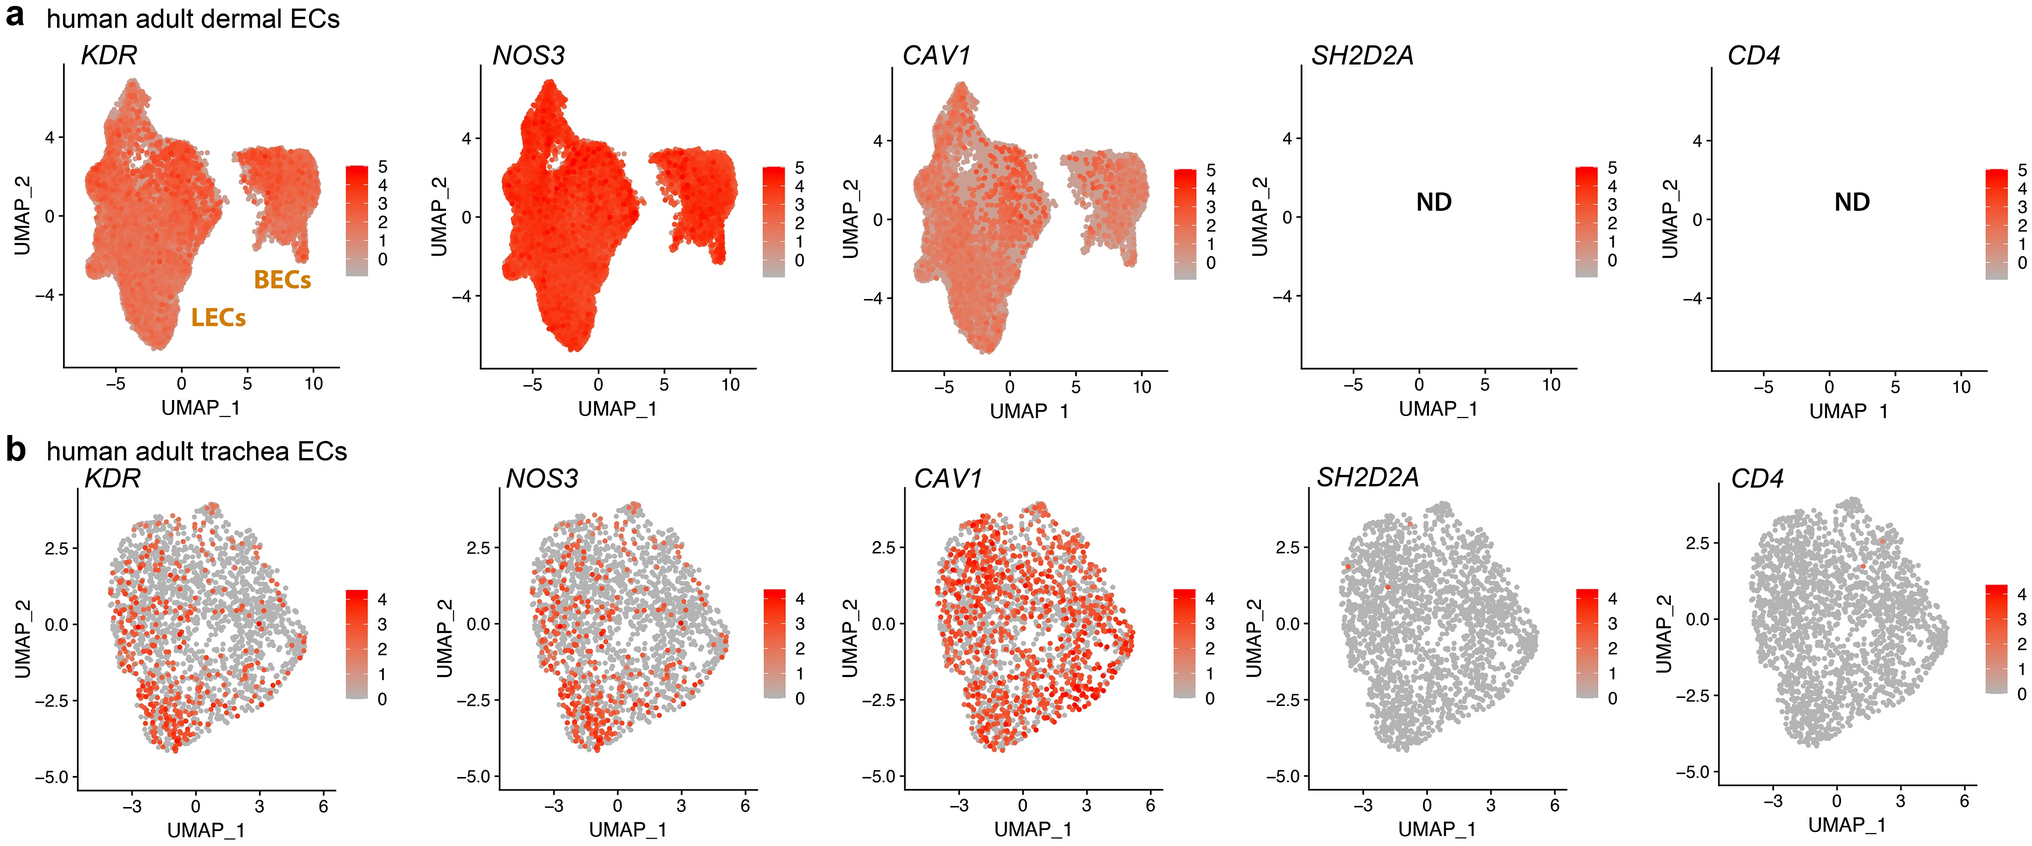


We initially used publicly available sc-RNAseq data to evaluate the expression of hyperpermeability-implicated genes in ECs. As the dermis has been widely used to investigate the VEGF hyperpermeability pathway via the Miles assay (e.g., [13, 24, 49,50,51], we first examined the expression of relevant signalling molecules in sc-RNAseq data of dermal ECs. FACS-isolated PECAM1-positive ECs from human adult dermis [36] form a cluster of blood vascular ECs and a smaller cluster of lymphatic vascular ECs [35]. Transcripts for the main EC markers and permeability pathway components VEGFR2 (KDR) and VE-cadherin (CDH5) as well as the key signalling mediators caveolin 1 (CAV1) and eNOS (NOS3) were readily detected in ECs of both clusters (Fig. 1a, Tables 1 and 2). We also detected all other permeability-relevant genes examined, including transcripts for the alternative VEGF receptors NRP1 (NRP1) and VEGFR1 (FLT1) and numerous signalling transducers/regulators implicated in VEGF hyperpermeability signalling [9, 29, 32], such as the vascular endothelial protein tyrosine phosphatase VE-PTP (PTPRB), syndecan 2 (SDC2), β-catenin (CTNNB1), AMPKA (PRKAA1), p38 (MAPK14), ABL1 (ABL1), ARG (ABL2) and focal adhesion kinase (PTK2) (Tables 1 and 2). YES1 and SRC detection rates in this human dermis dataset have previously been described [35]. Unexpectedly, this dataset contained no UMI counts assigned to SH2D2A in any of its 47,668 EC transcriptomes (Fig. 1a, Tables 1 and 2). As a negative control, we examined dermal ECs for expression of CD4, an endothelial-inactive gene that is a key marker for CD4 + T cells and NK cells [52,53,54], two cell types that express SH2D2A [27, 28, 55]. As expected, dermal EC transcriptomes did not include CD4 transcripts (Fig. 1a, Tables 1 and 2).
Fig. 1
SH2D2A is rarely detected in sc-RNAseq data from human skin or trachea ECs. sc-RNAseq data from human adult skin after isolation of PECAM1 ECs by FACS (a) and from human adult trachea after EC identification and selection (b). UMAP projections were generated to compare expression levels for KDR, NOS3, CAV1, SH2D2A and CD4; each data point represents the value for a single cell. ND, not detected; BECs, blood ECs; LECs, lymphatic ECs
Table 1 Average transcript levels for genes of the VEGF hyperpermeability pathway in ECs from sc-RNAseq datasetsTable 2 Prevalence of expression of genes in the VEGF hyperpermeability pathway in ECs from sc-RNAseq dataTable 3 Detection of proteins in the VEGF hyperpermeability pathwayLack of SH2D2A detection in dermal ECs was unexpected, considering that a prior study reported TSAd protein in dermal vasculature [27] and another study reporting that TSAd knockout mice lack a VEGF response in the Miles assay [24]. As the trachea is well suited to investigate vascular hyperpermeability pathways [56] and has also been used to implicate TSAd in permeability signalling [24], we next analysed adult sc-RNAseq data from ECs in the human trachea via the Human Cell Landscape compendium [37]. YES1 and SRC detection rates have already been described for this dataset [35]. Transcripts for KDR, CDH5, CAV1, NOS3 and all other examined genes implicated in the VEGF hyperpermeability were readily detected, whereas SH2D2A was detected in only 3/2045 trachea ECs with very low average transcript levels (Fig. 1b, c, Tables 1 and 2). This low detection level and frequency was again similar to that of CD4, which was detected at low levels in 2/2045 trachea ECs (Fig. 1b, c, Tables 1 and 2).
Next, we analysed sc-RNAseq data from the mouse, which has been the main model organism employed to define the roles of molecules in the VEGF hyperpermeability pathway (e.g., Refs. [12, 13, 17, 24, 33, 49, 50, 57]). Specifically, we took advantage of two sc-RNAseq compendia that contain a large number of ECs each, the EC atlas [39] and Tabula Muris [40]. The EC atlas contains data from ECs isolated with a combined MACS and FACS pipeline from 11 adult organs, whereas Tabula Muris contains data from ECs isolated with a FACS pipeline or droplet method from 10 adult organs. Notably, both compendia included the brain, lung and heart as examples of organs in which VEGF-induced vascular hyperpermeability has been observed.
In both the EC atlas and Tabula Muris, transcripts for Kdr and Cdh5 were readily detected in the brain, lung and heart EC populations (Tables 1 and 2; Yes1 and Src detection rates have been described [35]). ECs from the brain, lung and heart in both compendia also contained abundant transcripts for Cav1, Nrp1, Flt1, Ctnnb1 and Ptprb (Tables 1 and 2). Transcripts for other known signal transducers in the VEGF hyperpermeability pathway were also detectable, although less frequently and at more moderate levels, including Nos3, Sdc2, Ptk2, Prkaa1, Mapk14, Abl1 and Abl2 (Tables 1 and 2). By contrast, no UMI counts assigned to Sh2d2a were identified with the EC atlas in brain, lung and heart ECs, and both its detection level and detection rate were very low with Tabula Muris in these organs (Tables 1 and 2; Tabula Muris detection rate: brain ECs 3/733, lung ECs 6/702, heart ECs 12/1207). Tabula Muris also contains data for the mouse trachea, which was studied to put forward a role for TSAd in the VEGF hyperpermeability pathway [24]; however, Sh2d2a transcripts were also lacking from trachea ECs (Tables 1 and 2).
Next, we extended analysis of Sh2d2a transcripts to all ECs across all organs in the EC atlas; however, Sh2d2a transcripts were again not detected. Further, we analysed the entire pool of FACS-isolated ECs across all 10 Tabula Muris organs alongside pooled T cell and NK cells, which are known to express Sh2d2a (Fig. 2a). Moreover, we performed a similar, parallel analysis of the entire pool of ECs isolated with the alternative droplet method from 9 adult organs (Fig. 2b). We again found that Sh2d2a transcripts were rarely detected in ECs, i.e., in only 1% of FACS-captured ECs (39/4155) and in only 0.5% of droplet-captured ECs (18/3725) of Tabula Muris. Moreover, ECs with detectable Sh2d2a were as rare as ECs with detectable Cd4 (Fig. 2a, b), and average Sh2d2a transcript levels in ECs were as low as those for Cd4 (Fig. 2a, b). Low Sh2d2a detection rates and low transcript levels in ECs could not be attributed to technical difficulties in identifying Sh2d2a transcripts by sc-RNAseq, because Sh2d2a transcripts were readily detected in NK cells and T cells by both the FACS and droplet method in Tabula Muris (Fig. 2a, b). Vice versa, and as expected, the EC marker Kdr was not detected in NK cells or T cells (Fig. 2a, b). These observations on mouse and human organ ECs can be confirmed by directly exploring the publicly available interactive webtools of the original sc-RNAseq datasets (EC atlas: https://endotheliomics.shinyapps.io/ec_atlas/; Tabula Muris: https://tabula-muris.sf.czbiohub.org/visualizations; Human Cell Landscape: https://db.cngb.org/HCL/landscape.html).
Fig. 2
Sh2d2a is rarely detected in EC sc-RNAseq data from Tabula Muris. Tabula Muris sc-RNAseq data for the indicated genes, shown for FACS-captured (a) and droplet-captured (b) cells from pooled EC and immune clusters. A colour coded UMAP projection of cell type and tissue of origin is shown alongside UMAP projections illustrating the expression levels of the indicated genes per cell in each cluster. The corresponding violin plots illustrate the expression levels or each cell cluster. Each data point represents the value for one cell
Taken together, the above transcriptomic analyses suggest that TSAd transcripts are either not expressed in ECs or expressed at levels that are not readily detectable by sc-RNAseq. We therefore complemented sc-RNAseq analysis with bulk RNAseq analysis.
TSAd (SH2D2A) transcripts are absent or detected at low levels in EC bulk RNAseq dataBulk RNAseq has an excellent capacity for detecting lowly expressed genes in homogenous cell populations [58]. For example, SRC is not easily detectable in sc-RNAseq datasets from mouse and human organ ECs but readily detected across most of the 240 mouse and human endothelial bulk RNAseq datasets included in the Bulk-ECexplorer compendium [35]. Relevant for the present investigation, the Bulk-ECexplorer datasets are derived from EC subtypes that have been used to characterise the VEGFR2-TSAd-SRC pathway, namely human dermal microvascular ECs (HDMECs) [13, 24], human umbilical vein ECs (HUVECs) [22, 59], mouse lung ECs [13, 25] and mouse retina ECs [26]. The Bulk-ECexplorer also contains datasets from ECs of the mouse brain, an organ in which VEGF-induced vascular leakage is a significant concern [60]. Moreover, transcripts for the permeability-relevant EC markers KDR and CDH5 are defining features of the Bulk-ECexplorer datasets. To analyse the gene expression characteristics of permeability-relevant genes in ECs, we therefore took advantage of the Bulk-ECexplorer application, hosted at https://ruhrberglab.shinyapps.io/BulkECexplorer [35].
Similar to transcripts for the vascular barrier regulators YES1 and SRC [35], transcripts for other permeability-relevant genes were detected by the Bulk-ECexplorer at high frequency (Figs. 3a, S1A, Supplemental Table 1). Thus, transcripts for CAV1 and NOS3 were detected in all 240 EC RNAseq datasets of the Bulk-ECexplorer (Fig. 3a), and also for all permeability signalling regulators examined, including NRP1, FLT1, PTPRB, SDC2, PTK2, CTNBB1, PRKAA1, MAPK14, ABL1 and ABL2 (Supplemental Fig. 1). By contrast, SH2D2A transcripts were not detected in 45% of the 240 EC datasets in the Bulk-ECexplorer (Fig. 3a; Supplemental Table 1). SH2D2A detection in the other 55% of the EC datasets was mostly in HUVECs, the patho-physiologically least relevant EC subtype for vascular permeability studies amongst the five EC subtypes included in the Bulk-ECexplorer (e.g., SH2D2A detection in 27% of HDMEC versus 70% of HUVEC datasets; Fig. 3a). Moreover, SH2D2A transcripts, when present, were typically detected at very low levels, within a TPM range that was orders of magnitude smaller than the TPM range for CAV1, NOS3 or other permeability-relevant signal transducers (Figs. 3c; S1B). We therefore applied the 1 TPM threshold as a commonly used cut off for selecting genes suitable for downstream analysis, and thus found that only 13% of the 240 EC datasets in the Bulk-ECexplorer scored positive for SH2D2A, and these datasets were again almost exclusively derived from HUVECs (Fig. 3b).
Fig. 3
Bulk RNAseq reveals absent or low SH2D2A expression in human and mouse ECs. Expression of CAV1, NOS3, SH2D2A and CD4 in endothelial bulk RNAseq datasets (HUVEC n = 128, HDMEC n = 15, mouse lung EC = 24, mouse brain EC = 54, mouse retina EC n = 19). a, b Stacked bar charts depict the total number of bulk RNAseq datasets analysed and the frequency at which transcripts for the indicated genes were (a) detected (> 0 TPM) versus not detected (= 0 TPM), or (b) detected (≥ 1 TPM) versus not detected (< 1 TPM) above the 1 TPM threshold; data are resolved by EC subtype. c Transcript levels for the indicated genes with expression > 0 TPM in each dataset for the indicated EC subtypes, including boxplots to illustrate the median and interquartile range; each data point represents one dataset. The dashed red line indicates the 1 TPM threshold. For n, see corresponding source data file
Insufficient read depth can sometimes explain the absence of a transcript in bulk RNAseq data [61]. In agreement, SH2D2A detection in the 240 datasets of the Bulk-ECexplorer positively correlated with higher read depth (Supplemental Fig. S2). Nevertheless, genes detectable only at high read depth are naturally expressed at low levels [62]. Further, we considered that expression levels below 1 TPM in only a subset of EC samples is also observed for numerous genes not expected to be functional within ECs, for example, several ocular genes (LENEP, CRYBB2) and sex cell-specific genes (DDX4, GDF9, YBX2, SPACA4) [35]. We therefore compared the expression characteristics of SH2D2A to those of the T cell marker CD4, which is not expected to be expressed in ECs and is only rarely detected in EC sc-RNAseq data (see Fig. 2). CD4 was detected in nearly half of the EC datasets included in the Bulk-ECexplorer (48% detection frequency), but only 11% of EC datasets expressed CD4 at levels above 1 TPM (Fig. 3b, data resolved per EC type). When CD4 expression was detected in ECs, it was within a TPM range orders of magnitude smaller than the TPM range for CAV1, NOS3 or other permeability-relevant signal transducers, as observed for SH2D2A (Figs. 3c, S1B). Therefore, TSAd transcripts were either not detected in EC bulk RNAseq datasets or were detected at very low levels, akin to an EC-inactive gene.
TSAd (SH2D2A) transcript levels in ECs are not upregulated in response to VEGFTo assess whether SH2D2A expression was increased upon VEGF stimulation, we performed differential expression analyses of three published bulk RNAseq data, which we identified by searching the European Nucleotide Archive (ENA; https://www.ebi.ac.uk/ena/) for the term ‘VEGF endothelial’. We identified three HUVEC datasets that contained both control and VEGF-stimulated samples. Amongst these, two different projects [63, 64] stimulated HUVECs cultured in 2D with VEGF and analysed them at time points from 1 to 12, or at 24 h post treatment, respectively. Among the VEGF-induced hyperpermeability pathway members, FLT1 appeared upregulated from 1 to 24 h and CTNNB1 from 1 to 12 h after VEGF exposure (Supplemental Table S2). ABL2 and YES1 appeared transiently upregulated 1 h after VEGF treatment, and CAV1, KDR and NRP1 transiently 4 h after VEGF treatment (Supplemental Table S2). In another project, HUVECs were grown as spheroids to model sprouting angiogenesis [65]. FLT1, CTNNB1 and NRP1 were upregulated 18 h after VEGF exposure (n = 5 per group). By contrast, transcript levels of the other permeability pathway genes did not appear to be significantly enriched in any of the datasets (Supplemental Table S2). As observed for HUVEC datasets in the Bulk-ECexplorer, all permeability pathway genes examined were detected robustly across all three datasets, with exception of SH2D2A, whose TPM values ranged from 0 to 1 TPM in 14/14 control samples and in 12/14 VEGF-stimulated samples, and was detected at 1 or 2 TPM in the remaining two samples (Supplemental Table S2).
Low TSAd (SH2D2A) levels in ECs are predicted to arise from leaky gene expressionStudies across several different cell types have found that lowly expressed (LE) transcripts can arise from leaky transcription, a phenomenon in which highly expressed (HE) genes impart a ‘transcriptional ripple effect’ on nearby genes that lack active chromatin markers [62, 66,67,68,69]. Notably, such LE genes do not usually give rise to detectable protein, and their transcripts are therefore thought to be biologically irrelevant [70,71,72]. Like other cell types, ECs contain a mixture of LE and HE transcripts whose combined expression values assume a bimodal distribution [35]. To predict whether transcripts arise from actively and leakily expressed genes, a two component Gaussian mixture model (GMM) can be fitted to such gene expression data and the probability of genes belonging to either the LE or HE distribution calculated, as initially done to examine the T cell transcriptome [73, 74], and subsequently applied to each one of the 198 bimodally distributed EC datasets included in the Bulk-ECexplorer [35].
Similar to SRC and YES1 [35], CAV1 and NOS3 were classified by the GMM approach as actively expressed in the vast majority of eligible (i.e., bimodal) Bulk-ECexplorer datasets in which their transcripts were detected (> 98%), and similar results were obtained for NRP1, FLT1, PTPRB, SDC2, PTK2, CTNBB1, PRKAA1, MAPK14, ABL1 and ABL2 (Figs.
Comments (0)