Cell culture
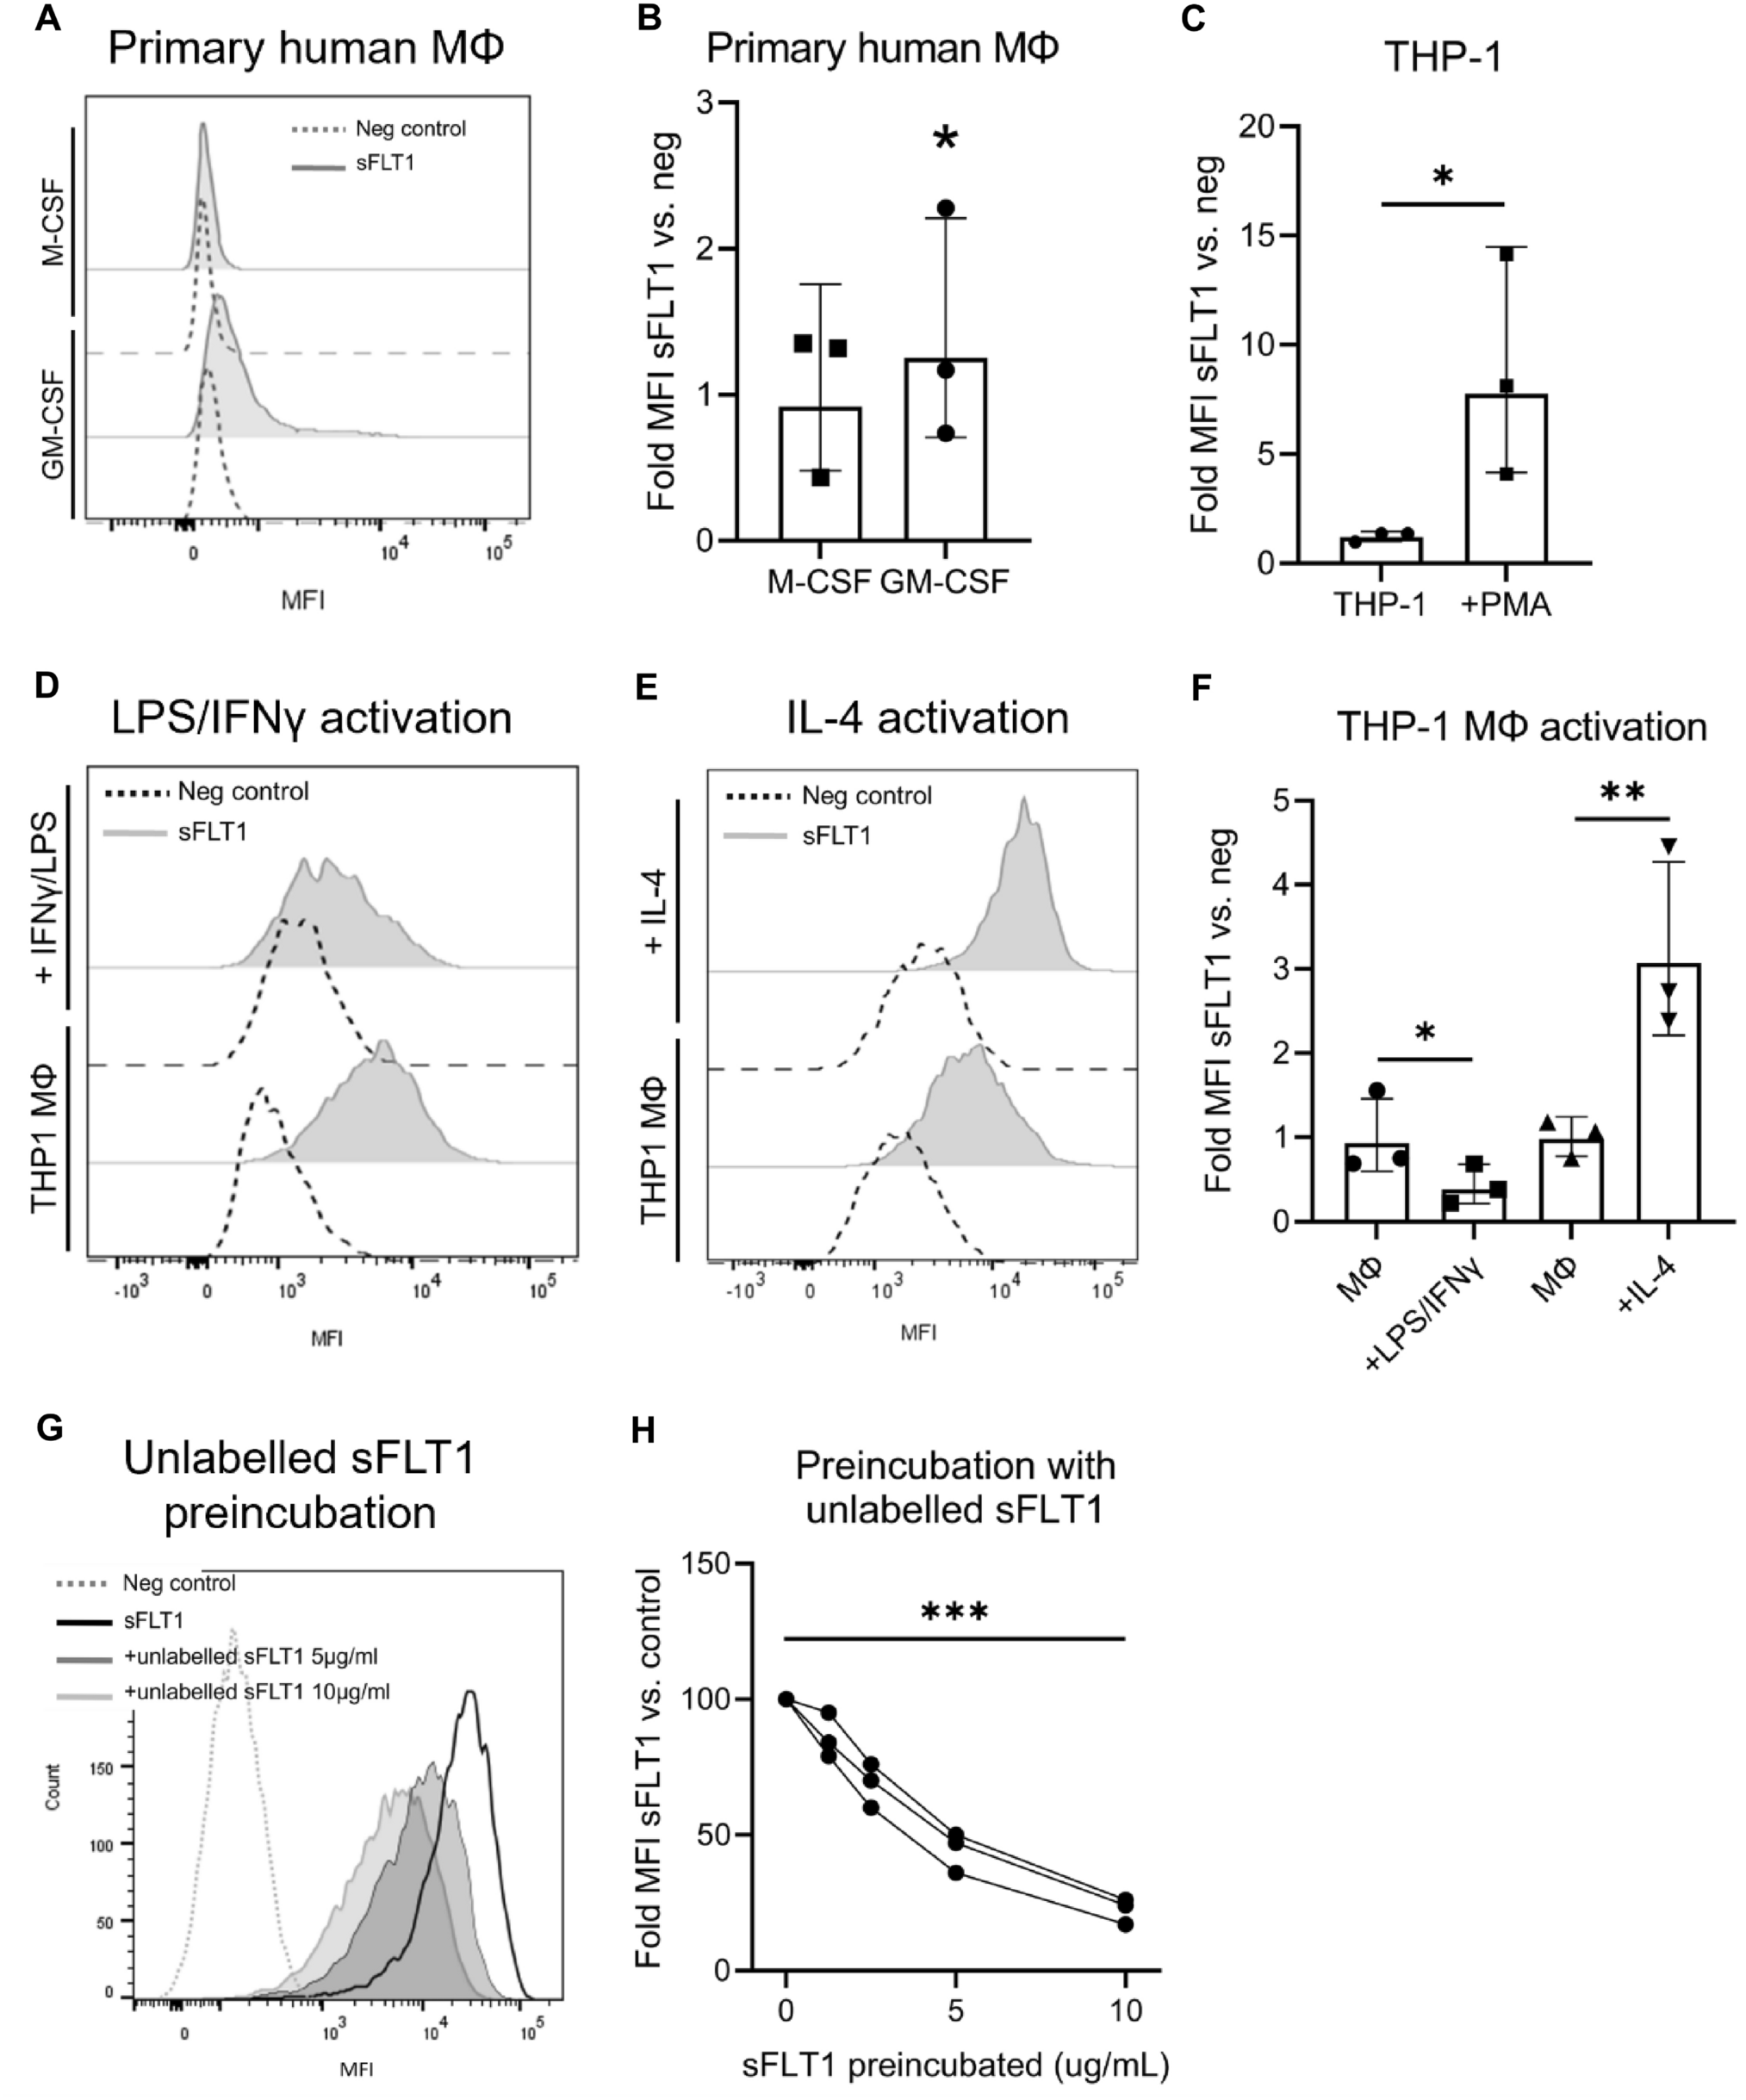
Human monocytic THP-1 cells were maintained in RPMI 1640 culture medium (10% FCS, 1% P/S). THP-1 cells were differentiated toward THP-1 macrophages by incubation with 10 ng/mL phorbol 12-myristate 13-acetate for 48 h (PMA, Sigma, P8139), followed by “resting incubation” in full media for 24 h. THP-1 macrophages were then activated toward proinflammatory macrophages by incubation with 20 ng/ml of IFN-γ (R&D) and 1 ng/ml LPS (Sigma) for 24 h. Anti-inflammatory macrophage activation was obtained by incubation with 10 ng/ml of IL-4 (Sino Biologicals) for 48 h. Mouse RAW264.7 cells were maintained in DMEM culture medium (10% FBS, 1% P/S). Primary monocytes obtained from a buffy coat were differentiated toward macrophages using RPMI 1640 media (10% FCS and 1% PS) containing either GM-CSF or M-CSF for 72 h, as was described previously [27].
Flow cytometry
For detection of sFLT1 binding in macrophages, both indirect and direct detection methods were used in this project. For indirect detection of sFLT1 binding in human cell lines, cells were incubated with BSA or sFLT1-His protein (5 µg/ml, Sino Biological) and cell surface sFLT1 was detected using mouse anti-His (1:1000, MA1-21315, Invitrogen) and Alexa Fluor 647 anti-mouse (1:600, Thermo Fisher) antibodies. For indirect detection of sFLT1 binding in murine RAW264.7 macrophages, incubation with murine sFLT1-VSV protein and VSV as a control were used [8], which were detected using anti-VSV (1:9000, Abcam, 1.0 mg/mL, ab19257) and Alexa Fluor 647 anti-rabbit (1:600, Thermo Fisher) antibodies. In heparin and enzyme studies, a directly labelled sFLT1-His-AF647 protein was used (900 ng/ml).
Before sFLT1 incubation, cells were washed twice with PBA (1% BSA/PBS). Cells were then detached with 5 mM disodium EDTA, pH 7.2, at 37 °C for 5 min. 200,000 cells were incubated with sFLT1 at 4 °C for 30 min while shaking. Washing cells three times with PBA between every incubation step, cells were then consecutively incubated with primary and secondary antibodies for 30 min and finally stained with propidium iodide for 10 min. Analysis was performed using a BD FACSCanto-II 3L flow cytometer (BD Biosciences, San Jose, CA, USA). Cyto-Cal beads FC3MV (Distrilab, Leusden, Netherlands) were used for calibration allowing comparison of different measurements over time.
To study the specificity of sFLT1 binding, IL-4 activated THP-1 macrophages were first incubated with indicated concentrations of non-labeled sFLT1 protein, followed by washing and staining with labeled sFLT1 protein (900 ng/ml).
For internalization studies, in-between sFLT1 and primary antibody incubation steps, cells were incubated at 4 or 37 °C for 30 min. Cell surface sFLT1-His was indirectly detected using the above-mentioned protocol.
For heparin and enzyme experiments, cells were co-incubated with sFLT1 and heparin (LEO), or pretreated with heparinase III (37290-86-1, Sigma) or chrondroitinase ABC (9024-13-9, Sigma) prior to sFLT1 incubation.
For CCR2 and CX3CR1 protein measurement, IL-4 activated THP-1 macrophages were preincubated with sFLT1-His for 24 h, then a directly labelled CCR2-BV605 (1:40, Bio legend) or CX3CR1-AF647 (1:80, Bio legend) protein was used.
Figures show the fold differences in geometric mean fluorescence intensity (MFI) between sFLT1, CCR2 or CX3CR1incubated and negative control cells. Groups were compared using the statistical methods described below.
Cellular staining
Cells were grown on glass coverslip slides in 24-well dishes and washed three times with PBS/1% BSA (PBA). Cells were incubated with sFLT1 as described in Flow cytometry methods section, and then stained with anti-neuropilin-1 (5 μg/ml 1 h, AF3870, R&D) and anti-perlecan (1:20, A7L6, GeneTex) antibodies. Cells were fixed with 4% buffered paraformaldehyde for 15 min and permeabilized with 100% ice-cold methanol for 15 min. Cells were further stained as described in Flow cytometry methods section. For mounting, EverBrite Mounting Medium with DAPI was used.
Receptor identification
IL-4-activated THP-1 macrophages were dissociated and incubated with sFLT1-His (4C, 30 min). Then, cells were lysed using lysis buffer (50 mM Na2HPO4, 300 mM NaCl, 10 mM imidazole, protease inhibitors, 1% Triton X-100; pH 7.4; 30 min) and sonication (3 × 10 s). His-containing protein complexes were then purified from the cell lysates using HisPur Cobalt Resin beads, using manufacturer’s protocol (Thermo Fisher).
Samples were loaded onto a 4–12% Bis–Tris gradient gel (Invitrogen) and run for 1.5 cm. Subsequently, each lane was cut into 6 bands. Gel slices were first washed 3 × with water, and subsequently subjected to reduction with 10 mM dithiothreitol, alkylation with 50 mM of iodoacetamide, and in-gel trypsin digestion using a Proteineer DP digestion robot (Bruker). After addition of trypsin (at 12.5 ng/µl) and swelling of the bands, the bands were transferred to Eppendorf vials and the bands were covered in 25 mM NH4HCO3 pH 8.3. Tryptic digestion took place overnight at 37 C and the peptides were extracted from the gel slices with with 50/50/0.1 v/v/v water/acetonitril/formic acid. Finally peptides were lyophilized.
Tryptic peptides were dissolved in water/formic acid (100/0.1 v/v) and subsequently analyzed by on‐line C18 nanoHPLC MS/MS with a system consisting of an Ultimate3000nano gradient HPLC system (Thermo, Bremen, Germany), and an Exploris480 mass spectrometer (Thermo). Fractions were injected onto a cartridge precolumn (300 μm × 5 mm, C18 PepMap, 5 µm, 100 A, and eluted via a homemade analytical nano-HPLC column (50 cm × 75 μm; Reprosil-Pur C18-AQ 1.9 µm, 120 A (Dr. Maisch, Ammerbuch, Germany). The gradient was run from 2 to 40% solvent B (20/80/0.1 water/acetonitrile/formic acid (FA) v/v) in 40 min. The nano-HPLC column was drawn to a tip of ∼10 μm and acted as the electrospray needle of the MS source. The mass spectrometer was operated in data-dependent MS/MS mode for a cycle time of 3 s, with a HCD collision energy at 30 V and recording of the MS2 spectrum in the orbitrap, with a quadrupole isolation width of 1.2 Da. In the master scan (MS1) the resolution was 120,000, the scan range 400–1500, at standard AGC target @maximum fill time of 50 ms. A lock mass correction on the background ion m/z = 445.12 was used. Precursors were dynamically excluded after n = 1 with an exclusion duration of 10 s, and with a precursor range of 20 ppm. Charge states 2–5 were included. For MS2 the first mass was set to 110 Da, and the MS2 scan resolution was 30,000 at an AGC target of 100% @maximum fill time of 60 ms.
In a post-analysis process, raw data were first converted to peak lists using Proteome Discoverer version 2.2 (Thermo Electron), and submitted to the Uniprot database (Homo sapiens, 20,596 entries), using Mascot v. 2.2.07 (www.matrixscience.com) for protein identification. Mascot searches were with 10 ppm and 0.02 Da deviation for precursor and fragment mass, respectively, and trypsin as enzyme. Up to two missed cleavages were allowed. Methionine oxidation and acetyl on protein N-terminus were set as a variable modification; carbamidomethyl on Cys, were set as a fixed modification. Protein FDR was set to 1%. Normalization was on total peptide amount.
RNA sequencing
RNA was extracted from 4 different treatment groups: differentiated THP-1 macrophages treated with BSA or IL-4 for 48 h, and from IL-4-activated macrophages further treated with BSA (10ug/ml) or sFLT1 (10ug/ml) for 24 h. RNA was isolated using TRIzol, RNA concentration was measured using nanodrop and quality and integrity of RNA were controlled with an Agilent 2100 Bioanalyzer (RIN values 9.6–10).
RNA-Seq FASTQ files were processed using the opensource BIOWDL RNAseq pipeline v5.0.0 developed at the LUMC. This pipeline performs FASTQ preprocessing (including quality control, quality trimming, and adapter clipping), RNA-Seq alignment, and read expression quantification FastQC was used for checking raw read QC. Adapter clipping was performed using Cutadapt (v2.10) with default settings. RNA-Seq reads’ alignment was performed using STAR (v2.7.5a) on GRCh38 human reference genome. The gene read quantification was performed using HTSeq-count (v0.12.4) with setting “–stranded = yes”. The gene annotation used for quantification was Ensembl version 104. Using the gene read count matrix, CPM was calculated per sample on all annotated genes. Genes with a CPM higher than 1 in at least 25% of all samples are kept for downstream analysis. For the differential gene expression analysis, dgeAnalysis R-shiny application was used. EdgeR (v3.28.1) with TMM normalization was used to perform differential gene expression analysis. Benjamini and Hochberg FDR was computed to adjust p-values obtained for each differentially expressed gene. Using a cutoff of 0.05 at the adjust p-values, we identified all up and down regulated genes.
qPCR
For qPCR experiments, the primers listed in Table 3 were used.
Statistics
To analyze differences in cell surface sFLT1, log-transformed geometric mean fluorescence intensities (MFI) were compared using two-way analysis of variance, linear mixed models or linear regression, as indicated in the figure legends. Where indicated, the intercept random effects of the independent experiments were included in the linear mixed models, to account for inter-experiment variance. For comparison of gene expression, normalized gene expression data were log-transformed and compared using Students’ t-test.


Comments (0)