Overall Model Structure
A budget impact model was developed to estimate the financial consequences of the adoption and diffusion of lebrikizumab as a new treatment within the current healthcare system. Specifically, the model predicts how changes in the therapeutic landscape will impact healthcare expenditure for management of patients with severe AD.
The model was developed using Microsoft Excel to simulate an annual cohort of patients with severe AD who are eligible for systemic treatment, as reported by the reimbursement criteria of AIFA [28]. It adopted the perspective of the Italian NHS. The model incorporated data on the target population, projected market share, treatment acquisition costs, and costs associated with managing disease flares and adverse events (AEs). These data were combined to estimate the annual costs in two different scenarios: scenario A, where lebrikizumab is not marketed in the country and the standard of care includes dupilumab and tralokinumab; and scenario B, where lebrikizumab is available in Italy, thus considering three therapies: dupilumab, tralokinumab, and lebrikizumab. As for other budget impact models, this study was performed using inputs informed by previously conducted studies. For this reason, ethical approval is not necessary.
Time Horizon
The model evaluated the change in healthcare expenditures associated with the introduction of lebrikizumab as a therapeutic option for patients with severe AD, considering it as an alternative option to existing treatments over a 3-year time horizon, following AIFA guidelines.
Model Input Data
Four categories of input data were collected: (1) eligible population, (2) real-world market shares, (3) cost input, and (4) clinical inputs. All data and relevant assumptions were reviewed and validated by Italian clinical experts.
Population
The process for selecting the target population for inclusion in the budget impact model is reported in Table 1. The model included patients with severe AD (EASI ≥ 24), aged ≥ 12 years, and weighing at least 40 kg and as indicated by the AIFA reimbursement criteria, drawn from a hypothetical cohort of 53 million health plan members. In the general population there were 198,763 individuals with severe AD [29, 30]. Among individuals with severe AD, 2% were treated with advanced systemic treatment (18,520 patients). Within the patients treated with systemic treatments, 64.6% were treated with monoclonal antibodies (mab); therefore, the target population included 11,978 patients with severe AD as reported by market research conducted by IQVIA for the Italian system. On the basis of this population, the model assumed an average growth of the population treated with systemic therapy of 25%, as indicated by clinical expert opinion. Therefore, the target population increased to 14,973 in the first year of the simulation, 18,716 in the second year, and 23,395 in the third year.
Table 1 Target populationMarket Share
To estimate the number of patients treated with specific therapies in the market share (MS) scenarios with and without lebrikizumab, the utilization rates of each individual drug were applied to the estimated eligible patient population for each simulated year. The MS data for the scenario without lebrikizumab (scenario A) was obtained from a recent market research study conducted by IQVIA for the Italian system [32].
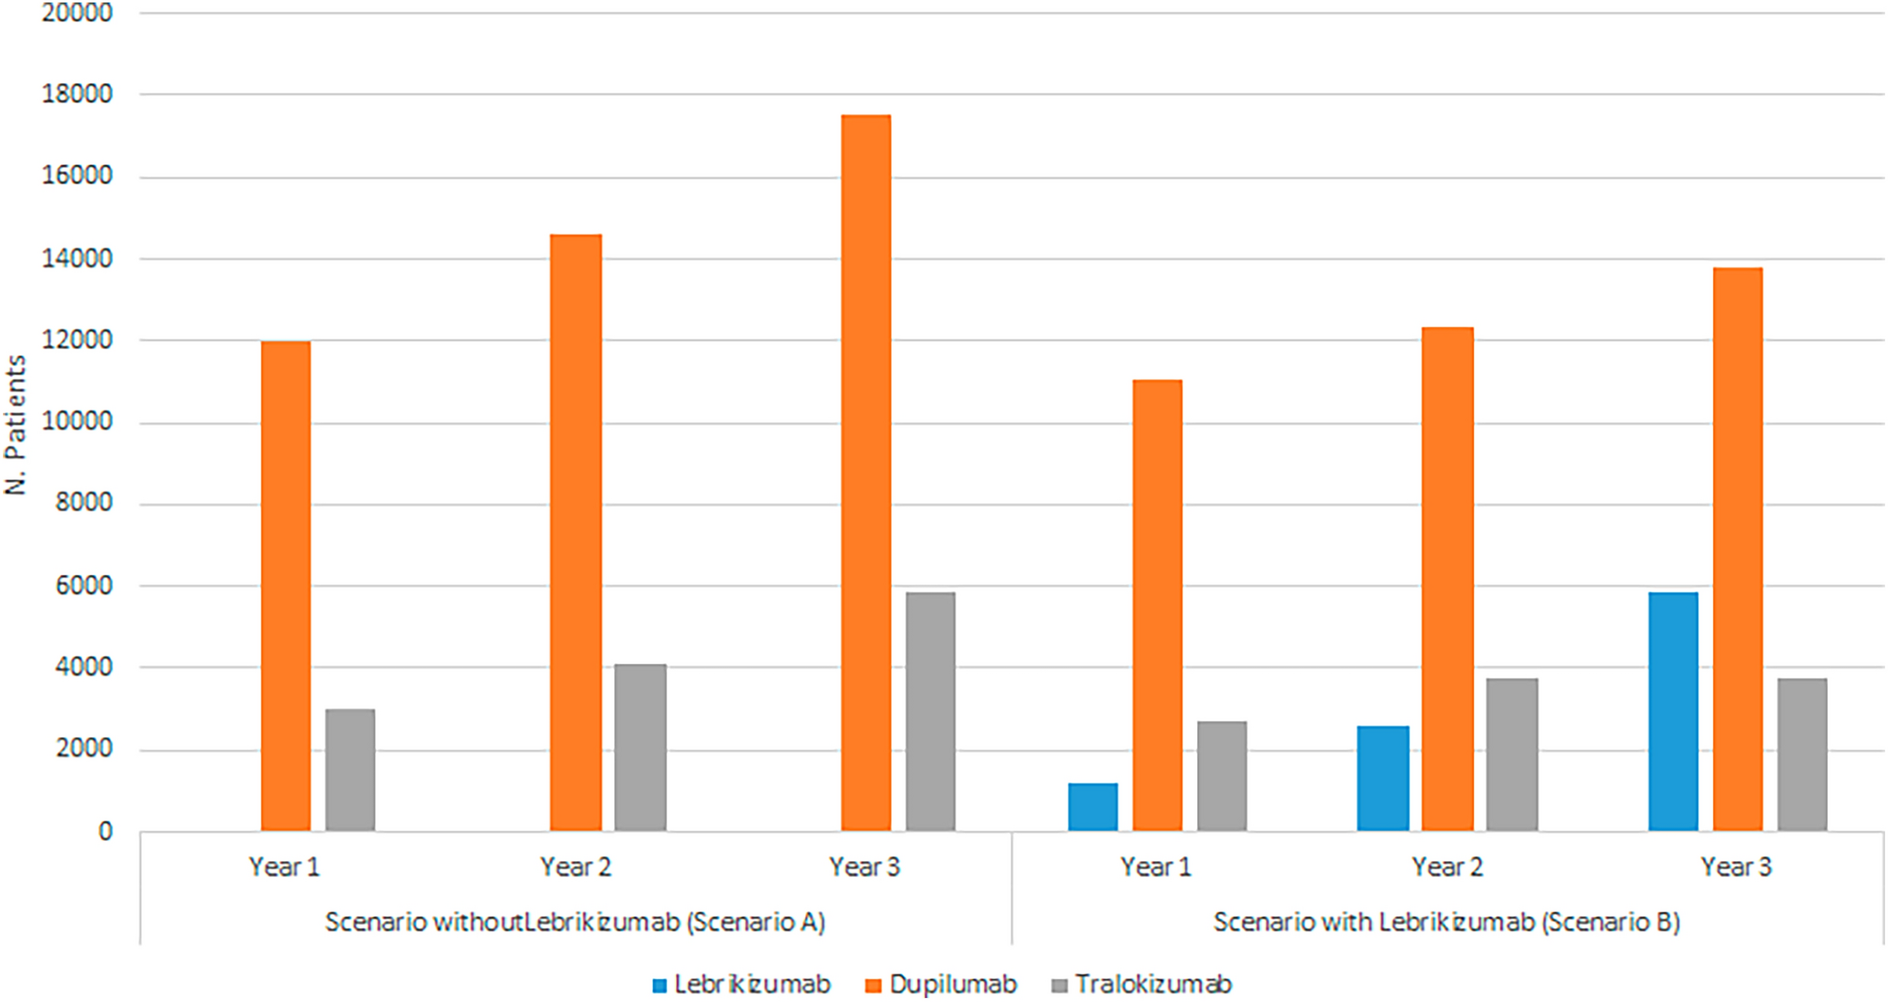
In the scenario without lebrikizumab (scenario A), patients were treated with either tralokinumab or dupilumab. Specifically, in the first year of simulation, 20% of patients were treated with tralokinumab and 80% with dupilumab, in the second year 22% with tralokinumab and 78% with dupilumab, and in the third year 25% with tralokinumab and 75% with dupilumab.
In the new scenario with lebrikizumab (scenario B), it was assumed that a proportion of patients would receive lebrikizumab instead of receiving dupilumab and tralokinumab. It was assumed that the number of patients treated with lebrikizumab increased during the simulated period: 8% in the first year, 14% in the second, and 25% in the third year of simulation. The number of individuals treated with dupilumab decreased from 74% during the first year to 59% during the last year of simulation, while patients treated with tralokinumab decreased from 18% in the first year to 16% in the last year of simulation (base case scenario) (Table 2).
Table 2 Market share in the scenario without lebrikizumab (scenario A) and in the scenario with lebrikizumab (scenario B) (base case analysis)Clinical Data
In the model, efficacy data for the included treatments were retrieved from a network meta-analysis (NMA) [33]. Specifically, the estimated response rate, defined as the patients achieving an EASI 75 and Investigator Global Assessment (IGA) 0/1 with a reduction of ≥ 2 points, were incorporated into the analysis. This outcome was selected by clinical experts as the most appropriate one to reflect the assessment of treatment efficacy in clinical practice. The response rates were 46.8%, 49.17%, and 31.35%, for lebrikizumab, dupilumab, and tralokinumab, respectively.
The model included data on the flare rate, converted into annual rate, of disease flare occurrence during treatment, as well as the 16-week rate, converted into annual rate, of AEs occurrence [34]. The following AEs were considered: injection site reaction, allergic conjunctivitis, infectious conjunctivitis, oral herpes, upper respiratory tract infection, and acne. The annual rates of disease flare and AEs occurrence were based on data reported in the UK National Institute for Health and Care Excellence (NICE) Technology evaluation (TA986–NICE) [34].
Costs and Healthcare Resource Use
In accordance with the chosen analysis perspective, the model incorporated only direct medical healthcare costs covered by the Italian NHS. These costs included drug acquisition and treatment-specific disease costs, and flare and AEs management costs.
The drug acquisition costs for each therapy were computed as an annual expense by multiplying the unit cost by the number of injections per year. Specifically, for each treatment, the first year included an induction phase (weeks 0–16) followed by a maintenance phase (weeks 17–52). In subsequent years, only the annual maintenance frequency was considered. The dose and treatment regimens for each therapy were obtained from the European public assessment report (EPAR) provided by European Medicines Agency (EMA) and from the Summary of Product Characteristics (SmPC) as documented on the AIFA website. The ex-factory price per package, adjusted for the statutory discount (− 5%, followed by − 5%) was considered in compliance with legal requirements for each reimbursed drug. Table 3 shows the prices for each drug included in the analysis, as referenced from the Italian official gazettes.
Table 3 Healthcare resource utilization and costs inputThe model included the costs associated with disease management according to the response status of patients (responders vs non-responders). The following healthcare resources were considered: dermatologist outpatient consultations, general practitioner (GP) visits, and full blood count (FBC) tests. The annual costs of disease management were computed by multiplying the number of responders and non-responders by the number of each healthcare resource used and its corresponding unit cost.
In the model, the costs associated with managing disease flares were included. These were estimated by multiplying the cost of healthcare resources used for flare management by the annual flare occurrence.
The model included also the costs associated with the management of the following AEs: injection site reactions, allergic conjunctivitis, infectious conjunctivitis, oral herpes, upper respiratory tract infections, and acne. The annual costs associated with managing these events were computed by multiplying the number of events per year for each treatment by the cost of healthcare resources used for their management. Specifically, for injection site reactions, the cost of emergency department visit was considered; for infection conjunctivitis the cost of specialist visit plus antibiotics treatment was included; whereas for all other adverse events, only the cost of specialist visit was considered.
Statistical Analysis
The model output was the budget impact of lebrikizumab in Italian patients with severe AD according to AIFA reimbursement criteria. The total budget impact was estimated on an annual basis as the difference in total costs between the market scenario with and without lebrikizumab. The total costs in both scenarios, in each year and overall, were estimated as the sum of total costs of drug acquisition, disease management, and AEs management incurred in each year of simulation.
To assess the robustness of the study findings, a one-way sensitivity analysis was conducted. Specifically, the impact of each parameter included in the model was assessed. An iterative replacement approach of individual model inputs was performed by using their ± 20% change while holding other inputs constants. Subsequently, the resulting set of sensitivity analyses were ranked by the absolute magnitude of deviation from the base case to assess which input parameter had the most significant impact on the results.
Finally, to account for potential different market penetration of lebrikizumab, three sensitivity analyses with different market share were conducted. Specifically, the first sensitivity analysis included a reduction of 25% of use of lebrikizumab, the second sensitivity analysis a 50% reduction, and the third sensitivity analysis a reduction of 75% (Table 4).
Table 4 Market share in the sensitivity analyses 


Comments (0)