
Remember me

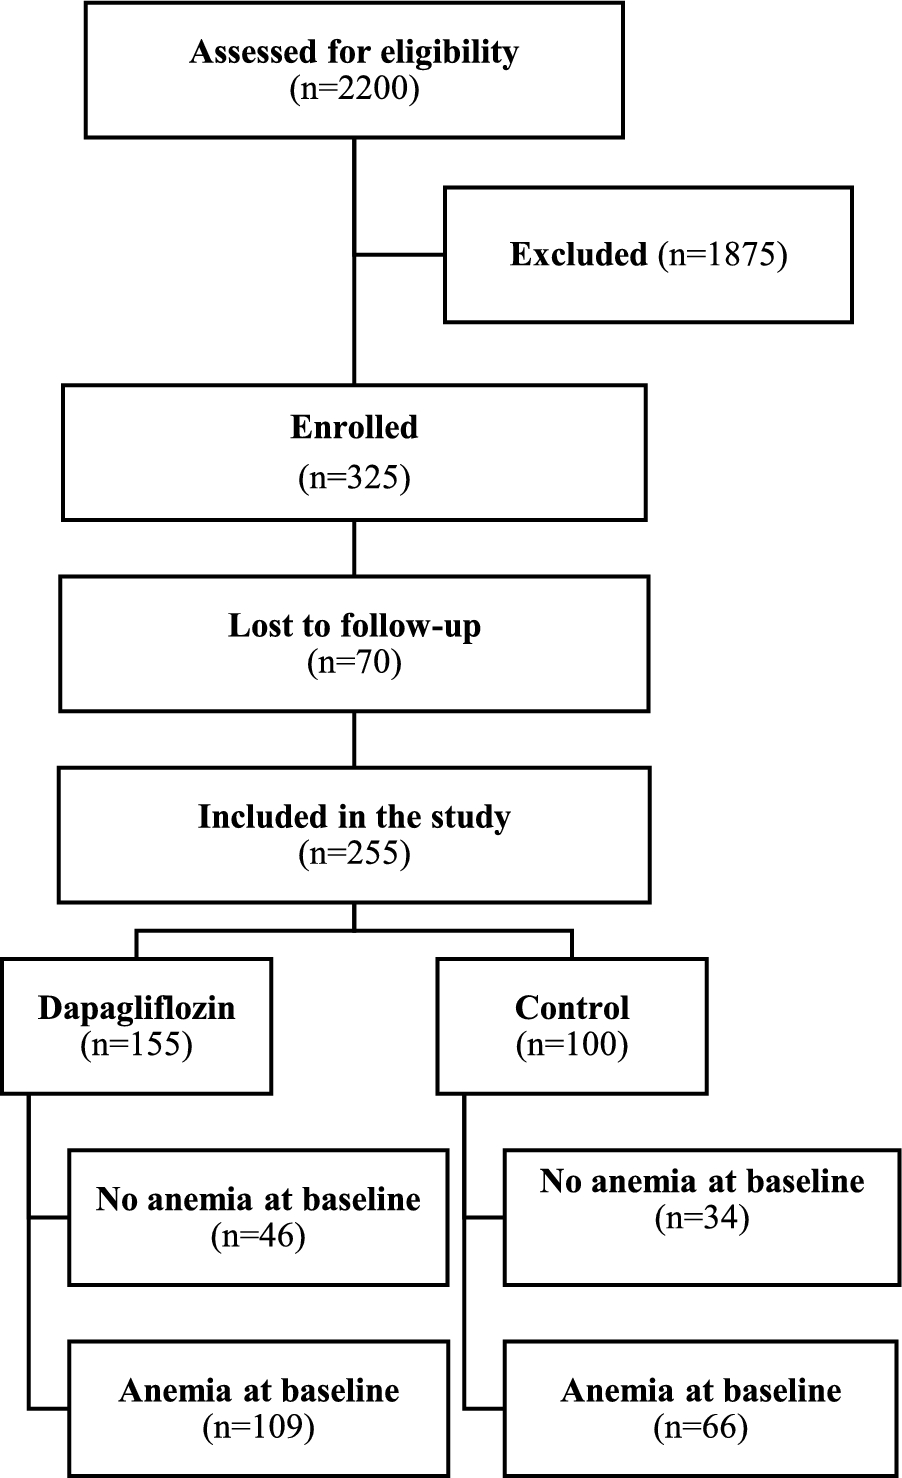


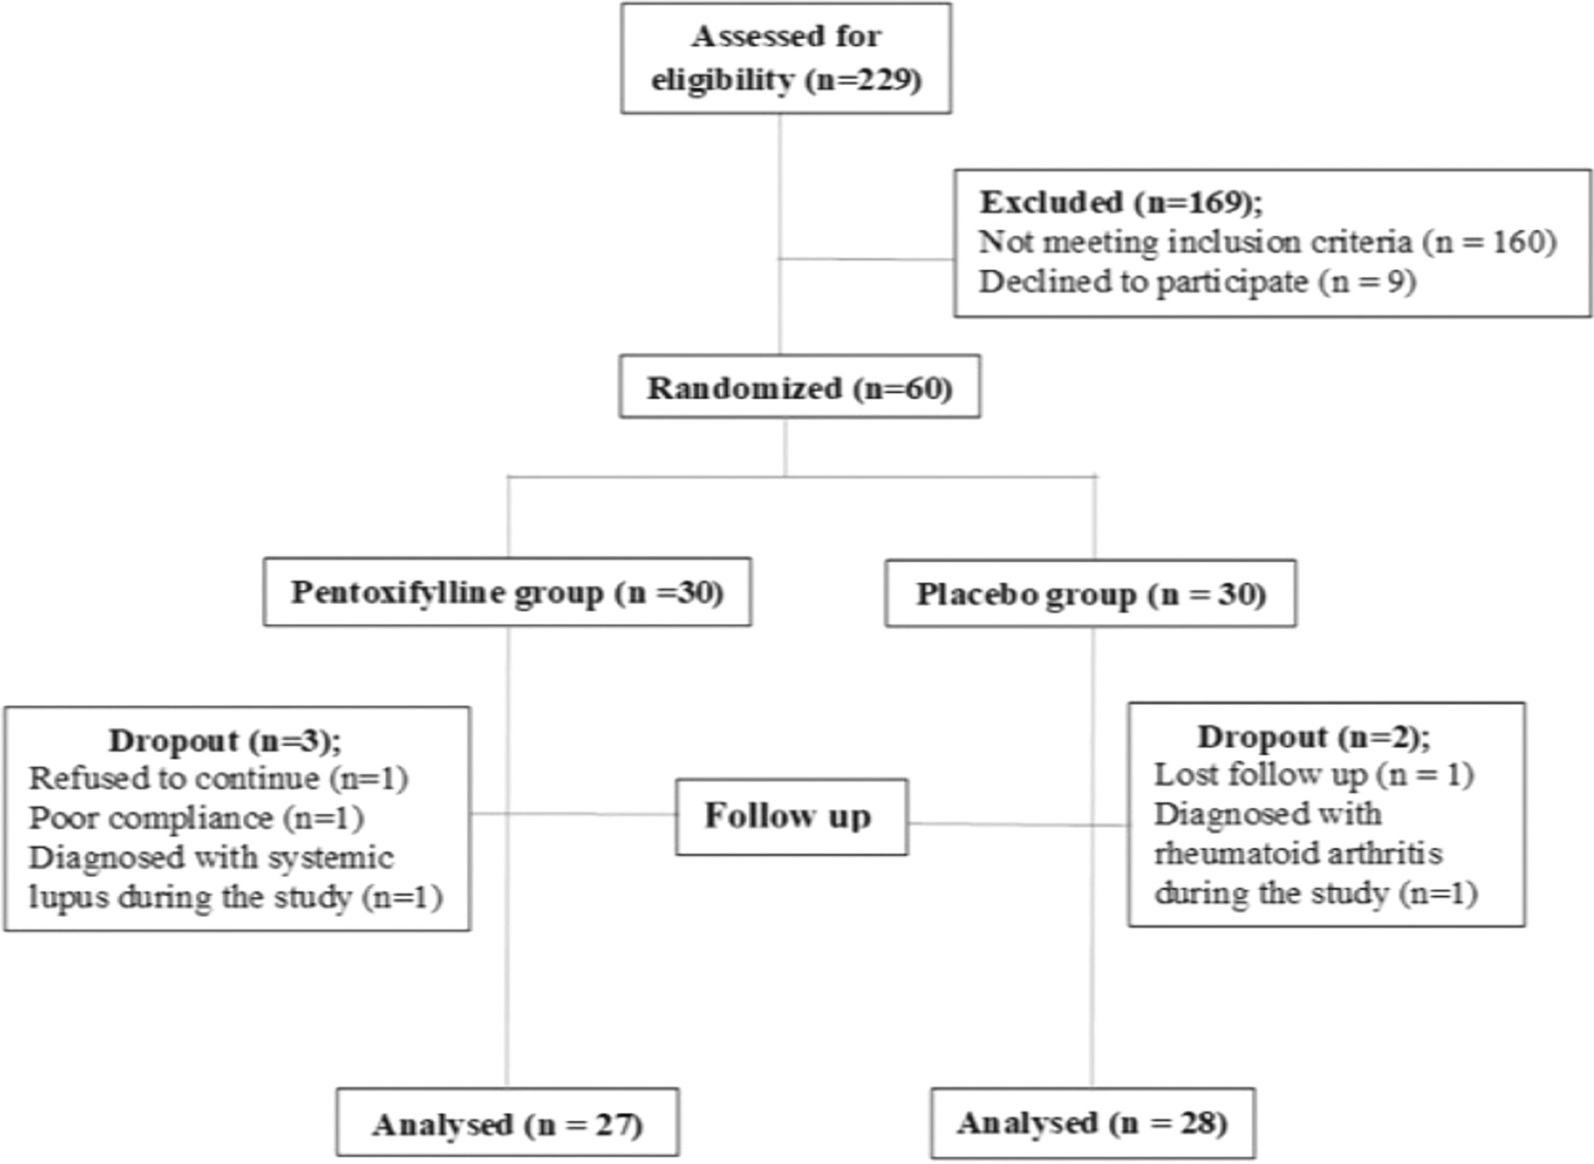
A total of 255 patients were included in the study, with 155 in the dapagliflozin group and 100 in the control group. Anemia was present in 109 dapagliflozin-treated patients and 66 controls. Figure 1 is a flow diagram of the study participants.
Fig. 1
Flow diagram of the study participants. A schematic representation of patient selection, inclusion, exclusion criteria, and final groups analyzed
Baseline characteristics were generally comparable between the dapagliflozin (n = 155) and control (n = 100) groups, with no significant differences in age, sex distribution, BMI, blood pressure, smoking status, glycemic control, or key laboratory measures including hemoglobin, hematocrit, ferritin, TSAT, eGFR, and albuminuria. Anemia was present in 109 (70.3%) dapagliflozin-treated patients and 66 (66%) controls (p = 0.468). Approximately half of the patients were aged ≥ 65 years. The only significant difference was a higher prevalence of hypertension in the dapagliflozin group (91.0% vs. 73.0%, p < 0.001).
When further stratified by baseline anemia status, expected differences in hematologic parameters emerged: anemic patients had lower hemoglobin and hematocrit, and tended to have lower TSAT, ferritin, and eGFR, reflecting greater disease burden. Among anemic individuals, those receiving dapagliflozin had significantly higher UACR levels compared to anemic controls (995 vs. 551 mg/g, p = 0.030), indicating more severe albuminuria. Additionally, hypertension was significantly more common among anemic dapagliflozin users (p = 0.001), and PPI or H2RA use was more frequent among anemic patients in the control group (p = 0.019). Prior use of ESAs and iron was infrequent and balanced across groups. These findings suggest that while the overall study groups were largely balanced, baseline anemia was associated with more advanced kidney disease and higher comorbidity burden, particularly in the dapagliflozin group.
A detailed summary of baseline characteristics, stratified by anemia status, is provided in (Table 1).
Table 1 Description of baseline characteristicsOutcomesPatients were classified into dapagliflozin and control groups, with further stratification based on baseline anemia status. Anemia-related outcomes included the development of IDA in the overall cohort (defined as presence of both biochemical evidence [ferritin < 100 ng/mL or TSAT% < 20% with ferritin 100–299 ng/mL] and a hemoglobin decline). Outcomes in patients without anemia at baseline included the incidence of new-onset anemia and a hemoglobin increase ≥ 1 g/dL. In patients with anemia at baseline who did not develop IDA and did not receive iron or ESA therapy, outcomes included hemoglobin increase hemoglobin increase and anemia correction. We employed a more stringent definition of anemia correction, requiring achieving sex specific thresholds with a hemoglobin increase of ≥ 1 g/dL from baseline rather than simply crossing a lower threshold. Changes in TSAT% and ferritin levels were also analyzed. Also, we assessed the initiation of ESA therapy in the full cohort of patients with anemia at baseline, regardless of whether they developed IDA, to capture broader treatment patterns. Longitudinal changes over the study duration were assessed using a linear mixed-effects model that included patients with and without anemia at baseline, who did not develop IDA and did not receive iron or ESA therapy.
To strengthen the validity of comparisons and reduce baseline confounding, a propensity score-matched analysis was conducted, matching patients on relevant variables including age, sex, baseline eGFR, hemoglobin, comorbidities, and medication use. This analysis yielded a matched cohort in which baseline characteristics were well balanced between the dapagliflozin and control groups. After propensity score matching, 88 patients were included in each group. Baseline characteristics were well balanced, with standardized mean differences below 0.1 for most variables and none exceeding 0.2 (Table S1 in the Supplementary Appendix). Covariate balance before and after matching is illustrated in Figure S1.
IDA developmentIDA—defined as ferritin < 100 ng/mL, or TSAT% < 20% with ferritin between 100 and 299 ng/mL, in conjunction with a measurable decline in hemoglobin during follow-up—developed in 40 (36.7%) dapagliflozin-treated patients and 12 (18.2%) control patients. All patients who developed IDA experienced a measurable decline in hemoglobin and received iron therapy. ESA therapy was initiated in 8 (7.3%) dapagliflozin-treated patients (all with IDA) and 16 (24.2%) control patients.
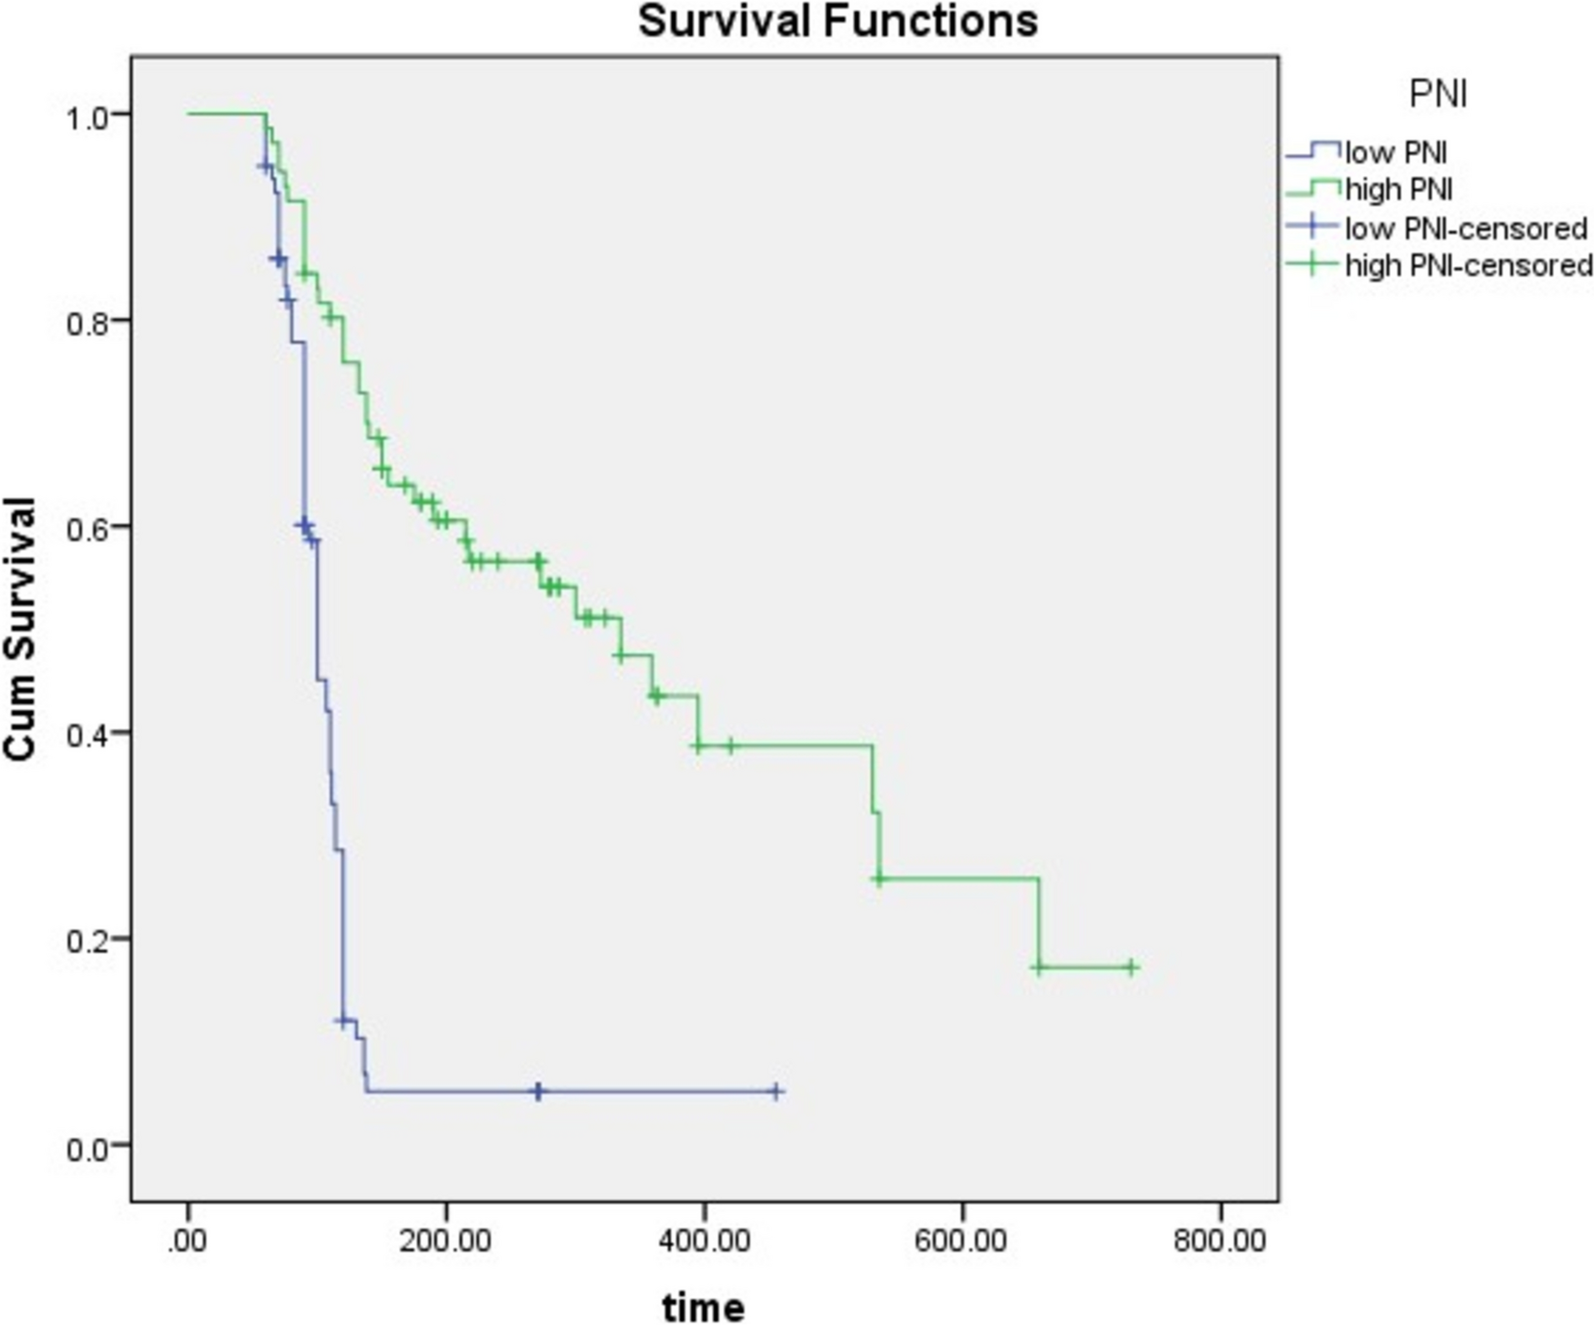
Dapagliflozin was associated with a significantly shorter IDA-free survival time (10.53 months, 95% CI 10.09–10.97) compared to control (11.60 months, 95% CI 11.40–11.89; Log-rank p = 0.005) (Fig. 2A). This difference was consistent across eGFR subgroups (≥ 30 mL/min and < 30 mL/min) (Fig. 3A, B). While a higher proportion of males in the dapagliflozin group developed IDA, this difference was not statistically significant. However, female patients in the dapagliflozin group experienced significantly shorter IDA-free survival (9.82 months, 95% CI 9.12–10.53) compared to control (11.48 months, 95% CI 11.03–11.93; Log-rank p = 0.009) (Fig. 3C, D).
Fig. 2
Time to hemoglobin changes and anemia outcomes. Kaplan–Meier curves showing the time to IDA, incident anemia, hemoglobin increase, and anemia correction in the study population
Fig. 3
Time to development of iron deficiency anemia (IDA) stratified by subgroups of eGFR and sex. Survival curves depicting the incidence of IDA over time in different subgroups based on eGFR and sex
Cox regression analysis identified dapagliflozin treatment (HR 5.27, 95% CI 2.39–11.63, p < 0.001) as a significant risk factor for IDA development, while higher baseline TSAT% (HR 0.73, 95% CI 0.62–0.86, p < 0.001) and ferritin (HR 0.991, 95% CI 0.985–0.997, p = 0.002) were protective. Despite the observed difference in IDA-free survival between sexes in the Kaplan–Meier analysis, sex itself was not a significant predictor of IDA development in the Cox regression model (Fig. 4).
Fig. 4
Hazard ratio for factors associated with the development of IDA. Forest plot displaying hazard ratios for various clinical and demographic factors influencing the risk of developing IDA
Given that all cases of IDA occurred exclusively among patients with anemia at baseline, and that these patients were excluded from subsequent analyses of hemoglobin increase and anemia correction, we present IDA outcomes first to provide context and define the analysis population for the following subgroup results.
Outcomes in patients without anemia at baselineIn patients without baseline anemia (n = 80; control, n = 34; dapagliflozin, n = 46), incident anemia—defined as a hemoglobin decrease of ≥ 1 g/dL, resulting in a hemoglobin level < 13.0 g/dL in males or < 12.0 g/dL in females—was observed in 4 (11.8%) control patients but none in the dapagliflozin group. The mean time to a decrease in hemoglobin of ≥ 1 g/dL was (11.56 months, 95% CI 10.98–12.13; Log-Rank p = 0.017) in the control group (Fig. 2B). Conversely, a hemoglobin increase ≥ 1 g/dL was observed in 15 (32.6%) dapagliflozin-treated patients.
No cases of IDA occurred in the dapagliflozin group. Accordingly, this subgroup’s analysis focused on hemoglobin stability and treatment exposure over time.
Outcomes in patients with baseline anemia who did not develop IDA and did not require iron or ESA therapyThis analysis focused on patients who were anemic at baseline and was stratified based on the development of IDA and the use of iron or ESA therapy during follow-up. By separating the analysis for patients who did not develop IDA or receive iron or ESA therapy, we aimed to isolate the intrinsic effect of dapagliflozin on hemoglobin response and anemia correction, independent of confounding interventions. Outcomes included the proportion of patients achieving a hemoglobin increase of ≥ 1 g/dL and the rate of anemia correction based on sex-specific thresholds.
The full cohort of patients with baseline anemia (n = 175; control, n = 66; dapagliflozin, n = 109) was stratified based on whether they developed IDA or required iron or ESA therapy. In the subgroup of patients who remained free of IDA and did not receive iron or ESA therapy (n = 111; control, n = 42; dapagliflozin, n = 69), we assessed hemoglobin response, anemia correction, changes in TSAT% and ferritin, and the longitudinal effects on hemoglobin using a linear mixed-effects model.
To capture broader treatment patterns, ESA therapy initiation was also evaluated in the full cohort of patients with baseline anemia (n = 175), including those who developed IDA and received iron supplementation.
Hemoglobin increase and anemia correctionIn patients with baseline anemia who did not develop IDA and did not require iron or ESA therapy (n = 111; control, n = 42; dapagliflozin, n = 69), a hemoglobin increase ≥ 1 g/dL was observed in 46 (66.7%) dapagliflozin-treated patients and 6 (14.3%) control patients. Anemia correction was achieved in 37 (53.6%) dapagliflozin-treated patients, including 33 (47.8%) due to a hemoglobin increase ≥ 1 g/dL, and 2 (4.8%) control patients. The mean time to hemoglobin increase ≥ 1 g/dL was significantly shorter in the dapagliflozin group (7.30 months, 95% CI 6.36–8.25) compared to control (11.57 months, 95% CI 11.11–12.03; Log-Rank p < 0.001) (Fig. 2C). This finding was consistent across eGFR and sex subgroups (Fig. 5).
Fig. 5
Time to a hemoglobin increase of ≥ 1 g/dL in patients with anemia at baseline who did not develop IDA or receive iron or ESA therapy, stratified by subgroups. Kaplan–Meier curves showing hemoglobin increases in this specific patient cohort
Cox regression analysis confirmed that dapagliflozin treatment (HR 4.93, 95% CI 1.89–12.81, p = 0.001) was significantly associated with hemoglobin increase. Higher baseline hemoglobin (HR 0.53, 95% CI 0.31–0.91, p = 0.021) was associated with a lower likelihood. This may reflect a biological ceiling effect, where individuals with relatively higher hemoglobin values at baseline have less room for improvement compared to those with more severe anemia. Conversely, higher baseline TSAT% (HR 1.13, 95% CI 1.04–1.24, p = 0.006), ferritin (HR 1.01, 95% CI 1.005–1.016, p < 0.001), and a history of iron use (HR 2.62, 95% CI 1.01–6.30, p = 0.032) were associated with a greater likelihood of hemoglobin increase (Fig. 6).
Fig. 6
Hazard ratio for factors associated with an increase in hemoglobin of ≥ 1 g/dL in patients with anemia at baseline who did not develop IDA and did not receive iron or ESA therapy. Forest plot illustrating predictors of hemoglobin increase
Similarly, the mean time to anemia correction—defined as achieving hemoglobin ≥ 13.0 g/dL in males or ≥ 12.0 g/dL in females, with a ≥ 1 g/dL increase—was significantly shorter in the dapagliflozin group (8.48 months, 95% CI 7.54–9.41) compared to control (11.86 months, 95% CI 11.66–12.05; Log-Rank p < 0.001) (Fig. 2D). This was consistent across eGFR and sex subgroups (Fig. 7).
Fig. 7
Time to correction of anemia in patients with anemia at baseline who did not develop IDA and did not receive iron or ESA therapy, stratified by subgroups. Kaplan–Meier curves showing the time to anemia correction in these patients
Cox regression analysis showed that dapagliflozin treatment was associated with a significantly higher likelihood of anemia correction compared to the control group (HR 9.84, 95% CI 2.08–46.57, p = 0.004). However, the wide confidence interval indicates a substantial degree of uncertainty in the precise effect size. This wide range could be attributed to the relatively small number of patients achieving anemia correction, particularly in the control group. The low event rate in the control subgroup leads to limited data for estimating the treatment effect, resulting in variability in the hazard ratio estimate. Despite the uncertainty, the lower bound of the confidence interval (2.08) still supports a significant positive effect of dapagliflozin on anemia correction. Furthermore, higher baseline TSAT% was associated with a 16% higher likelihood of anemia correction per unit increase in TSAT% (HR 1.16, 95% CI 1.05–1.28, p = 0.003) (Fig. 8).
Fig. 8
Hazard ratio for factors associated with correction of anemia attributed to a hemoglobin increase of ≥ 1 g/dL in patients with anemia at baseline who did not develop IDA and did not receive iron or ESA therapy. Forest plot displaying predictors of anemia correction
These findings were consistent in the propensity score–matched cohort, supporting the association between dapagliflozin and improved anemia outcomes. Dapagliflozin was significantly associated with a higher likelihood of anemia correction (OR 22.4, 95% CI 4.45–407.4, p = 0.0028; logistic regression) (Table S1). While the strength of the anemia correction effect was substantial, the wide confidence interval around the point estimates suggest caution in interpreting the strength of the association and likely reflect the limited number of correction events post-matching.
ESA therapy initiationThis analysis included the full cohort of patients with baseline anemia (n = 175; control, n = 66; dapagliflozin, n = 109), encompassing those who developed IDA and received iron supplementation. in order to capture broader treatment patterns related to ESA use. ESA therapy was initiated in a significantly lower proportion of dapagliflozin-treated patients (7.34%) compared to control patients (24.24%). The mean time to ESA initiation was significantly longer in the dapagliflozin group (11.53 months, 95% CI 11.21–11.86) compared to control (10.77 months, 95% CI 11.14–11.41; Log-Rank p = 0.002) (Fig. 9). This difference was significant in the overall group and in females, particularly those with eGFR ≥ 30 mL/min, but not in males or those with eGFR < 30 mL/min (Fig. 10).
Fig. 9
Time to initiation of ESA therapy in patients with anemia at baseline (n = 175)
Fig. 10
Time to initiation of ESA therapy in patients with anemia at baseline, stratified by subgroups. Kaplan–Meier curves showing the initiation of ESA therapy in different subgroups
Cox regression analysis showed that dapagliflozin treatment (HR 0.29, 95% CI 0.10–0.89, p = 0.031) and higher baseline hemoglobin (HR 0.15, 95% CI 0.03–0.68, p = 0.014) were associated with a lower hazard of ESA initiation. Despite the observed difference between sexes in the Kaplan–Meier analysis, sex itself was not a significant predictor the Cox regression model (Fig. 11). These associations were also observed in the subgroup with eGFR ≥ 30 mL/min (Fig. 12).
Fig. 11
Hazard ratio for factors associated with initiation of ESA therapy in patients with anemia at baseline. Forest plot depicting the association of clinical and demographic factors with ESA therapy initiation
Fig. 12
Hazard ratio for factors associated with initiation of ESA therapy in patients with anemia at baseline and eGFR ≥ 30 mL/min. Forest plot showing predictors of ESA therapy initiation in this subgroup
In female patients with anemia at baseline (n = 99), dapagliflozin was associated with an 85% lower hazard of ESA initiation compared to the control group (HR 0.15, 95% CI 0.036–0.653, p = 0.011). Additionally, higher baseline TSAT% (HR 0.71, 95% CI 0.541–0.930, p = 0.013) was associated with a significantly lower hazard of ESA initiation (Fig. 13).
Fig. 13
Hazard ratio for factors associated with initiation of ESA therapy in female patients with anemia at baseline. Forest plot depicting predictors of ESA therapy initiation in female patients
In the propensity score–matched analysis, the trend toward reduced ESA use in the dapagliflozin group persisted; however, the difference did not reach statistical significance (HR 0.54, 95% CI 0.20–1.46, p = 0.225; logistic regression) (Table S1). This suggests that although dapagliflozin may reduce the need for ESA therapy, this effect may be influenced by residual confounding or sample size limitations.
Changes in TSAT% from baseline to study endAnalysis of TSAT% levels from baseline to the end of the 12-month study in patients who did not develop IDA and did not receive iron or ESA therapy (n = 191) revealed a mean decrease in both the control and dapagliflozin groups. The control group showed a modest mean decrease of 2.62% (SD = 1.94%), while the dapagliflozin group exhibited a larger mean decrease of 5.77% (SD = 2.55%). The mean baseline TSAT% levels were comparable between the two groups (Control: 32.7%, SD = 4.73; Dapagliflozin: 33.7%, SD = 4.91), with mean final TSAT% levels being 30.0% (SD = 4.44%) and 27.9% (SD = 3.77%), for the control and dapagliflozin groups, respectively (Figure S2). A t-test comparing the change in TSAT% between the two groups revealed a statistically significant difference (t = 9.68, df = 185.33, 95% CI 2.51–3.80, p < 0.001), suggesting that the treatment with dapagliflozin was associated with a larger decrease in TSAT% over time than in the control group.
Changes in ferritin from baseline to study endAnalysis of changes in ferritin levels from baseline to the end of the 12-month study in patients who did not develop IDA and did not receive iron or ESA therapy (n = 191) revealed a statistically significant difference between treatment groups (t = 10.18, df = 186.08, 95% CI 46.91–69.47, p < 0.001). Mean baseline ferritin levels were comparable between the control (318 ng/mL, SD = 89.8) and dapagliflozin groups (345 ng/mL, SD = 79.6). By the end of the study, the mean ferritin level had decreased to 294 ng/mL (SD = 86.7 ng/mL) in the control group and to 263 ng/mL (SD = 75.4 ng/mL) in the dapagliflozin group. The mean change in ferritin was a decrease of -23.7 ng/mL (SD = 33.7 ng/mL) in the control group and a decrease of -81.9 ng/mL (SD = 45.1 ng/mL) in the dapagliflozin group (Figure S3). These results indicate that treatment with dapagliflozin was associated with a larger decrease in ferritin levels compared to standard care.
Longitudinal effects on hemoglobinA linear mixed-effects model included 191 patients with and without anemia at baseline, who did not develop IDA and did not receive iron or ESA therapy during the 12-month study period (76 in the control group and 115 receiving dapagliflozin). The mean hemoglobin levels over study period are shown in (Table 2).
Table 2 Mean (± SD) Hemoglobin levels over study period in patients who did not develop IDA and did not receive iron or ESA therapy (n = 191)The unadjusted analysis demonstrated a significant interaction between dapagliflozin treatment and time (estimate: 0.168 g/dL per 3-month interval, 95% CI 0.12–0.21, p < 0.001), indicating a greater increase in hemoglobin levels over time in the dapagliflozin group (Table S2). After adjusting for confounders, this interaction remained significant (p < 0.001) (Table 3). At 6 months, the estimated mean hemoglobin difference between groups was 0.64 g/dL (p < 0.001). By the final time point, the mean (± SD) hemoglobin in the dapagliflozin group reached 13.1 ± 1.5 g/dL, compared to a relatively stable 12.1 ± 1.4 g/dL in the control group (Fig. 14). Figure 15 shows the hemoglobin changes over time in the treatment groups stratified by baseline anemia status.
Table 3 Fixed effects results of the adjusted modelFig. 14
Hemoglobin levels at baseline and end of study in the treatment groups. Comparison of hemoglobin levels at baseline and study end in patients who did not develop IDA and did not receive iron or ESA therapy
Fig. 15
Hemoglobin changes over time in the treatment groups and baseline anemia status. Longitudinal hemoglobin changes in the study groups, stratified by baseline anemia status in patients who did not develop IDA and did not receive iron or ESA therapy
Baseline hemoglobin strongly influenced subsequent changes, with higher baseline values associated with greater increases in hemoglobin over time (estimate: 0.714 g/dL per 1 g/dL increase, 95% CI 0.660–0.768, p < 0.001). Similarly, baseline TSAT% and baseline ferritin levels were both positively associated with hemoglobin changes (TSAT% estimate: 0.031 g/dL per 1% increase, 95% CI 0.013–0.048, p < 0.001; ferritin estimate: 0.003 g/dL per 1 ng/mL increase, 95% CI 0.002–0.004, p < 0.001). These findings underscore the importance of iron status and baseline hemoglobin in determining the magnitude of hemoglobin response.
The interactions between sex and time (estimate: − 0.026 g/dL per 3-month interval, 95% CI − 0.071–0.019, p = 0.261) and between sex and treatment group (estimate: − 0.036 g/dL, 95% CI − 0.292–0.219, p = 0.780) were not statistically significant, indicating consistent treatment effects across sexes (Table 3). Figure 16 shows the hemoglobin changes over time in the treatment groups stratified by sex.
Fig. 16
Hemoglobin changes over time in the treatment groups and sexes. Hemoglobin trajectories in male and female patients who did not develop IDA and did not receive iron or ESA therapy
Several other variables, including age, BMI, heart failure, use of RASi, antiplatelets or anticoagulants, H2RA or PPI, and diuretics, were not statistically significant predictors of hemoglobin changes (Table 3). This suggests that the observed differences were primarily driven by treatment group, and baseline iron and hemoglobin parameters, rather than these clinical comorbidities.
These findings underscore that dapagliflozin is associated with a significant and sustained increase in hemoglobin levels over time, especially in patients with higher baseline TSAT%, ferritin, and hemoglobin levels. Differences in treatment effect across time points emphasize the importance of monitoring longitudinal changes.
The detailed results of a linear mixed-effects model with REML estimation to evaluate the longitudinal effects of dapagliflozin on hemoglobin levels compared to the control group in patients who did not develop IDA and did not receive iron or ESA therapy (n = 191) are provided in Supplementary material (Tables S2-S6).
Comments (0)