Chemicals, reagents, and equipment
Nutrient agar media, staph 110 media, cetrimide agar media, and antibiotic disks for amoxicillin (25 µg), cefotaxime (30 µg), vancomycin (30 µg), and imipenem (10 µg) were acquired from (Bio-Analyze Limited). ELISA microplate reader (Bio-Tek), compound microscope (Nikon Japan), SimpliAMP PCR machine (Singapore), Double-beam spectrophotometer (PerkinElmer), 96-well microplate (corning), 6-well plates (corning), L-shaped glass spreader, wire loop, Whatman no. 4 filter paper aluminum foil, glass stirrers, NaOH, pipettes, and sucker were taken from the Department of Pharmacology and Toxicology, UVAS, Lahore.
Experimental design
The study was designed to isolate and identify Staphylococcus aureus (SA) and Pseudomonas aeruginosa (PA) from clinical samples obtained from patients with diabetic foot infections. The minimum selection parameters were, confirmed diabetic (type-I and type-II) patients of either sex, age between 18 and 60 years, have no other major complication except diabetes, have not taken any antibiotic during the past 30 days, willingness to comply with study protocols in the form of informed documented consent, ulcer duration of minimum 2 weeks. The excluded patients were those having not given consent to participate, patients requiring surgical procedure to combat current situation, already using topical antibacterial, pregnant or lactating females, patients taking any immunosuppressants, non-diabetic foot ulcer patients, and already taking any antibiotic either self-administering or prescribed. The antimicrobial susceptibility of the isolates was then evaluated against existing antibiotics, including amoxicillin, cefotaxime, imipenem, and vancomycin, both individually and in combination with apple cider vinegar (ACV). In vitro assays, including disk diffusion and broth dilution methods, were employed to assess the sensitivity patterns and potential synergistic effects between the antibiotics and ACV. The experimental work was carried out at the Postgraduate Laboratory of the Department of Pharmacology and Toxicology, in collaboration with the Quality Operations Laboratory (QOL) at the University of Veterinary and Animal Sciences, Lahore, Pakistan.
Preparation of apple cider vinegar
The apple cider vinegar (ACV) was prepared through an artisanal process, utilizing 5 distinct varieties of apples, e.g., Gacha, kala kulu, red delicious, pink lady, and gajra; abundantly grown in northern part of the country [25]. The acidity of selected varieties of samples was determined by titration with 0.1 N NaOH. The results were expressed as a percentage of acetic acid equivalent.
Patients sample collection
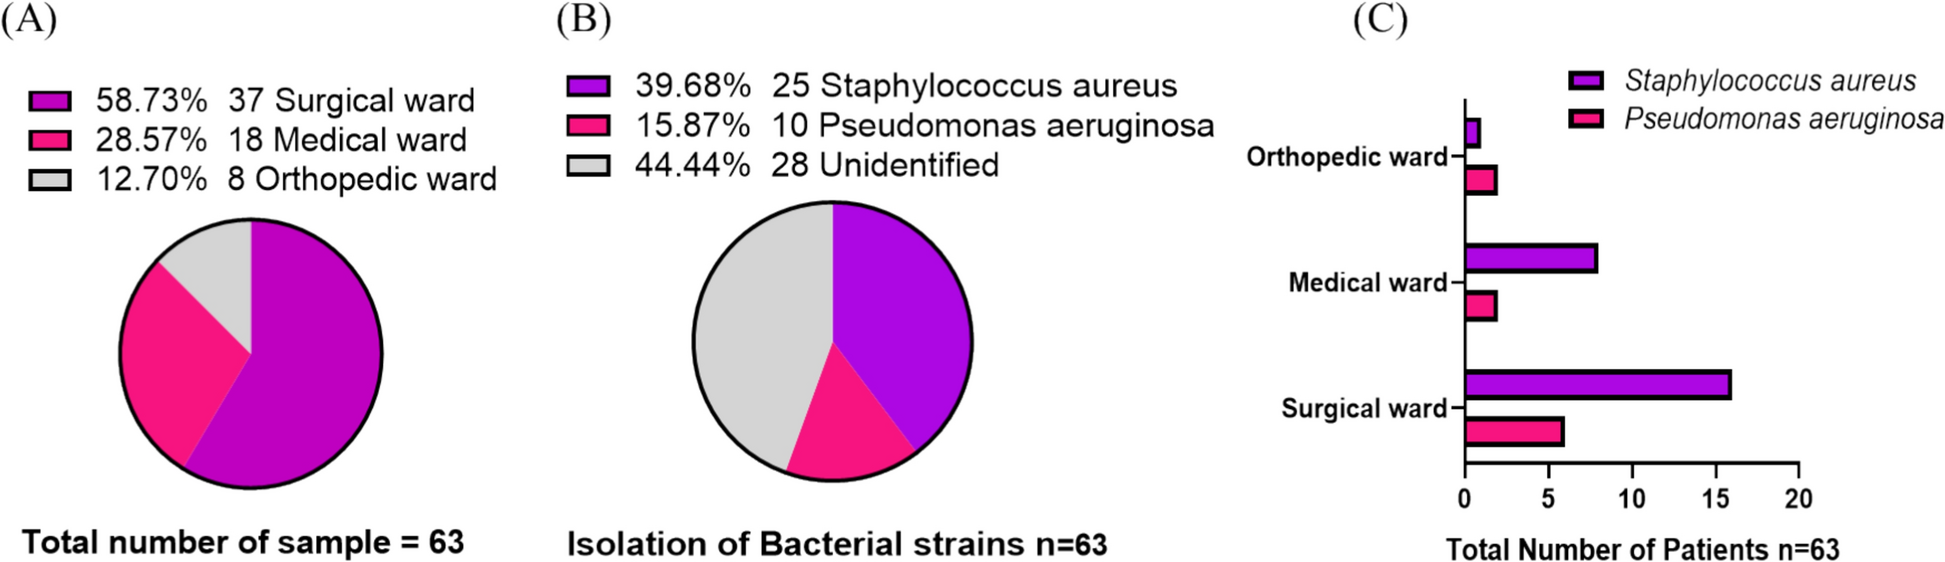
After taking verbal and written informed consent from the patients of different age groups, the pus samples were directly collected with the help of a sterile cotton swab from the infected foot of diabetic patients and labeled accordingly. The minimum selection parameters opted were, confirmed diabetic (type-I and type-II) patients of either sex, age between 18 and 60 years, have no other major complication except diabetes, have not taken any antibiotic during the past 30 days, willingness to comply with study protocols in the form of informed and documented consent, DFI, and ulcer duration of minimum 2 weeks. The excluded patients were those having not given consent to participate, patients requiring surgical procedure to combat current situation, already using topical antibacterial, pregnant or lactating females, patients taking any immunosuppressants, non-diabetic foot ulcer patients, and already taking any antibiotic either self-administering or prescribed. The ethical approval for the said purpose was taken from institutional review board, vide approval letter number (ORIC/IRB/UVAS-JA235773/23) University of Veterinary and Animal Sciences, Lahore. The procedure was done before washing and applying any kind of antiseptic solution or sterile dressing to the patient’s affected area on skin (n = 63). The samples were collected from outpatient department of orthopedic, medical, and surgical wards of Sir Ganga Ram Hospital, Lahore, Pakistan, in accordance with previously described protocols [26, 27].
Streak plate method: isolation and identification of bacterial strain
The collected samples were inoculated separately by streak plate method on nutrient agar media primary culture. The bacterial colonies formed were then taken and separately inoculated on a selective cetrimide agar medium and Staph 110 medium (subculture) and incubated for 24 h at 37 °C. In this way, selective samples of both bacterial species were isolated. In order for the confirmation of isolated samples, gram staining and other biochemical identification tests, e.g., oxidase, catalase, and urease test for PA and catalase, coagulase, and mannitol fermentation test for SA were performed in accordance with the methods described earlier [28, 29].
Antimicrobial assayBacterial culture preparation
After isolation and identification of specific bacterial strains, fresh cultures of pure PA and SA were grown on nutrient agar media containing culture plates by streaking each bacterium separately and subsequently incubated overnight at 37 °C. Single colony from overnight culture were transferred into a 5 mL test tube containing sterile saline solution adjusted to a turbidity equivalent to 0.5 McFarland standard (1.5 × 10⁸ CFU/mL) using spectrophotometer at 600 nm.
Spread plate method
Mueller–Hinton agar (MHA) plates were prepared according to manufacturer instructions. The plates were allowed to solidify in a laminar flow hood prior use. Approximately 100 µl of the standardized bacterial suspension of each strain were separately inoculated and spread evenly on to the surface of each MHA plates. A sterile L-shaped glass spreader was used to evenly distribute the bacterial suspension across the agar surface. During the process, care was taken to ensure uniform coverage of bacterial suspension without damaging the agar surface.
Disk diffusion assay
In order to evaluate extent of microbial sensitivity/resistance against under consideration antibiotics, e.g., amoxicillin, imipenem, cefotaxime, and vancomycin, the antibiotic disk was introduced on to the culture plates and incubated for 24 h at 37 °C. Later, the plates were examined to evaluate antibiotic efficacy by measuring diameter of zones of inhibition using calibrated ruler. The zone of inhibition established against each disk was then compared according to “The Clinical and Laboratory Standards Institute” (CLSI) guidelines [30].
Agar well diffusion assay
The agar gel surface in a culture dish is inoculated by spreading a specified volume of the microbial suspension over the entire surface. Then, a hole of about 6–8 mm in diameter is aseptically punched with a sterile cork borer or a sterile pipette tip. A 100 µl volume of the antimicrobial agent alone or prepared sample of food grade product and antimicrobial agent at (1:1) at desired concentrations was introduced into the corresponding well accordingly. Then, agar plates were incubated for 24 h at 37 °C. Later on, zone of inhibition was measured for each sample with the help of calibrated scale.
Initially, apple cider vinegar at concentration of 5%, 2.5%, 1.25%, and 0.625% was added into the wells already cultured for PA and SA bacterial strains. The zone of inhibition was measured with the help of a scale after 12, 24, and 48 h. Later on, selected concentration of ACV along with antibiotic 512 µg (amoxicillin, vancomycin, imipenem, and cefotaxime) was added into separate wells and incubated for a period of 24 h and 48 h at 37 °C. The zone of inhibition was measured accordingly, marked, and analyzed.
Percentage inhibition of microbial growth
In a 96-well plate, 50 µl of broth was added till 10th column. Thereafter, 50 µl of standard bacterial suspension of turbidity 0.5 McFarland and 100 µl of drug solution having concentrations of 512 µg/mL, 256 µg/mL, and 128 µg/mL, 64 µg/mL, 32 µg/mL, 16 µg/mL, 8 µg/mL, and 4 µg/mL were added into the rows, respectively, till 10th column. In the 11th column, 150 µl of broth and 50 µl of bacterial suspension were added, and in 12th column, only 200 µl of broth was added as a control. The plates were incubated for a period of 48 h. The absorbance was measured at 590 nm wavelength with the help of Bio-Tek microplate reader in accordance with the established protocols. The experiment was repeated with all groups by adding ACV 2.5% such that drug and ACV (1:1).
Fractional inhibitory concentration (FIC) index
The fractional inhibitory concentration index (FIC Index) was measured using checkerboard method. Serially diluted antibiotics were added along abscissa (X-axis) while the second agent, i.e., ACV was diluted and added along the ordinate (Y-axis). The fractional inhibitory concentration (FIC) index for all of the combinations was then determined using the following formula:
$$FIC index = FIC_ + FIC_ = \frac }} + \frac }}$$
(1)
where FICA and FICB are the fractional inhibitory concentration of drugs A and drug B, MICA and MICB are the minimum inhibitory concentration of drugs A and B, whereas symbols [A] and [B] are the concentration of drugs A and B, respectively. A FIC index of < 0.5 was interpreted as synergistic, between 0.5 and 4 was interpreted as additive or indifferent, and a value of > 4 was interpreted as antagonistic.
Minimum bactericidal concentration (MBC)
After determining the percentage inhibition of combined treatment with antibiotic and ACV at required concentrations, the aliquots of 50 μl from dilutions tubes showed that no visible bacterial growth was seeded on nutrient agar plates and incubated for 24 h at 37 °C. The plates showing no bacterial growth were regarded as MBC end point for said combination. The microbial examination was done under an inverted microscope by observing pre-incubated and post-incubated agar plates for the presence or absence of bacterial growth.
Quantitative polymerase chain reaction (PCR) analysis
Bacterial strains were isolated from clinical settings and cultured on appropriate growth media. Genomic DNA was extracted from overnight cultures using the AccuPrep genomic DNA extraction kit; Bioneer, as per the manufacturer’s instructions. DNA concentration and purity were determined using a Nanodrop spectrophotometer (Thermo Scientific) at 260/280 nm. The primers for antibiotic-resistant genes, such as blaZ, β-lactamase gene (S. aureus), mecA Methicillin resistance gene (S. aureus), blaIMP-1, Carbapenemase gene (P. aeruginosa), and OprD, Outer membrane porin gene associated with imipenem resistance (P. aeruginosa), were designed from the National Center for Biotechnology Information (NCBI) database. The internal control used were 16 s rRNA gene because of its universality and presence across large number of bacterial strains. The conditions were initial denaturation temperature 95 °C for 5 min, cycling (denaturation 95 °C, annealing at 55 °C for 30 s, and extension at 72 °C for 30 s) and, finally, curve analysis were performed at 70 °C for 35 cycles. The forward primer sequence designed for evaluation in S. aureus is 5´-AGAGTTTGATCCTGGCTCAGA-3´, and the reverse primer sequence for the internal control gene is 5´-GGTTACCTTGTTACGACTTCG-3´. Whereas primer sequence for P. aeruginosa for forward primer sequence is 5´-TGGCACCCAGCACAATGACGA-3´ and reverse primer sequence arrangement comprises of 5´-CTAGTATAGTCGCTAGAAGCA-3´. The primers were synthesized by Gene Pharma Pvt. Ltd., P.R China.
Primer sequences used are listed in below table.
Microorganism
Target gene
Forward primer
Reverse primer
Staphylococcus aureus and
Pseudomonas aeruginosa
blaZ
5´-ATGAAGAAGCTGATTTTTCTA-3´
5´-CATTTCACTTCGCAAAAGCTT-3´
mecA
5´-ATGAAGAAGATCAAAATTGTT-3´
5´-CAAGATCAAATGGTCCTAGA-3´
OprD
5´-ATGAAGTGATGAAGTGGATGC-3´
5´ GTCGGCGTTGGCACGGTGCTC-3´
blaIMP
5´ TGAGCAAGTTATCTGTATTCG 3´
5´ TAGTTGCTTGGTTTTGATGCA 3´
Internal control
S. aureus
16s rRNA
5´-AGAGTTTGATCCTGGCTCAGA-3´
5´-GGTTACCTTGTTACGACTTCG-3´
Internal control
P. aeruginosa
16s rRNA
5´-TGGCACCCAGCACAATGACGA-3´
5´-CTAGTATAGTCGCTAGAAGCA-3´
Molecular docking analysis
The AutoDock Vina 1.1.2 and AutoDock Tool 1.5.6 (ADT) were utilized to carry out molecular docking analysis. The antibiotic-resistant genes in under consideration bacterial species, e.g., mecA, blaZ, blaIMP-1, and OprD receptor crystal structure (PDB: 1DJA, 5M18, 2ODJ, and 1WUO), respectively, were obtained from the protein data bank. Subsequently, ADT was applied to remove water molecules and remove co-crystallized ligands from the crystal structure. Consequently, Gasteiger charges and polar hydrogens were added, and the resulted receptors were saved in PDBQT format. Energy minimized and 3D of amoxicillin, cefotaxime, imipenem, and vancomycin, acetic acid, chlorogenic acid, and quercetin, were built and documented in Protein Data formatted by applying Chem-Office software.
Statistical analysis
Statistical analysis of the results was performed using one-way ANOVA followed by LSD and Tukey post hoc analysis using SPSS 22 software (SPSS Inc., Chicago, IL, USA) and GraphPad prism version 9.0. The p-values of < 0.05 were considered to be statistically significant.


Comments (0)