Mice
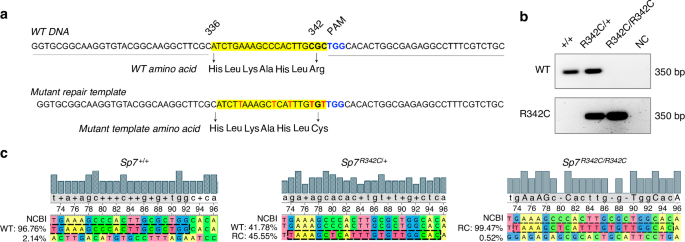
R342C knock-in mice were generated by the CRISPR-mediated in vivo genome editing, i-GONAD,21 using the FvB outbred strain (Charles River Laboratory). Briefly,21,22 at 0.7 day post coitum, the female was anesthetized by continuous inhalation of isoflurane. Through a 1 cm long skin incision, a 0.5 cm incision of each side was made to the muscle layer to access the abdominal cavity. The fat pad attached to the ovary was identified and pulled outside of the body to expose the oviduct. 1.5 μL of CRISPR solution containing 1 μg/μL of Cas9 (PNA Bio) premixed with 10 mmol/L two-piece guide RNA (crRNA and tracrRNA) (IDT) with or without 1 μg/μL of a single strand DNA repair template, was injected into the oviduct either by puncturing or through the infundibulum. Then, in vivo electroporation was performed using the square pulse generator, BTX-820 with the electrode tweezers, CUY652P2.5×4 (Nepa Gene, Japan) with the setting of 50 V, 5 msec each pulse, 8 pulses, with a 0.5 cm electrode gap. After suturing the muscle layer and skin, the pregnant mother was returned to the cage. Pups were genotyped for desired modifications, then mated with FvB wild type mice to establish the F1 lines. Heterozygous F3 mice were intercrossed to generate homozygotes. The WT and repair template sequences are shown in Fig. 1a. At position 342, the codon for the mutant repair template was changed to TGT, which encodes cysteine. The remaining silent mutations in the repair template were introduced to limit further genome editing once initial recombination occurred. We also designed a ‘wild type’ repair template with only silent mutations to prevent deleterious editing of the non-targeted allele; however, germline transmission of this sequence was not observed. crRNA sequence is listed in Table S1. Genotypes were determined by PCR using primers listed in Table S1. All the experimental mice generated and used were after F3 crosses. Littermate controls were used for studies. Since humans with SP7 R316C mutations present with skeletal disease when this mutation is present in the homozygous state, analysis of mice here focused on comparisons between wild type and homozygous mutant mice. Both males and females were included in this study. All procedures involving animals were performed in accordance with guidelines issued by the Institutional Animal Care and Use Committees (IACUC) in the Animal Resource Center at University of Texas Southwestern Medical Center and the Center for Comparative Medicine at Massachusetts General Hospital under approved Animal Use Protocols (2024103714, 2019N000201). All animals were housed in the Animal Resource Center at University of Texas Southwestern Medical Center and the Center for Comparative Medicine at Massachusetts General Hospital (21.9 °C ± 0.8 °C, 45% ± 15% humidity, and 12-h light cycle 7 am–7 pm). For OPG-Fc treatment, 6-week-old Sp7R342C/R342C and Sp7+/+ female mice were injected with either PBS or OPG-Fc (1 mg/mouse) once per week for 4 weeks by intraperitoneal injection.31 Mice were dissected at 10 weeks old for tissue collection.
Micro-computed tomography (µCT)
Femurs were harvested from 8-week-old and 10-week-old mice after being fixed with 10% neutral buffered formalin for 1 day and stored in 70% ethanol. µCT imaging was performed on a bench-top scanner (µCT 40, Scanco Medical AG, Brüttisellen, Switzerland) to measure the trabecular and cortical bone architecture and mineral density of the femoral distal metaphysis and mid-diaphysis, respectively. Scans were acquired with 10 μm isotropic voxels, 70 kVp peak x-ray tube potential, 114 mA intensity, and 200 ms integration time. Trabecular bone was analyzed in the endocortical region of the distal metaphysis beginning 200 µm superior to the distal growth plate and extending 1.5 mm (150 transverse slices) proximally. The bone within the trabecular region of interest was segmented using a threshold of 390 mgHA/cm3 and analyzed using the Scanco IPLV6 Trabecular Bone analysis script. Trabecular architecture outcomes included trabecular bone volume fraction (Tb.BV/TV,%), trabecular bone mineral density (Tb.BMD, mgHA/cm3), trabecular thickness (Tb.Th, mm), trabecular number (Tb.N, mm-1), trabecular separation (Tb.Sp, mm), connectivity density (ConnD, mm-3), Cortical architecture was analyzed in a 500 μm long region (50 transverse slices) of the mid-diaphysis. The bone within the cortical region of interest was segmented using a threshold of 700 mgHA/cm3 and the geometry of the cortex analyzed using the Scanco Midshaft Evaluation script. Cortical architecture outcomes included total area (Tt.Ar, mm2), cortical bone area (Ct.Ar, mm2), medullary area (Ma.Ar, mm2), cortical bone area fraction (Ct.Ar/Tt.Ar, %), cortical tissue mineral density (Ct.TMD, mgHA/cm3), cortical thickness (Ct.Th, mm), cortical porosity (%), as well as the maximum, minimum and polar moments of inertia (Imax, Imin, and pMOI, mm4), which describe the shape and distribution of cortical bone (larger moments of inertias generally indicate greater rigidity). Cortical porosity was measured as the total area of pores in the cortex (pore area = cortex area – Ct.Ar) divided by the total area of the cortex [cortical porosity/% = (pore area/cortex area) × 100)].
Three-point bending test
Femurs from 10-week-old female mice were collected and were mechanically tested in three-point bending using an electrical-force material testing machine (Electroforce 3230, Bose Corporation, Eden Prairie, MN). Femurs were wrapped in saline soaked gauze and store at −20 °C from the time of harvest to testing. Prior to testing, µCT analysis was performed to measure the mid-diaphysis geometry of the femurs using the same methods described in the previous µCT section. The bending fixture had a bottom span length of 8 mm. The test was performed with the load point in displacement control moving at a rate of 0.1 mm/s with force and displacement data collected at 60 Hz. All the bones were positioned in the same orientation during testing with the cranial surface resting on the supports and being loaded in tension. Bending rigidity (EI, N-mm2), apparent modulus of elasticity (Eapp, MPa), ultimate moment (Mult, N-mm), apparent ultimate stress (σapp, MPa), work to yield and fracture (W, mJ), post-yield displacement (mm), and apparent toughness (Uapp, mJ/mm3) were calculated based on the force and displacement data from the tests and the mid-shaft geometry measured with µCT. The minimum moment of inertia (Imin) and bone radius perpendicular to Imin (Cmin) were measured with µCT and were used when calculating the apparent material properties. Work to yield and fracture are the energies required to cause the femur to yield and fracture, respectively, and were calculated by finding the area under the force-displacement curve using the Riemann Sum method. Yield was determined by finding the intersection of the load-displacement curve and a regression line with a 10% lower slope than the linear portion of the force-displacement curve.40 Bending rigidity was calculated using the linear portion of the force-displacement curve.
Histology and histomorphometry
Formalin-fixed paraffin-embedded decalcified tibia sections from 8-week-old and 10-week-old mice were obtained. Hematoxylin and eosin staining were performed using standard protocols. Briefly, sections were deparaffinized and rehydrated. Sections were then stained with Tacha’s CAT Hematoxylin (Biocare Medical) for 1 min followed by washing. Finally, sections were counterstained in Alcoholic-Eosin (1% eosin y, 1% phloxine B, 95% ethanol, glacial acetic acid) for 1 min and followed by dehydration.
Right femurs from 8-week-old female mice have been subjected to bone histomorphometric analysis (calcein and demeclocycline labeling). All mice received intraperitoneal calcein (Sigma-Aldrich, 20 mg/kg) and demeclocycline (Sigma-Aldrich, 40 mg/kg) injections at 7 days and 2 days prior to sacrifice. The tibia was dissected and fixed in 70% ethanol for 3 days. Fixed bones were dehydrated in graded ethanol, then infiltrated and embedded in methyl methacrylate without demineralization. Undecalcified 5 μm longitudinal sections were obtained using a microtome (Leica Biosystems, RM2255). Histomorphometry analyses were performed according to the criteria established by the American Society of Bone and Mineral Research.41 Trabecular static, structural, and dynamic parameters were measured in the distal femoral metaphysis, 0.2 mm below the epiphyseal growth plate, using an Osteomeasure image analyzer (Osteometrics). All analyses were performed in a blinded fashion. Digital images were obtained via fluorescent microscopy. Standard Masson’s trichrome staining was performed to discriminate between calcified and uncalcified bone and cartilage in sections.
Silver staining and phalloidin staining
As described previously,13,42 paraffin-embedded mouse tibia sections were deparaffinized and incubated in two parts, 50% silver nitrate and one part 1% formic acid in 2% gelatin solution for 55 min. Stained slides were then washed in 5% sodium thiosulfate for 10 min and subsequently dehydrated, cleared, and mounted. Stained slides were first scanned with Nanozoomer to capture the entire stained section. 4 images were taken at 40x within the medial tibia cortex. Quantification of the canaliculi number per cell were performed with ImageJ by thresholding grayscale images for dark, silver-stained lacunae and canaliculi.
Tibiae were submerged in 30% sucrose, and embedded in O.C.T. Compound (Fisher HealthCare), and cryo-sectioned. For 10 μm tibia cryosections, slides were first washed in cold PBS for 5 min, fixed with 4% PFA (Thermo Scientific) in PBS for 10 min and permeabilized with 0.05% Saponin (Thermo Scientific) in PBS for 5 min. Sections were then incubated with phalloidin mixture (1:1 000, Abcam) in the dark for 1 h at room temperature. Sections were washed with cold PBS three times before being stained with DAPI (1:1 000, Invitrogen) for 15 min, mounted with Fluoromount-G (Invitrogen) and imaged by confocal microscopy. 3 images per sample were taken within the medial cortex of the tibia. Quantification of osteocyte filament density was performed in ImageJ imaging software on a blinded basis. First, cell bodies were cropped, and then multi-color images were converted to single-channel (grayscale) color images. Each image was duplicated, and a binary image was created from the copied image. In the copied image, all dendrites were highlighted, and the background was subtracted. Next, we used “Analyze – Set Measurements” and set “Redirect to” to the original grayscale image, followed by selecting the “Area” and “Mean Gray Value” functions. Finally, the “Analyze – Analyze Particles” function was used to quantify the filament density.
Fluorescent imaging of the lacunae canalicular network in 3D
Femurs (n = 5-6 per group) clean free of the periosteum and muscle was fixed with 10% neutral buffered formalin (NBF), decalcified in EDTA, and processed for cryosectioning as previously described.42 Briefly, decalcified bones underwent a series of sucrose gradient solutions (15%, 20%, 30%) followed by O.C.T. embedding. A cryostat was used to obtain 50 µm thick axial sections of the mid-cortical femurs and stained for the osteocyte cell membrane with hydrophobic lipophilic membrane dye 1,1’-dioctadecyl-3,3,3’,3’-tetramethylindocarboxyanine percholate (DiI) (Invitrogen), actin cytoskeleton with Alexa Fluor 488 phalloidin (Invitrogen), and nuclei with DAPI as previously described.27,42,43,44 Briefly, cryosections in a 48 well plate were rinsed in PBS to remove the O.C.T. media and blocked with blocking buffer (1% normal donkey serum in 1% bovine serum albumin in PBS) overnight, incubated in 100 μmol/L of DiI in 50% DMSO/50% PBS for 1 week, followed by 165 nmol/L phalloidin in blocking buffer incubation overnight, and lastly with DAPI for 30 min at room temperature. Stained sections were cleared with 2,2’-thiodiethanol (TDE) gradient solutions (10%, 25%, 50%, 95%), mounted with 97% TDE under a number 1 coverslip and edges sealed with toluene/formaldehyde free nail polish. Stained sections (3 sections per mouse) were imaged using a Lecia DMi8 (Leica Microsystems) inverted confocal microscope utilizing LAS X software.
Quantification of dendrite tortuosity, dendrite spacing, and the lacunar-canalicular network (LCN) volume fraction in 3D was previously described45 using Fiji/ImageJ46 software plugins: BoneJ47 and Simple Neurite Tracer on 3D reconstruction of Z-stack 100x images stacks with 115–120 slices of the anterior/posterior region of the cortical femur transverse section. For dendrite tortuosity, the Simple Neurite Tracer generated the shortest pathway between two osteocytes as a path length. For dendrite spacing and LCN volume fraction, images were converted to 8-bit binary prior to quantification. BoneJ plugin was used to obtain ‘Thickness’ outcome for canalicular spacing and ‘Area/Volume Fraction’ outcome for the LCN volume fraction quantification. For quantification of osteocyte number, 40x images of the anterior/posterior region of the cortical femur transverse section were used to manually count the osteocytes using the Cell Counter plugin. The bone area was obtained and used to calculate the number of osteocytes per bone area for each sample.
Quantitative averages represent data collected from 3 technical replicates per mouse for 5–6 mice per group. Statistical comparison was calculated by unpaired two-tailed Student’s t test with Welch’s correction using Prism 10 (GraphPad Software Inc). Statistically significant is considered when P-value < 0.05 and values are shown as mean ± standard deviation.
TUNEL staining
Formalin-fixed paraffin-embedded decalcified tibia sections from 8-week-old mice were obtained. For Terminal deoxynucleotidyl transferase dUTP nick end labeling (TUNEL), sections were fixed with 4% paraformaldehyde (PFA) (Pierce) in PBS for 15 min at room temperature and permeabilized with PCR grade recombinant Proteinase K (Roche Applied Science) for 30 min at 37 °C. Apoptotic cells were examined with Roche in situ cell death detection kit (Roche Applied Science) according to instructions and followed by 4′,6-diamidino-2-phenylindole (DAPI; Invitrogen) for fluorescent microscopy. 3 images per sample were taken within the medial cortex of the tibia.
RNAscope
Formalin-fixed paraffin-embedded decalcified tibia sections (10 μm) from 8-week-old and 10-week-old mice were obtained. Bone sections were processed for RNA in situ detection using RNAscope 2.5 HD Assay-Brown (Chromogenic) according to the manufacturer’s instructions (Advanced Cell Diagnostics). For antigen retrieval, bone sections were pretreated with hydrogen peroxide and pepsin (1 h at 40 °C, Sigma-Aldrich). Tissue sections were hybridized with target probes (2 h at 40 °C), amplified (Amp1–4: 40 °C; Amp 5–6: room temperature) and chromogenic detected using DAB followed by counterstaining with hematoxylin (Millipore Sigma). RNAscope probes used were: Tsfnf11 (NM_011613.3, REGION 314-1310), Cd109 (NM_153098.3, region 632-1684) and Fbln7 (NM_024237.4, region 198–1595). For the quantification of Tnfsf11-, Cd109- and Fbln7-positive osteocytes, 3 representative images were picked from the medial side of the cortical bone (3 mm below the growth plate) per mouse.
TRAP staining
10 μm sections were first incubated in 0.2 mol/L acetate buffer (pH 5.0), then stained in the solution containing Naphthol AS-MX Phosphate (0.5 mg/mL; Sigma-Aldrich) and Fast Red TR Salt (1.1 mg/mL; Sigma-Aldrich) in 0.2 mol/L acetate buffer, and counterstained in Fast Green (Thermo Scientific Chemicals). The number of TRAP+ multinucleated osteoclasts within cortical bone was measured based on H&E and TRAP staining in serial sections. TRAP+ multinucleated cells were enumerated, and no acellular cement line or periosteal TRAP signals were quantified. Bone area was quantified with Image J. Measurement was set (Analyze > Set Measurements) and “Area” was selected. 3 images per sample were taken within the medial cortex of the tibia.
Western blot
Whole-cell lysates were prepared using TNT (Tris-NaCl-Tween buffer, 20 mmol/L Tris-HCl pH = 8, 200 mmol/L NaCl, 0.5% Triton X-100 containing protease inhibitor (PI), 1 mmol/L NaF, 1 mmol/L DTT, 1 mmol/L vanadate). Adherent cells were washed with ice-cold phosphate-buffered saline (PBS), then scraped into TNT buffer on ice. The material was then transferred into Eppendorf tubes kept on ice, vortexed at top speed for 30 s, then centrifuged at top speed for 6 min at 4 °C. For immunoblotting, lysates were separated by sodium dodecyl sulphate–polyacrylamide gel electrophoresis, and proteins were transferred to nitrocellulose. Membranes were blocked with 5% dry milk blocker in tris-buffered saline plus 0.05% Tween-20 (TBST) and incubated with primary antibody overnight at 4 °C diluted in TBST plus 5% bovine serum albumin (BSA). The next day, membranes were washed, incubated with appropriate HRP-coupled secondary antibodies (Anti-rabbit IgG HRP-linked, Cell Signaling Technology, 1:2 000), and signals were detected with ECL Western Blotting Substrate (Pierce) or ECL Plus Western Blotting Substrate (Pierce). The primary antibodies were Sp7 (Abcam, dilution 1:1 000) and GAPDH (Cell Signaling Technology, dilution 1:1 000).
ELISA
All serum measurement was performed using commercial bioassay detection reagents (IDS: P1NP, CTX-1, phosphate, PTH and calcium).
RNA isolation and qRT-PCR
Right humerus was collected from 10-week-old mice. Muscle was carefully removed from the bone. Both ends of the humerus was cut to remove the trabecular bone. Bone marrow was flushed out and only the clean cortical bone was kept for RNA extraction. RNA was extracted by tissue blender with TRIzol (Invitrogen)/Chloroform based method, and further purification was performed with PureLink RNA mini column. cDNA was prepared with 1 µg RNA and synthesized using the PrimeScript RT Reagent Kit (TaKaRa). qPCR assays were performed on the StepOnePlus Real-time PCR System (Applied Biosystems) using PerfeCTa SYBR Green FastMix ROX (Quanta bio). β-actin was used as the internal control for normalization. The 2−ΔΔCt method was used to detect expression fold change for each target gene with three biological replicates.
RNA-seq analysis
Bone RNA samples were measured with High Sensitivity RNA ScreenTape analysis (Agilent). High quality RNA samples with RIN > 7 (n = 6) were processed for RNA library construction and sequencing using the Novoseq6000 platform (Novogene). Raw sequencing data were performed with quality control using FastQC/0.11.5. Transcripts were quantified using Salmon.48 Salmon index for mouse was generated based on the Ensembl fasta file for GRCm38. Differential expression analysis was performed using DESeq249 package based on the criteria of false discovery rates (FDR) < 0.05 and log2|FC | ≥ 1. Analysis of gene ontology enrichment was performed using Enrichr on differentially expressed genes (https://amp.pharm.mssm.edu/Enrichr/)50 and the volcano plot was made using GraphPad Prism 9.
BMSC differentiation
Culture and differentiation of bone marrow stromal cells (BMSCs) from mice were performed using standard protocols.51 Long bones were collected from 8-week-old mice. Briefly, small cuts were made at both the proximal and distal ends of the long bones (tibia and femur) before placing them in the sectioned tips within the centrifuge tubes. The marrow was collected at the bottom of the 1.5 mL tube by centrifuging at 10 000 × g for 15 s at room temperature. Cell pellets were suspended in 10 mL of BMSC culture media per mouse and filtered through the 70 μm filter. Cells were calculated and plated at 106 cells/mL in 24-well plates (alizarin red staining) and 96-well plates (alkaline phosphatase staining, Sigma-Aldrich, SCR004). Cells were cultured at 37 °C until they reached 80%–100% confluency. BMSCs were differentiated by adding mineralization medium (50 μg/mL of L-ascorbic acid and 10 mmol/L beta-glycerophosphate). For staining and western blot, cells were analyzed after differentiated for 0, 7, 14 and 21 days.
Alizarin red staining and alkaline phosphatase staining
For alizarin red staining, cells were fixed with ice-cold 70% ethanol for 1 h and stained with alizarin red stock solution (1% alizarin red in H2O, pH = 4.2) for 10 min (room temperature, rotation). For alizarin red staining quantification, cells were de-stain with 10% CPC for 15 min with rotation at room temperature. 200 μL of supernatant was transferred to 96-well plates and read at 562 nm. Alkaline phosphatase staining was performed following the manufactural protocol (Sigma-Aldrich). Alkaline phosphatase staining intensity was quantified with Image J. Images were first converted to 8-bit. Threshold was then set to the same for all images (Image > Adjust > Threshold > Apply). Measurement was set (Analyze > Set Measurements) and redirected to the 8-bit images. The relative intensity (%) was normalized to the total area and quantified (Analyze > Analyze Particles).
Quantification and statistical analysis
All results are represented as mean ± SD for the indicated number of observations. Statistical details have been provided in the figures and figure legends. Differences between two groups were tested with two-tailed paired and unpaired Student’s t tests (GraphPad Prism 9). When more than two experimental groups were present, ANOVA analysis followed by post hoc Tukey–Kramer test was performed (GraphPad Prism 9). N represents mice or cell numbers as indicated for each experiment. A P < 0.05 was considered to be statistically significant.

Comments (0)