Sample
Data were drawn from the Healthy Life in an Urban Setting (HELIUS) study, a largescale and multi-ethnic prospective cohort study conducted in Amsterdam, the Netherlands [20, 32, for more details on the HELIUS study]. Baseline data collection took place from January 2011 to December 2015 [32]. The HELIUS study examined mental and physical health differences among individuals of the largest ethnic groups living in Amsterdam (i.e., Dutch, Surinamese, Ghanaian, Turkish, and Moroccan origin). Of the total 24,789 invited HELIUS participants, we included 23,941 individuals who filled in the questionnaires. From these, we excluded three ethnic groups due to their low sample sizes: the Javanese Surinamese (N = 250), the Other/Unknown Surinamese (N = 286), and the Other/Unknown ethnicity (N = 50). This resulted in a total sample of N = 22,164 individuals with an age range of 18 and 73 years. Of the migrants, 75.77% were first-generation migrants and 24.23% second-generation migrants. Importantly, for the network estimation, we only included individuals who consumed alcohol in the past year. Thus, our final network sample included 10,877 participants: N = 5487 males (specifically, Dutch N = 1946, South-Asian Surinamese N = 976, African Surinamese N = 1316, Ghanaians N = 460, Turks N = 575, Moroccans N = 214) and N = 5390 females (specifically, Dutch N = 2158, South-Asian Surinamese N = 776, African Surinamese N = 1520, Ghanaians N = 576, Turks N = 276, Moroccans N = 93). The sample of drinkers ranged between 18 and 71 years of age and of the migrants that were drinking, 75.40% were first-generation migrants and 24.60% second-generation migrants.
Measures
Alcohol consumption. Participants indicated whether they consumed alcohol in the past 12 months with a binary ‘yes’ or ‘no’ self-report question.
Alcohol Use Disorder symptoms. Alcohol Use Disorder (AUD) symptoms were measured using the Alcohol Use Disorders Identification Test [AUDIT-10; 1]. The AUDIT was developed by the World Health Organization to measure alcohol use problems, through 10 questions with a varying number of categories ranging from three to six [5]. The first question assesses whether participants ‘never drank before’ or ‘had no drinks in the past 12 months’, in which case no further questions are asked. We included the items: binge drinking, unable to stop drinking, unable to engage in normal activities, need drink in the morning, felt guilty due to drinking, unable to retrieve last night, injury due to drinking, and others concerned about drinking.
Ethnicity. Following established protocols [11], a participant was deemed as being of non-Dutch ethnic origin if either of the following two conditions were met: (1) the participant was born outside the Netherlands and at least one of their parents was also born outside the Netherlands (i.e., first-generation migrants); (2) the participant was born inside the Netherlands but both of their parents were born outside the Netherlands (i.e., offspring).
Age and sex. Age (in years) and sex (male or female) were retrieved from the municipal registry during the data collection period.
Sociodemographic determinants
Employment status. Employment status was categorized as ‘incapacitated/impaired’, ‘unemployed’, ‘not in the labor force’, and ‘employed’.
Educational level. Educational level was measured by self-reported highest educational level in four categories: ‘no or elementary education,’ ‘secondary education,’ intermediate/higher education,’ and ‘higher vocational’.
Perceived ethnic discrimination. Perceived Ethnic Discrimination (PED) was captured through the Everyday Discrimination Scale [EDS; 17]. The EDS employs nine items, measured on a five-point Likert scale, ranging from ‘never’ (1) to ‘very often’ (5). The HELIUS study adapted the EDS to reflect discriminatory experiences because of one’s ethnic background [34]. The nine items were aggregated into a sum score.
Religion. Religious practices were assessed using a single, binary question measuring whether participants currently ‘practiced a particular religion’.
Statistical analysis.
Our code, additional results, and supplementary materials are available at: https://osf.io/jse97/. Our data were analyzed using the statistical software R [49].
Bayesian predictive modeling
Using Bayesian logistic regression, we examined the unique effects of our sociodemographic factors on past-year alcohol consumption. Bayesian model averaging was used to account for potential model uncertainty [4], using the BIC criterion as a proxy for the Bayes factor. All sociodemographic variables were considered predictors of past 12 months alcohol use, with equal prior model inclusion probabilities (i.e., prior probablity of 0.5). The posterior model probabilities, inclusion probabilities, and model-averaged means of each predictor were extracted. These analyses were conducted using the BMA package [48].
Bayesian estimation of symptom networks
Data preprocessing. To accommodate our network analyses, we performed three data pre-processing steps. First, approximately 49% of individuals who responded ‘never had a drink’ or ‘did not drink in the past 12 months’ were excluded from the analysis because they had missing values for all AUD symptoms. As a sensitivity analysis, we repeated our network analyzes with imputed values for these non-drinkers and report these results in our online supplement (see Supplemental Figure S1). Second, the first (frequency of alcohol consumption), second (amount of alcohol consumed), and third (frequency of consuming more than six drinks; binge drinking) items of the AUDIT scale were conceptually similar and highly correlated. To avoid biasing our network structures with highly correlated items [47], we excluded the first two items and included only the latter (i.e., binge drinking) for two reasons: first, it was the most severe indicator of alcohol frequency; second, it was the most similar to other AUD symptoms in our networks (both psychologically in terms of maladaptivity and psychometrically in terms of response scale; see Table S1). Finally, we handled missing values via listwise deletion.
Bayesian analysis of networks. Using psychometric network analysis [44, 47], we then examined the interplay among the alcohol use symptoms and our sociodemographic factors; in particular: age, employment, education, religion, and perceived ethnic discrimination. Psychometric networks comprise nodes that represent our variables of interest and edges that represent their associations. In particular, a present edge indicates conditional dependence between variables (i.e., the two variables are associated even after controlling for all other variables in the network), while absent edges indicate conditional independence (i.e., the edges share no association after controlling for all other variables). We conducted a network analysis both at the population level to examine general trends and stratified for sex and ethnicity to examine sex- and ethnic-specific effects.
Notably, we conducted our network analyses within a Bayesian framework to adequately quantify the uncertainty in the networks [46].Footnote 1 Most prominently, the Bayesian approach allows obtaining evidence for the inclusion and exclusion of edges. To accommodate our mixed data (i.e., categorical and continuous variables), we estimated a Gaussian copula Graphical model [GCGM; 14], through the BDgraph R-package [39]. BDgraph implements a Bayesian structure learning approach with a reversible-jump Markov Chain Monte Carlo method [22]. To leverage the Bayesian benefits, one needs to specify their beliefs in the model (e.g., network density) and the parameters (e.g., the strength of network edges) before having seen the data: the prior [26, 36]. We adopted the default prior specifications with an edge inclusion probability of 0.5 and three degrees of freedom for the G-Wishart distribution [42].
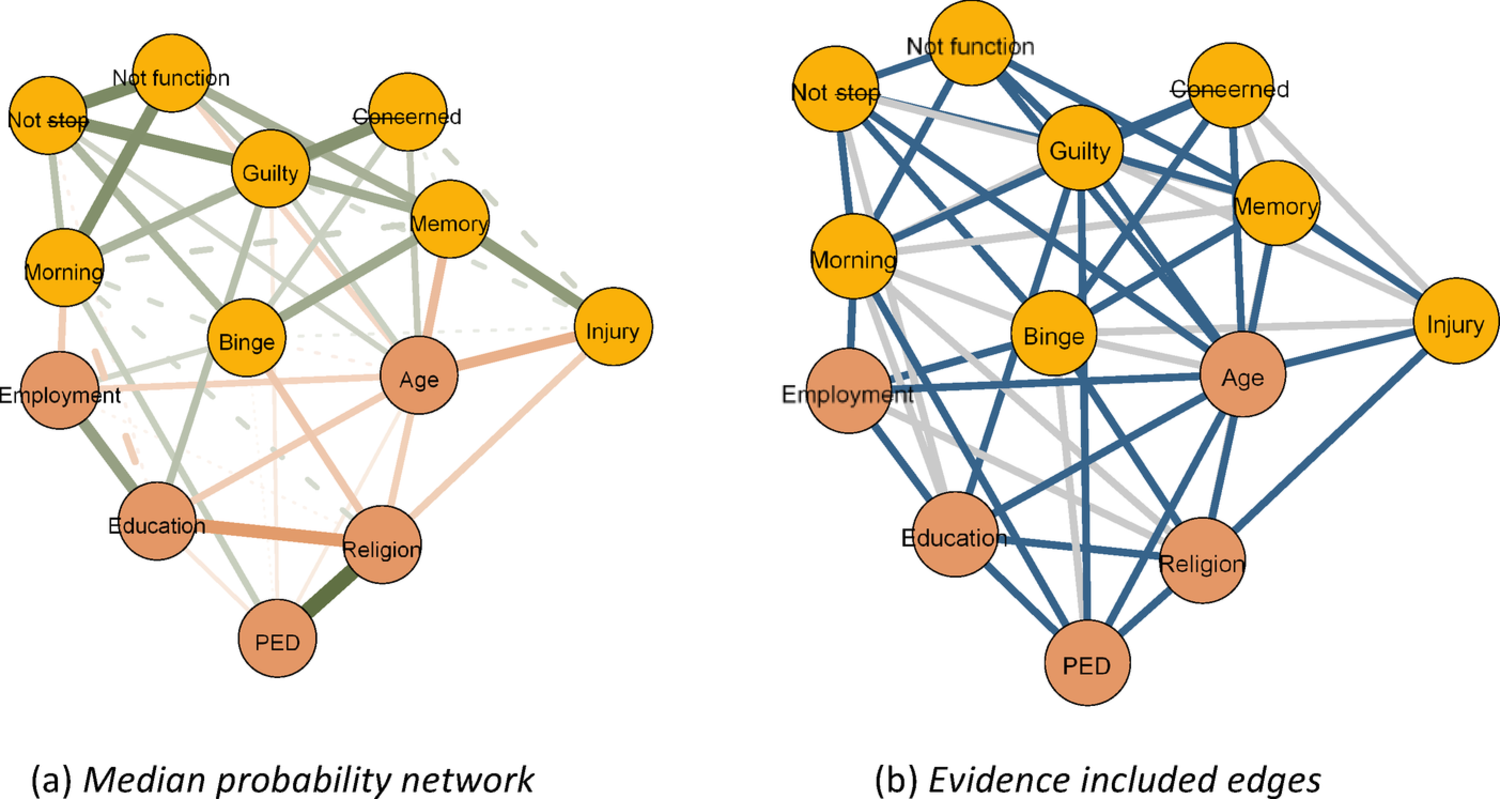
This analysis yielded three types of undirected networks, visualized using the qgraph package [18]. The first type was the one described previously, in which edges depict the conditional associations among our variables. In the second type, edges indicated evidence for edge presence.The evidence was quantified using the Bayes Factor. A Bayes factor is a measure used to compare how well two competing explanations or hypotheses explain the observed data, indicating which explanation is more strongly supported by the evidence [2].
Concerning networks, the Bayes factor is used to compare the evidence for edge presence against the evidence for edge absence [46]. For our illustrated networks blue edges indicated strong evidence for edge presence with a Bayes factor greater than 10. In the third network type, the edges indicate evidence for edge absence, with red edges indicating a Bayes factor lower than 1/10 which is indicative of strong evidence for edge exclusion. Examining our first network type provides insight into the interplay of sociodemographic factors and alcohol use symptoms. Examining the latter two, however, presents a substantial advancement of previous frequentist network analyses, as it allows us to conclude the evidence for edge presence and importantly edge absence [46].


Comments (0)