Study sample
The HRS is a nationally representative, longitudinal panel study in the US, created to gather extensive health and behavioral information for individuals aged 50 years and older. Surveys are collected from approximately 20,000 participants every two years and a new cohort is included every six years [28]. Out of 15,190 randomly selected HRS participants chosen for additional in-person visits to provide genotype data, 6,977 European Americans provided outcome data on depressive symptoms during at least one wave between 2006 and 2016. The documentation report for the HRS data highly recommends that users perform analyses separately by ancestral group. We present findings only from the HRS European ancestry sample (N = 6,977; mean age in 2006 = 62.4 ± 14.3; age range 26–101 years; 57% female). The PGS in the present study is computed based on GWAS results primarily among individuals of European ancestry. This results in weaker predictive power in PGS derived from non-European populations due to variations in allele frequencies, linkage disequilibrium, and overall genetic structure across different ethnic groups [29,30,31]. Although we initially included African American participants, limited predictive accuracy and transferability of their PGS led to their exclusion. The study was deemed exempt by the Pennsylvania State University Institutional Review Board because the data were de-identified.
Of the 6,977 European Americans, the variables had low missingness (< 3%), except for maternal warmth (20%), parental education (12%), childhood stress events (11%), and CES-D measures (12–31%). For all missing covariates, we conducted multiple imputations (n = 5) using chained equations, a flexible method that also addresses attrition-related issues [32, 33]. This method tends to be more flexible than other methods for handling missing data and helps address problems associated with attrition [34, 35]. To enhance the precision of the imputation, we expanded the set of imputation variables to include socioeconomic indicators (e.g., total income, wealth, marital status), survey weight-related variables (e.g., sampling weights, stratification variables, respondent weights), and the complete set of 58 precomputed genetic risk scores, in addition to the primary study variables. We imputed data with the MICE package in R (version 4.4.2) and combined results using the MITOOL package in R [36].
MeasuresDepressive symptoms
Depressive symptoms were assessed using a modified eight-item Center for Epidemiologic Studies Depression Scale (CES-D) [37] every two years from 2006 to 2016. This self-report measure can identify individuals at a heightened risk for developing depression and has comparable psychometric properties to the twenty-item CES-D [37]. The CES-D score is the sum of six “negative” indicators minus two “positive” indicators. The negative indicators assessed whether participants experienced sentiments related to depression (e.g., “felt alone”), and the positive indicators asked whether the respondents “felt happy” or “enjoyed life”, all or most of the time over the previous week. After reverse scoring the positive indicators, the total possible score ranges from 0 to 8, with higher scores indicating more severe symptoms. In the HRS, the 8-item version of CES-D has high internal consistency (Cronbach α = 0.81–0.83), with sensitivity and specificity of 0.71 and 0.79, respectively [38]. For analyses investigating time-varying genetic effects on CES-D score, we used continuous variables. For the interaction analyses, we categorized the CES-D score (range: 0–8) into a binary variable to facilitate a clinically significant interpretation of the gene x environment. Consistent with prior HRS studies that examined CES-D [39], we employed a threshold of 3 or higher to denote clinically meaningful depressive symptoms, corresponding with the recommended cut-off value of 16 from the original CES-D scale [40].
Polygenic risk for major depressive disorder
The PGS of Major Depressive Disorder (MDD) was computed by the HRS team using PRSice software and summary statistics from the 2018 Psychiatric Genomics Consortium genome-wide association study of major depressive disorder [10]. PRSice calculates polygenic scores using a clumping and thresholding method, which reduces redundancy among genetic variants and tests multiple significance thresholds to find the most predictive score [41]. The PGS of MDD contains 1,340,536 single-nucleotide polymorphisms that overlap between the HRS genetic database and the GWAS meta-analysis [10]. The HRS PGSs have been normalized within European ancestry to conform to a standard normal curve [42]. This PGS of MDD was examined as a binary variable in the main text for enhanced interpretability in interaction analyses. Individuals in the upper 25th percentile of PGS of MDD were grouped as ‘high’ genetic risk, and all others were grouped as ‘low to moderate’ genetic risk for developing depressive symptoms.
Early psychosocial factors
We reviewed all early-life psychosocial measures available in the Harmonized HRS (Version C, 1992–2019, January 2022 release), a data set designed to promote methodological consistency across international HRS-sister studies (e.g., ELSA, SHARE, KLoSA). To support potential cross-national comparisons, we selected the Harmonized HRS over the RAND HRS and identified four key variables assessed in 2006 for inclusion: (1) maternal warmth, (2) perceived financial status, (3) number of childhood stress events, and (4) parental education. These four early psychosocial factors were each examined as binary variables for enhanced interpretability of interaction analyses.
1)
Maternal warmth was dichotomized as low vs. moderate/high. This variable was calculated by summing the following three components: “how much the respondent agrees that they had a good relationship with their mother before age 18” (1 [strongly disagree] to 5 [strongly agree]), “how much time and attention the respondent’s mother gave them when they needed it before age 18” (1 [not at all] to 4 [a lot]), and “how much effort the respondent’s mother put into watching over and making sure the respondent had a good upbringing before age 18” (1 [not at all] to 4 [a lot]). The HRS team transformed the first item’s 5-point scale into a 4-point scale by placing the neutral response at 2.5 and adjusting the remaining responses so 1 indicated the most positive and 4 the most negative. A maternal warmth mean score (range: 1–4, median: 3) of lower than the bottom 25% was considered “low,” while all others were “moderate/high.”
2)
Perceived financial status during childhood was dichotomized as high vs. normal. This variable represents the respondent’s self-rated family financial situation while growing up until 16. Respondents who rated their childhood financial situation as “poor” were categorized as “high,” while those who reported a financial situation of “pretty well off” or “about average” were categorized as “normal.”
3)
The childhood stress events indicator assessed whether participants experienced any of the following stressful or adverse events before age 18: (1) whether the participant had encounters with law enforcement, (2) whether either of the participant’s parents drank alcohol or used drugs often enough to cause issues in the home, or (3) whether the participant experienced physical mistreatment from either parent prior to turning 18. Responses were dichotomized such that participants reporting one or more events were labeled as having “exposure to childhood stress,” while those reporting none were considered “unexposed.”
4)
Parental education was classified as “low” if at least one parent completed 8 years or less of schooling, and “normal” if both parents completed more than 8 years of education, based on participant reports.
Statistical analysis
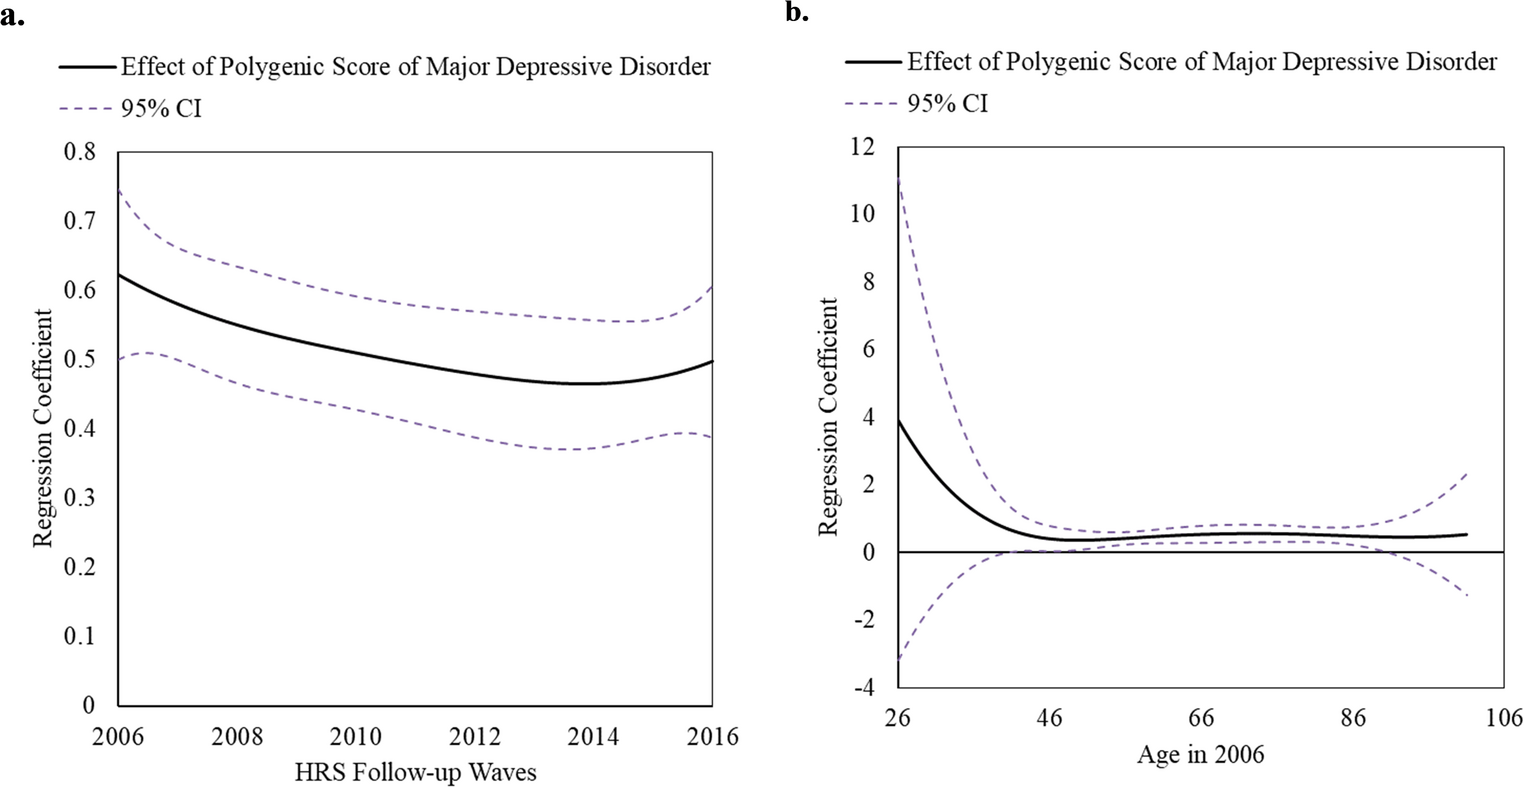
To examine the time-varying effect model based on HRS study wave between binary PGS of MDD and continuous CES-D score, we used the TVEM macro in SAS v9.4 [43]. TVEM flexibly estimates the association between PGS of MDD and continuous CES-D score across continuous time (i.e., wave, age) such that the models allow the effect of the PGS of MDD to change over time. Unlike traditional linear regression, TVEMs do not assume a specific shape or rate of change over time. Instead, TVEMs flexibly model associations, permitting the effect of the PGS to fluctuate across different times. This dynamic association is represented graphically, where changes in the association are depicted by time-varying regression coefficients and their corresponding 95% CIs. Significant associations are identified for ages at which the 95% CI does not encompass zero. We included PGS as a time-varying predictor of CES-D scores, using time (wave) as the unit of measurement from 2006 to 2016. We accounted for the correlation of repeated CES-D assessments by utilizing the ‘cluster’ argument and specified a normal distribution for the continuous CES-D scores using the unpenalized B-splines method [27, 43, 44]. Once we identified the peak wave, we then examined the time-varying effect based on age of PGS of MDD on CES-D (age: 26–101 years), using the same methods described above. TVEM analyses were conducted across the five imputed datasets. We pooled the beta coefficients and standard errors from multiple time points within these datasets using Rubin’s rule [45]. This pooling allowed us to generate the TVEM figures for our analysis. In the TVEM analysis, survey weights were not used to avoid inflating parameter estimate variances, which could undermine statistical efficiency [46, 47]. This approach was suitable since our focus was on the relationship between PGS and CES-D scores rather than making broad population inferences.
To investigate both multiplicative and additive interactions between genetic exposure and early psychosocial factors, we used multivariate logistic regression models. These analyses were conducted separately for four early psychosocial factors. We also created a cumulative early psychosocial score computed by standardizing child financial stress, child stressful events, parental education (less than or equal to 8 years), and reverse-coded maternal warmth, and then summing these standardized scores. Cumulative scores are statistically responsive even in small sample sizes and do not rely on assumptions about the relative importance or interdependence of multiple risk factors [48]. The top 5% was considered a “high cumulative early stress” score. Principal components are commonly used in genetic epidemiology research to address issues related to population stratification—i.e., differences in genetic backgrounds, including racial/ethnic differences, among individuals in a study—and to capture underlying genetic variation within a study population, thereby reducing potential confounding effects in genetic association studies. We used five principal components as recommended in the HRS codebook for the polygenic risk score [49]. To enhance the precision of the effect size estimates, we also included sex, age, and age-squared as covariates in interaction analyses. In TVEM analyses, we controlled for five principal components and sex as time-invariant effects.
Consistent with recommendations for presenting interaction analyses [50], we calculated Odds Ratios (ORs) and 95% confidence intervals (CI) of both multiplicative and additive interaction [i.e., relative risk due to interaction (RERI)] as well as the ORs of genetic and psychosocial exposure respectively, controlling for gene x early psychosocial factor interaction and the covariates. InteractionR package in R was employed to compute RERI [51]. A RERI greater than zero indicated a positive deviation from additivity, and it was considered significant when the 95% CI did not include zero, with RERIs calculated using the delta method based on model-derived ORs. Controlling for the same covariates, we also present stratified analyses by both genetic and psychosocial exposures following the recommendations for interaction analyses report [50]. Given 4 multiple tests with the 4 psychosocial factors, we applied Bonferroni correction, with p-interaction of 0.0125(= 0.05/4 early psychosocial factors).
Sensitivity analyses
We conducted several sensitivity analyses to validate the robustness of our findings. Instead of using a 25% cut point for the PGS of MDD, we used a 10% cut point to perform the same analyses: (1) the time-varying effect of PGS of MDD (top 10% vs. the rest) on depressive symptoms and (2) the interaction between PGS of MDD (top 10% vs. the rest) and early psychosocial factors on depressive symptoms. We conducted sensitivity analyses examining both genetic and early psychosocial factors as continuous variables while controlling for each other in one model. We also performed sensitivity analyses assessing parental education with a cut point of 12 years (vs. 8 years).


Comments (0)