
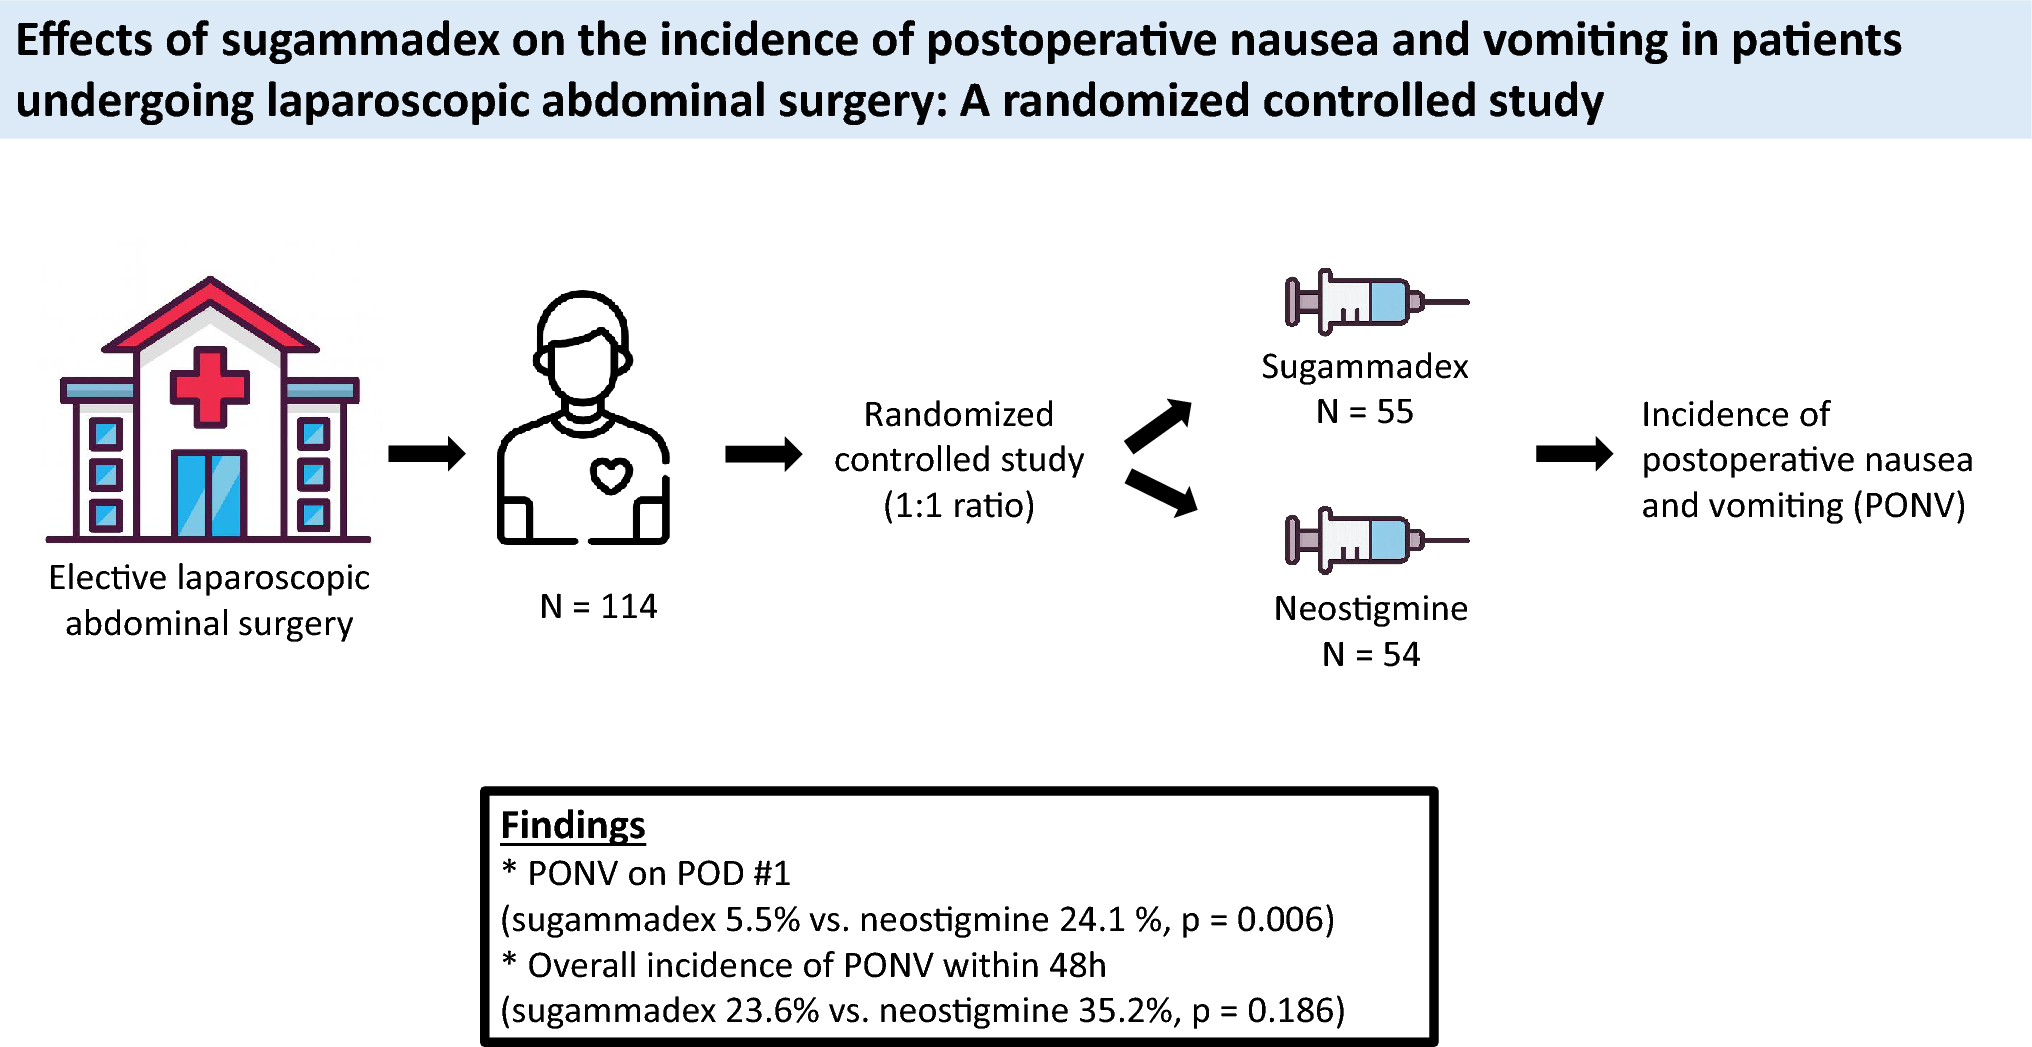
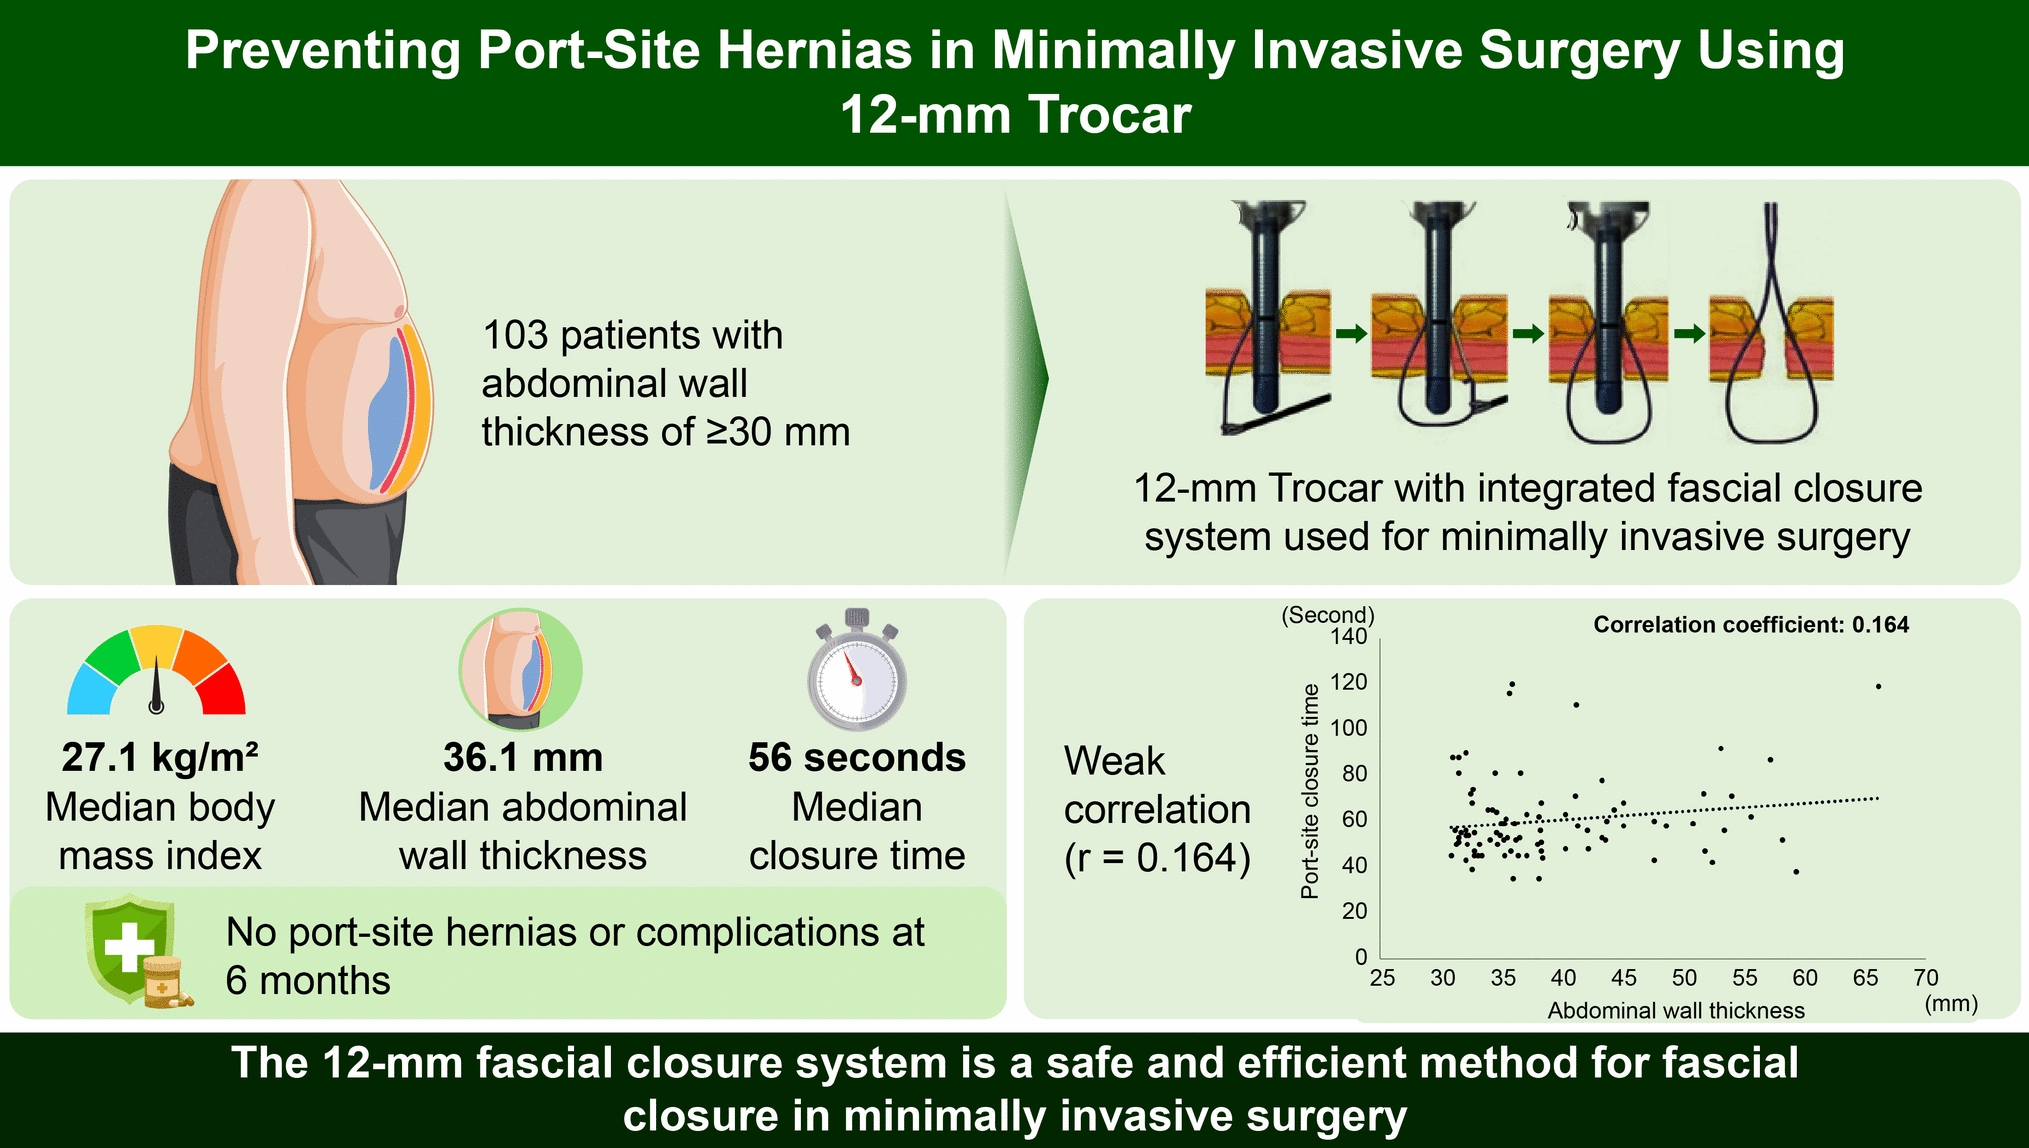
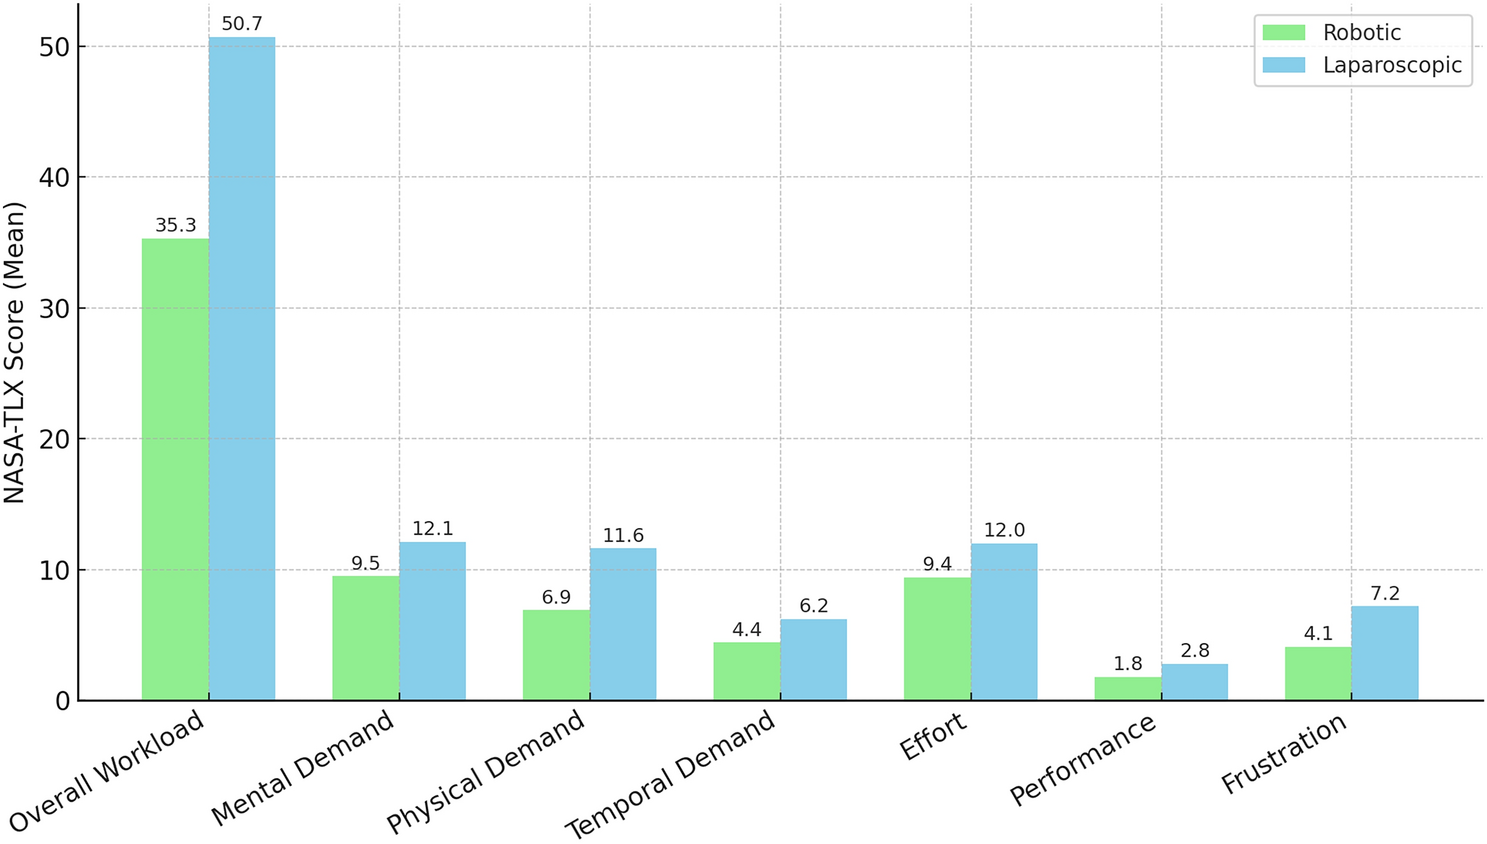
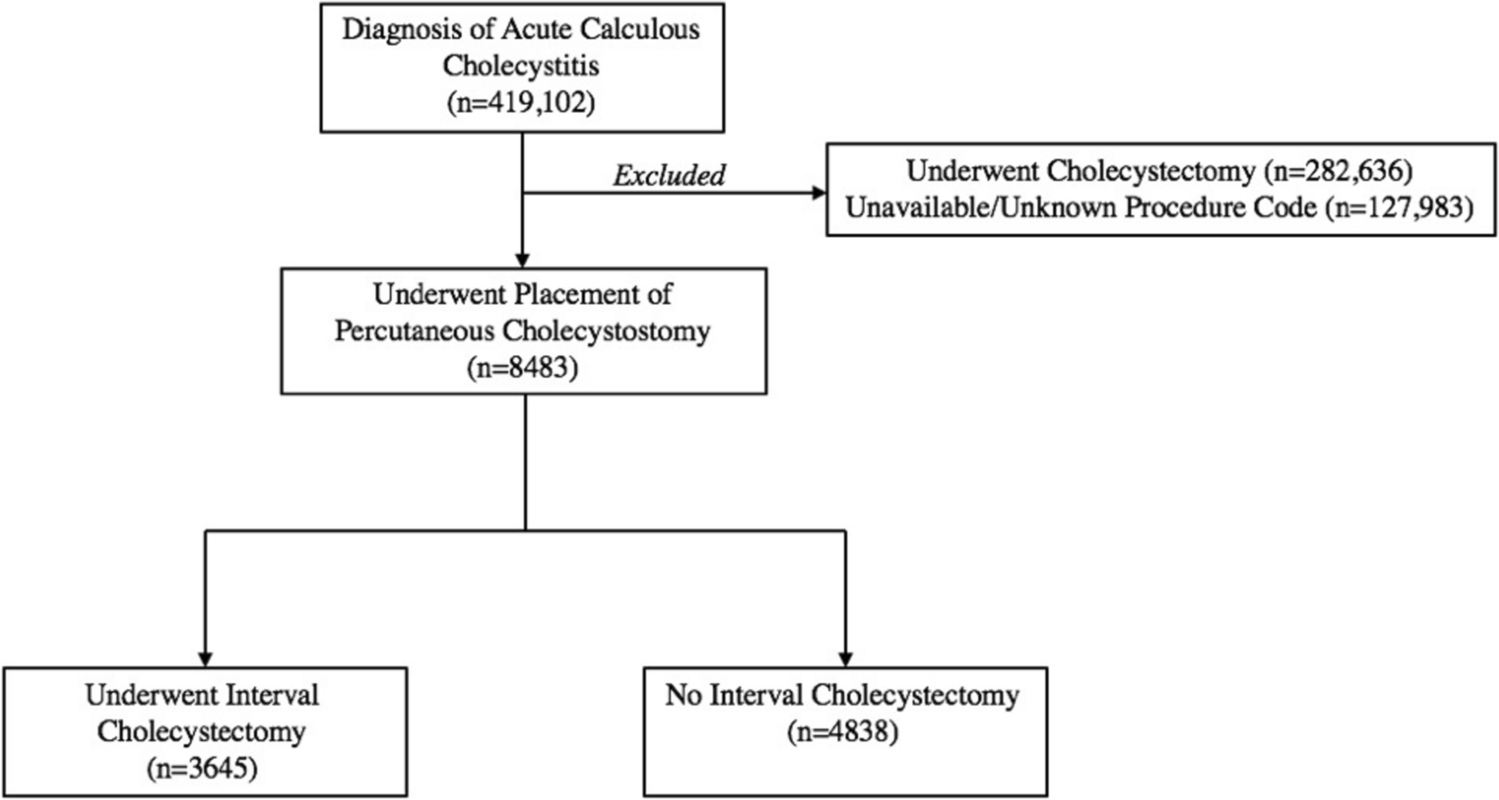
Remember me


We designed a survey in which surgeons evaluated deep learning–generated overlays in recordings of RAMIE procedures. We combined surgeon feedback with quantitative performance metrics, allowing us to directly compare objective algorithmic measures with subjective clinical assessments. In the sections below, we describe the survey design, participants, deep learning approach, overlay generation, metrics, and evaluation.
Survey designThe survey is divided into two sections, as shown in Fig. 1. The first section is brief and collects key demographic and professional background information from participants, including age, surgical qualifications, number of surgeries performed and assisted, and color blindness. The second section comprises 12 questions, each beginning with a short video clip lasting between 10 and 30 s. Each clip presents a tiled view: The left side shows an unaltered segment of the surgery, while the right side displays the same segment enhanced with overlays generated by a deep learning model. More information on how these videos were selected and how the overlays were generated can be found in the “2.3” section. Before viewing each clip, participants were shown a screenshot from the video without overlays to help them orient themselves and ensure an unbiased evaluation. They then answered four questions per video. The first question assessed whether the overlays improved their ability to identify anatomical structures. The second asked surgeons to rate the accuracy of the overlays for each anatomical structure. Finally, participants were invited to optionally explain why certain overlays were of low quality and to identify any missing or poorly detected structures.
Fig. 1
a The first section of the survey, in which participants were asked about their demographic and professional background. b An example of one of the 12 questions from the second section of the survey. Participants could play the video and answer two compulsory and two optional questions
Survey participantsThe survey was conducted during the ESSO Hands-on Course on Minimally Invasive Gastrectomy and Esophagectomy at the University Medical Center Utrecht, the Netherlands, in November 2024. Prior to the survey, participants received a detailed overview outlining the study’s purpose and procedures. Participation was entirely voluntary, and each person provided informed consent prior to completing the survey. In total, 26 upper gastrointestinal surgeons were included in the survey. None of the participants reported any type of color blindness. On average, participants finished the survey in 10–15 min. An overview of their surgical background is shown in Fig. 2. There is substantial variation among participants in the number of procedures they assisted and performed. We intentionally surveyed individuals with both extensive and limited experience in minimally invasive surgery to assess how their perspectives differ.
Fig. 2
Surgical background of survey participants for minimally invasive esophagectomy (MIE) and RAMIE. Each participant selected one option in each of the four categories shown in the legend, yielding 26 responses per category
Deep learning models and datasetIn this survey, we utilized overlays generated by two deep learning models. The first model is Mask2Former, pretrained on ADE20K, as used in previous work [13]. Additionally, we employed CAFormer, pretrained on SurgeNet, as proposed in [2]. The training settings were kept consistent with those in the original papers. These models were selected as they represent the best-performing architectures for anatomy recognition in RAMIE reported in the literature. Since the models differ in architecture, using both generates more diverse overlays than a single model would, supporting the goal of exposing surgeons to varied examples.
In order to train the deep learning models, thoracoscopic RAMIE recordings were retrospectively acquired from 32 esophageal cancer patients treated between January 2018 and July 2021 at the University Medical Center Utrecht, The Netherlands. All procedures were performed by two surgeons who had performed over 200 RAMIE cases. Videos were recorded at 25 Hz and 960 × 540 resolution and then cropped to 668 × 502 to remove irrelevant black side borders and portions of the user interface. From these, 879 frames were randomly sampled and annotated by four research fellows under expert surgeon supervision. These frames were split into training (70%), validation (15%), and test (15%) sets based on a per-patient split.
Overlay generationTwelve video segments from four patients in the deep learning test set were selected for the survey. These segments were chosen to ensure representation of all target anatomical structures, include both straightforward and more challenging views (e.g., variable lighting, partial occlusion, or anatomical variation), and to sample from multiple patients to avoid patient-specific bias. Each segment ranged from 10 to 30 s, yielding a total of 8326 frames. The following seven anatomical structures are present in these videos: airways, aorta, azygos vein and vena cava, esophagus, nerves, pericardium, right lung, and thoracic duct. The labeling protocol was developed in collaboration with an expert surgeon. The trachea, left, and right main bronchi were grouped into one class due to their similar appearance and indistinct boundaries. The vena cava, azygos vein, and intercostal veins were combined for the same reason. The nerves include the vagal and recurrent laryngeal nerves. Lastly, the pericardium class also encompasses the pulmonary veins, as they lie beneath the pericardial tissue layers. Overall, the survey includes 46 overlays of the aforementioned anatomical structures. These overlays were created using two deep learning models. Half of the predicted video segments were randomly assigned to be generated by Mask2Former, while the other half were generated using CAFormer, ensuring variety in the predicted segments. The predictions were averaged over time to reduce flickering using the following weighted average:
where Ft denotes the predicted frame at time t, \(\widehat_}\) denotes the averaged prediction at time t, and the weights are defined as wk = 1.0 − 0.1 k.
In order to compute evaluation metrics for each predicted video in the survey, we required reference annotations of all 8326 frames. These reference annotations were created using a combination of RITM [14], a deep learning model for click-based interactive segmentation, and Cutie [15], a deep learning model for temporal propagation of annotations. RITM was fine-tuned on the deep learning dataset for optimal results using the default training settings. Although this method worked reasonably well, all 8326 frames were manually corrected by a research fellow to ensure accurate reference annotations. Figure 3 shows a sample comparison between reference annotations and model predictions from one video.
Fig. 3
Example of five equidistantly extracted frames from a single video, with reference annotations and model predictions
MetricsA comprehensive set of evaluation metrics was included for analysis, with definitions and explanations provided in Appendix A. These metrics are grouped into four categories: (1) Overlap metrics, such as the Dice score, measure how well the predicted segmentation aligns with the reference annotation, which is particularly important for assessing the general accuracy of the overlays. (2) Distance metrics, such as the Hausdorff distance, evaluate the boundary deviation between predicted and actual borders. These could be critical in surgical contexts where even small deviations near vital structures can have clinical implications. (3) Temporal metrics, such as variations in the number of predicted pixels over time, capture the stability and consistency of predictions throughout a video or dynamic sequence. Temporal coherence may be a crucial factor in establishing qualitative trust for surgeons, who benefit from smooth, continuous feedback during procedures. (4) Error-specific metrics, such as the false positive rate, highlight types of mistakes that may carry higher clinical risk, e.g., incorrectly identifying non-critical tissue as critical or vice versa. These metrics support a more nuanced understanding of model behavior and might align better with how surgeons think about safety and reliability.
EvaluationThe metrics and surgeon ratings of annotation accuracy were compared using the Spearman correlation coefficient, a non-parametric statistic that measures the strength and direction of a monotonic relationship between two ranked variables. Additional explanation and the equation are provided in Appendix B. To facilitate evaluation, we computed the absolute value of the correlation, as some metrics exhibit negative correlations. To investigate the influence of experience in surgery, we have made a specific experience-based split:
1.Experts (> 100 (RA) MIE cases performed) have mastered the complex anatomy, resulting in consistent intra-operative decision-making and accurate anatomical recognition. According to the literature, this number of cases typically surpasses the learning curve for (RA)MIE procedures [4].
2.Intermediates (> 10 (RA)MIE cases performed/assisted; ≤ 100 cases performed) are in the process of refining their anatomical knowledge and technical skills through hands-on and assisted experience.
3.Novices (≤ 10 (RA)MIE cases performed/assisted) are early in their training, having limited familiarity with the anatomy and minimally invasive procedures, which may affect their assessment of anatomical overlays.
Based on this classification, the study participants include 7 experts, 11 intermediates, and 8 novices.
Comments (0)