Study population
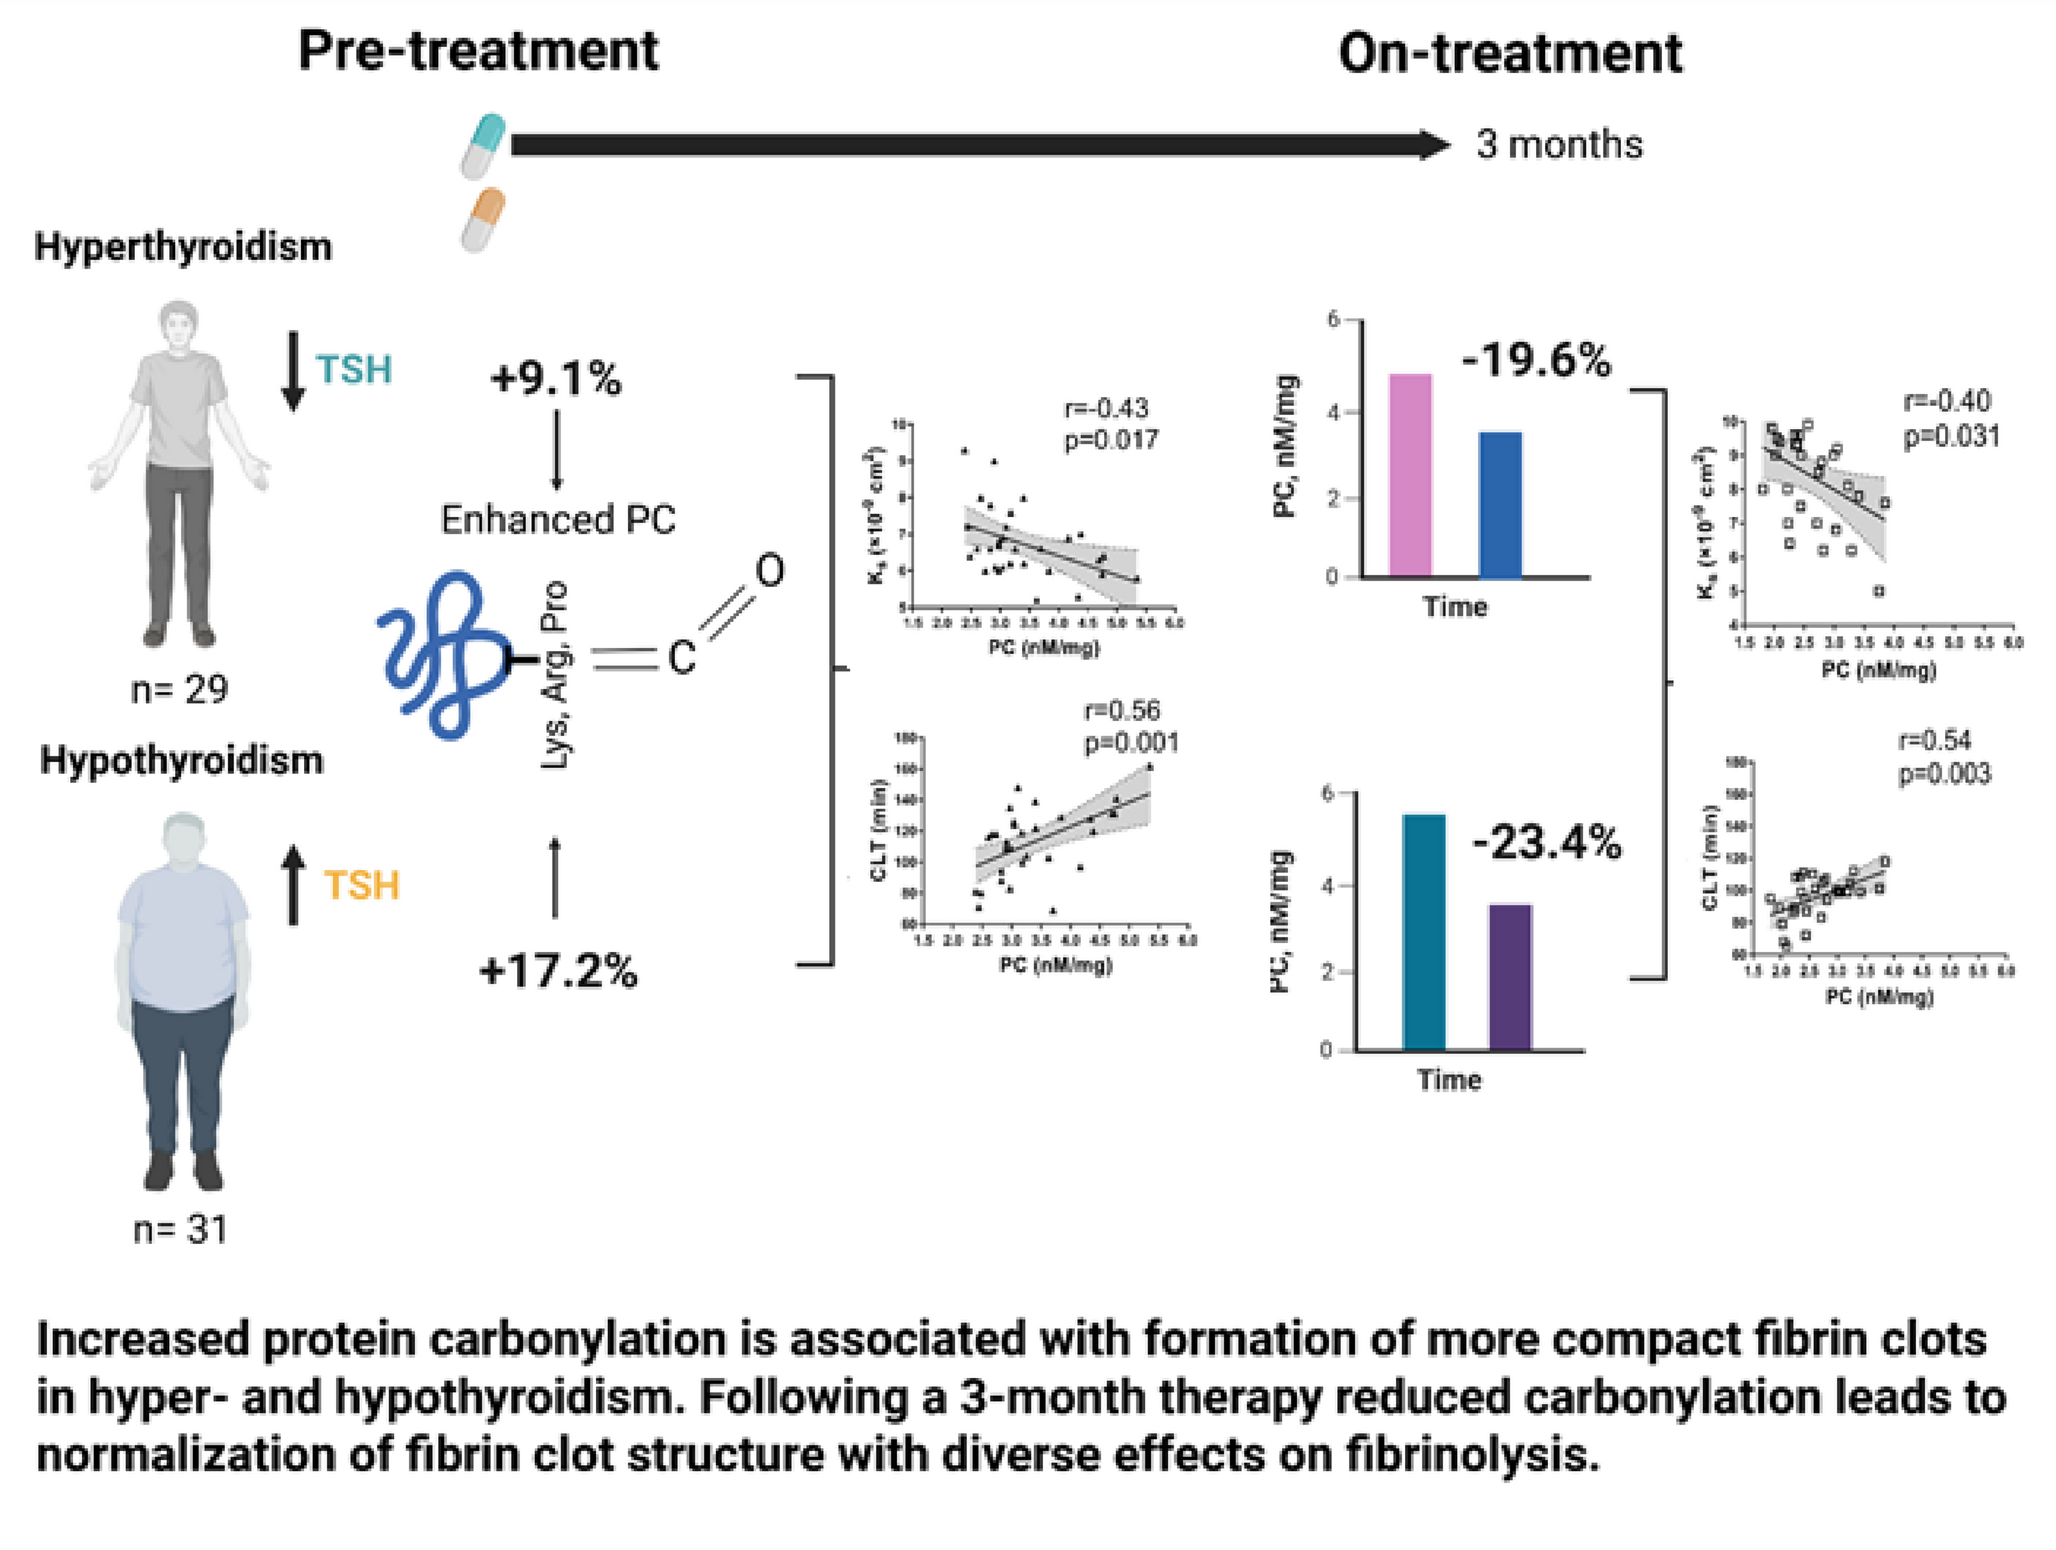
We recruited 32 consecutive adult individuals with documented hyperthyroidism and 30 individuals with hypothyroidism in a tertiary center in Krakow, Poland. The current study group was a subset of the population described previously [31]. Hyperthyroidism was defined by a TSH concentration below 0.27 µIU/mL coupled with an FT4 concentration above 22 pmol/L and/or free triiodothyronine (FT3) concentration above 7.8 pmol/L; patients with low TSH and normal FT4 and FT3 were identified as having subclinical hyperthyroidism [31]. Among hyperthyroid subjects, Graves’ disease was confirmed if human thyroid receptor-stimulating antibodies (h-TRAB) were above 1.8 IU/L. For hypothyroidism, a diagnosis was made when TSH exceeded 4.2 µIU/mL in conjunction with FT4 concentration below 12 pmol/L. Individuals with TSH in the 4.3–10 µIU/mL range but normal FT4 were considered to have subclinical hypothyroidism. Furthermore, Hashimoto’s thyroiditis was diagnosed when anti-thyroid peroxidase (anti-TPO) and/or anti-thyroglobulin (anti-TG) antibodies were detected, using thresholds of 34 and 10 IU/mL, respectively. As many as 29 controls, matched for age and sex, were recruited from hospital personnel and their relatives.
We excluded patients on anticoagulant therapy, those with recent acute coronary syndrome, or venous thromboembolism and severe disease (malignancy, liver injury, chronic kidney disease), acute infection, or pregnant women. All participants provided written informed consent, and the study was approved by the Bioethical Committee.
Diabetes mellitus was identified either by ongoing insulin or oral hypoglycemic treatment, by fasting blood glucose > 7 mmol/L on two separate occasions, by hemoglobin A1C ≥ 6.5%, by blood glucose ≥ 11.1 mmol/L with typical hyperglycemia symptoms, or by blood glucose ≥ 11.1 mmol/L in a 2-hour sample in glucose tolerance test. Arterial hypertension was diagnosed based on a documented current antihypertensive treatment or repeated blood pressure ≥ 140/90 mmHg. Coronary artery disease (CAD) was defined by a history of acute myocardial infarction, coronary revascularization, or significant coronary stenosis on angiography.
Hyperthyroid individuals received either thiamazole, with doses adjusted biweekly or radioactive iodine (RAI) therapy at the physician’s discretion. Hypothyroid patients were treated with levothyroxine (LT4), with dosage modifications performed monthly. After a 3-month therapy, the patients were reassessed, including blood tests.
Laboratory investigations
Venous blood samples were drawn from the antecubital vein using minimal tourniquet application after an overnight fast, between 8 and 10 AM. In patients with thyroid disorders, samples were collected twice at baseline and after 3 months of therapy; control subjects were sampled once. Routine assays were used to measure serum glucose, lipid profile, and creatinine. TSH, FT4, FT3, anti-TPO, and anti-TG were quantified using electrochemiluminescent immunoassays (Roche Diagnostics, Basel, Switzerland), and plasma h-TRAB levels were measured via a radioimmunometric assay (B.R.A.H.M.S, Hennigsdorf, Germany). Fibrinogen concentration was determined using the Clauss method. High sensitivity C-reactive protein (CRP) was measured by latex nephelometry (Siemens, Marburg, Germany).
Plasminogen was assessed using chromogenic assay (STA Stachrom plasminogen, Diagnostica Stago, Asnières, France). Levels of plasminogen activator inhibitor-1 (PAI-1) and tPA antigens were determined by ELISAs (Hyphen BioMed, Neuville-Sur-Oise, France), while PAI-1 activity was evaluated using a chromogenic assay (Chromolize PAI-1, Trinity Biotech, County Wicklow, Ireland). Thrombin-activatable fibrinolysis inhibitor (TAFI) antigen was measured by ELISA (Chromogenix, Lexington, MA, USA) and its activity was determined using a chromogenic assay with the ACTICHROME® Plasma TAFI Activity Kit (American Diagnostica, Stamford, CT, USA). Peak thrombin was evaluated using calibrated automated thrombography (CAT; Thrombinoscope BV, Maastricht, the Netherlands) as described [31] .
Protein carbonylation
The PC content was determined following the protocol by Becatti et al. [9]. In short, 400 µL of 2,4-dinitrophenylhydrazine was mixed with 100 µL of plasma. After allowing the mixture to incubate, trichloroacetic acid was added to precipitate the proteins. The resulting pellet was washed using an equal mixture of ethanol and ethyl acetate, then resuspended in 500 µL of guanidine hydrochloride. The PC content was determined using a molar extinction coefficient of 22,000 M⁻¹ cm⁻¹.
Fibrin clot analysis
Plasma fibrin clot permeability (Ks) was evaluated using a pressure-driven system. In this method, citrated plasma was mixed with calcium chloride (final concentration, 20 mmol/L) and human thrombin (final concentration, 1 U/mL) to induce clot formation. The clots were then connected via plastic tubing to a buffer-filled reservoir, and the volume of liquid passing through each clot over a set period was recorded. Ks was determined based on an equation incorporating variables such as flow rate, clot length, viscosity, cross-sectional area, and pressure difference. Lower Ks values indicate decreased clot permeability.
Fibrinolysis efficiency was assessed as previously described [33]. Lysis was induced by recombinant tPA (final concentration, 60 ng/mL, Boehringer Ingelheim, Ingelheim, Germany) and involved mixing citrated plasma with calcium chloride (final concentration, 15 mmol/L), human tissue factor (Innovin, Dade Behring, final concentration, 0.6 pmol/L ), and phospholipid vesicles (final concentration, 12 µmol/L), all diluted in Tris-buffered saline. The process was monitored spectrophotometrically at 405 nm and 37 °C, with clot lysis time (CLT) defined as the interval from the midpoint of clot formation to the stabilization phase indicating complete lysis. The investigations were performed by technicians blinded to the subjects’ clinical status.
Representative fibrin clots (n = 3) for each group were fixed using 2.5% glutaraldehyde, washed with distilled water, dehydrated in graded water-ethanol solutions, dried by the critical point procedure and sputter coated with gold. Samples were scanned in 10 different areas (microscope JEOL JCM-6000; JEOL Ltd., Tokyo, Japan) at a magnification of 5,000x to determine a mean fibrin fiber diameter of at least 100 fibers per clot, using the Image J software (US National Institutes of Health, Bethesda, MD, USA).
Statistical analysis
Categorical variables were compared using Fisher’s exact test or χ2 test, as appropriate, with the Bonferroni correction in post hoc analyses. Shapiro-Wilk test and histogram analysis were employed to check for normal distribution of continuous variables. Data are presented as mean ± standard deviation if the parameter was normally distributed in all groups or median (interquartile range) if the variable was non-normally distributed in any group. Homogeneity of variance was checked using Levene’s test. To assess intergroup differences between hyper-, hypothyroid patients and controls, Kruskal-Wallis test with Dunn’s post hoc and one-way ANOVA with Tukey’s post hoc (for equal variance) or Games-Howell post hoc (for unequal variance) were used for non-normally and normally distributed continuous variables, respectively. FT3 and FT4 levels between hyper- and hypothyroid patients were compared using Mann-Whitney U test. For evaluation of differences in parameters before and after treatment, Wilcoxon signed-rank test or paired Student t-test was used for non-normally and normally distributed variables, respectively. Assessment of linear correlations between variables was conducted with Pearson’s correlation coefficient calculated if both variables were normally distributed and Spearman’s rank coefficient if any of the compared parameters were non-normally distributed. A two-sided p-value < 0.05 was considered statistically significant. Statistical analysis was performed using SPSS Statistics (IBM Corp. Released 2023. IBM SPSS Statistics for Windows, Version 29.0.2.0 Armonk, NY: IBM Corp).


Comments (0)