
Remember me


With the improvement of living standards, the incidence of metabolic diseases is increasing rapidly, such as obesity, diabetes, coronary heart disease (1–4). We are in an era of chronic metabolic and cardiovascular. Metabolic syndrome (MS) is caused by a series of metabolic diseases including hyperlipidemia, diabetes, hypertension, and obesity. Hyperlipidemia, defined as the presence of excess fat or lipids in the blood, is characterized by a high tone of total cholesterol (TC), triglycerides (TG), low-density lipoprotein cholesterol (LDL-C), and a low tone of high-density lipoprotein cholesterol (HDL-C) (5,6). Previous studies have proved that hyperlipidemia is a high-risk factor and key indicator of MS, which accounts for approximately 30% of deaths worldwide (7), and its prevalence is on the rise (8).
The etiology of hyperlipidemia is determined by both genetic and environmental factors, such as diet, lifestyle, and geographic location (9). Early intervention of hyperlipidemia can prevent the occurrence of related diseases and complications (10–12). The treatment strategy for hyperlipidemia is mainly lifestyle intervention and drug therapy. However, pharmacologic therapies are associated with many side effects and long-term use (13). Therefore, it is of great significance to comprehensively analyze the related factors of hyperlipidemia and find a treatment method with less side effects.
Recent studies have shown that intestinal microbiota is an important environmental factor in regulating body metabolism, contributing to the occurrence and development of many chronic diseases, such as hyperlipidemia, obesity, diabetes, and atherosclerosis (14–16). Fecal microbiota transplantation (FMT) is a new therapeutic method that uses healthy microbial configuration to replace the indigenous microbiome of patients. To date, FMT has been studied in many microbiome-associated diseases, such as recurrent Clostridioides difficile disease infection (CDI) (17), ulcerative colitis (18–20), inflammatory bowel disease (21,22), obesity (23), and MS (24). Our previous studies have shown that washed microbiota transplantation (WMT) had a significant improvement effect on patients with hyperlipidemia and hypolipemia in the Chinese population in the short term without severe side effect (25). We hypothesized that WMT could continuously affect patients with hyperlipidemia for a long time without side effects. Therefore, we conducted a long-term retrospective trial to collect the medical data of hyperlipidemia patients with WMT treatment.
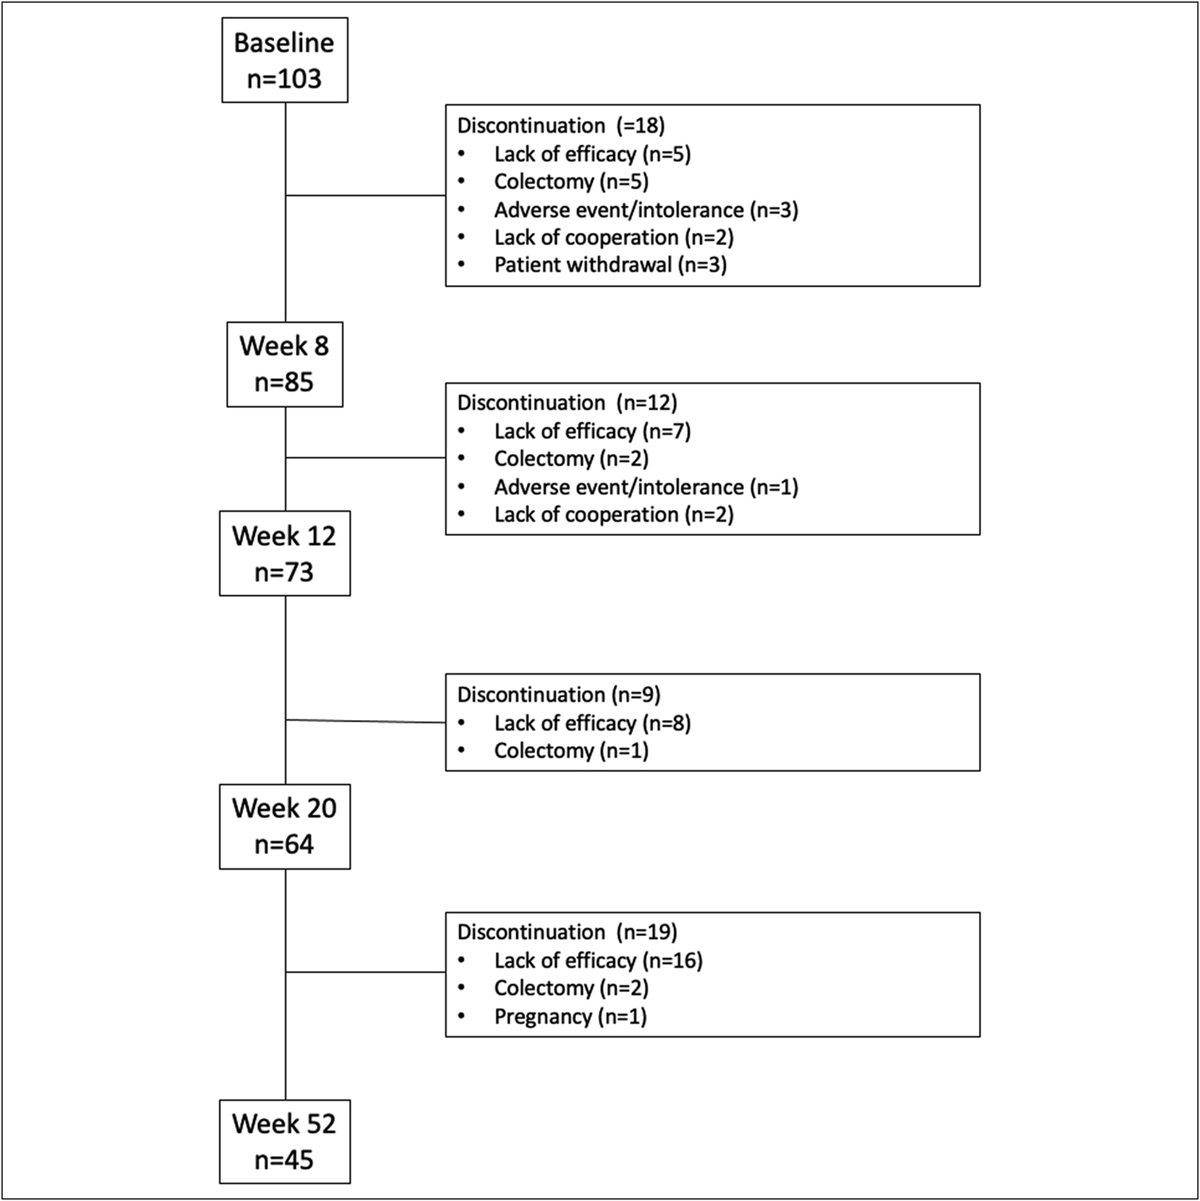
MATERIALS AND METHODS PatientsConsecutive patients who underwent WMT for various indications in at least 1 course at our hospital from January 1, 2017, to December 31, 2020, were enrolled in the study. The inclusion criteria were as follows: patients who were 18–80 years old with blood lipid data more than twice, those who provided informed consent and received WMT. The exclusion criteria were as follows: patients who were pregnant; those who had antihyperlipidemia from January 1, 2016, to December 31, 2020; and those who had a change in their antihyperlipidemia medication regimen after WMT. A total of 124 patients were enrolled. This study was conducted and approved by the Ethics Committee (no. 2017-98) in accordance with the Declaration of Helsinki at the First Affiliated Hospital of Guangdong Pharmaceutical University, Guangzhou, China. Written informed consent from all patients was obtained and reviewed.
WMT procedureThe procedure of WMT was consistent with the Nanjing Consensus on Methodology of Washed Microbiota Transplantation (26). All healthy stool donors, aged between 18 and 25 years, strictly underwent interviews, psychological and physical examinations, biochemical testing, and infectious disease screening. The specific fecal preparation procedures can refer to the Nanjing Consensus. Finally, based on each patient's physical condition and willingness, fecal suspension was injected into the patient's body through the nasal jejunum (upper digestive tract) or colonoscopy tube (lower digestive tract). The center implements the “three three course treatment” standard for treatment. WMT treatment should be performed once a month for the first 3 months and then every 3 months after the third month. Among them, the WMT treatment course is for 3 days, once a day, and 120 mL of bacterial cleaning solution is used once each time.
The standard treatment was “thrice thrice therapy”: In the first 3 months after starting WMT treatment, the patients should undergo WMT treatment once a month (injecting washed microbiota suspension for 3 consecutive days each month). After that, there should be a 3-month interval before the fourth WMT treatment (5 months after baseline), to strengthen the colonization of transplanted microbiota through this treatment and then continue to complete the fifth and more courses according to the patient's condition. All patients underwent at least one WMT procedure and completed follow-up by October 31, 2022.
Data collectionData were collected from the medical records of patients before treatment (baseline) and then before every procedure and after the last WMT treatment. Data included were age, sex, body mass index, smoking status, blood pressure (at admission), diseases or indications for WMT, adverse reaction, and laboratory test results. Laboratory test results included serum lipids, namely TC, TG, HDL-C, and LDL-C, apolipoprotein B, non-high-density lipoprotein (non-HDL-C), and lipoprotein A. Hyperlipidemia was diagnosed based on the guideline for dyslipidemias. It was grouped on 4 levels. First, all eligible patients are divided into 2 groups: the hyperlipidemia (TC ≥5.2 mmol/L or TG ≥1.7 mmol/L or LDL-C ≥3.4 mmol/L or non-HDL-C ≥4.1 mol/L) and normal groups according to their baseline, blood lipid status. Second, according to the atherosclerotic cardiovascular disease (ASCVD) risk classification, patients were divided into very high-risk group, high-risk group, medium-risk group, and low-risk group. Third patients were divided into single-course, double-course, and multicourse (3 or more courses) groups based on the course count until the study deadline. Fourth, patients were divided into within 1 year and over 1 year groups (including 1 year) based on the length of time between the baseline and last laboratory test results. After all patients received at least one WMT treatment procedure and completed follow-up, the results of blood lipid changes were statistically analyzed and evaluated.
Statistical analysisStatistical analyses were performed using SPSS 22.0 and Prism 8. The results were expressed as frequencies and percentages for categorical variables, means and SDs for normally distributed continuous variables, and medians and interquartile ranges for non-normally distributed continuous variables. Categorical variables were analyzed using the χ2 or Fisher exact test. For comparisons of continuous variables between 2 independent groups, either unpaired Student t-test (for normally distributed variables) or Mann-Whitney U test (for non-normally distributed variables) was applied. While comparing paired data, paired Student t-test (for normally distributed variables) or Mann-Whitney U test (for non-normally distributed variables) was used. A 2-tailed P value < 0.05 was considered statistically significant.
RESULTS Clinical characteristics of patients who underwent WMTA total of 124 patients were treated with WMT (56 cases of hyperlipidemia and 68 cases with normal lipid), of which 51.81% were male, with an average age of 49.05 ± 14.57 years. Table 1 presents the main indications for WMT, and the top 3 diseases were functional bowel disease (n = 67; 54.03%), followed by gastroesophageal reflux disease (n = 11; 8.87%), and ulcerative colitis (n = 10; 8.06%). The interval time between baseline and 2–4 courses were 35 days (second, 32–42), 80 days (third, 68.75–99.25), and 188 days (fourth, 154.75–207.50), respectively. Blood lipid characteristics of patients are presented in Table 2.
Table 1. - Main diagnoses of patients receiving WMT Primary cause of WMT Number (n) Percentage (%) Functional bowel disease 67 54.03 Gastroesophageal reflux disease 11 8.87 Ulcerative colitis 10 8.06 Nonalcoholic fatty liver disease 5 4.03 Gout 4 3.23 Esoenteritis 3 2.42 Crohn's disease 3 2.42 Multiple polyposis coli 2 1.61 Radioactive proctitis 2 1.61 Radioactive colitis 2 1.61 Chronic viral hepatitis B 2 1.61 HBV-related liver cirrhosis 2 1.61 Autoimmune hepatitis 1 0.81 Parkinson disease 1 0.81 Bronchial or lung malignancy 1 0.81 Epilepsy 1 0.81 Senile tremor 1 0.81 Bipolar disorder 1 0.81 Postoperative esophageal cancer 1 0.81 Intestinal tuberculosis 1 0.81 Hyperlipidemia 1 0.81 Hyperuricemia 1 0.81 Type 2 diabetes 1 0.81 Total 124 100HBV, hepatitis B virus; WMT, washed microbiota transplantation.
Data presented as mean ± SD, or n (%).
Apo-B, apolipoprotein B; BMI, body mass index; HDL-C, high-density lipoprotein cholesterol; LDL-C, low-density lipoprotein cholesterol; LIP-A, lipoprotein A; non-HDL-C, non-HDL cholesterol; TC, total cholesterol; TG, triglyceride.
The average TG, TC, LDL-C, and non-HDL-C of the hyperlipidemia group was 1.97 ± 1.81, 5.56 ± 0.77, 3.45 ± 0.97, and 4.31 ± 0.71 mmol/L, respectively. The average TC, TG, LDL, and non-HDL-C of the normal group was 0.93 ± 0.31, 0.93 ± 0.31, 2.32 ± 0.55, and 2.74 ± 0.60 mmol/L, respectively. There are no serious adverse events (AEs), and only a few AEs included abdominal distention, abdominal pain, diarrhea, and dizziness.
A total of 30 patients with a follow-up period over 1 year were selected, including 10 male (33.33%) and 20 female (66.67%) patients with an mean age of 54.27 ± 12.18 (years). The observation time was 731.55 ± 317.40 days in the single-course group and 681.00 ± 344.69 days in the double-course group. The multicourse group had an observation time of 901.67 ± 427.54 days, and the overall observation time was 787.80 ± 371.45 days.
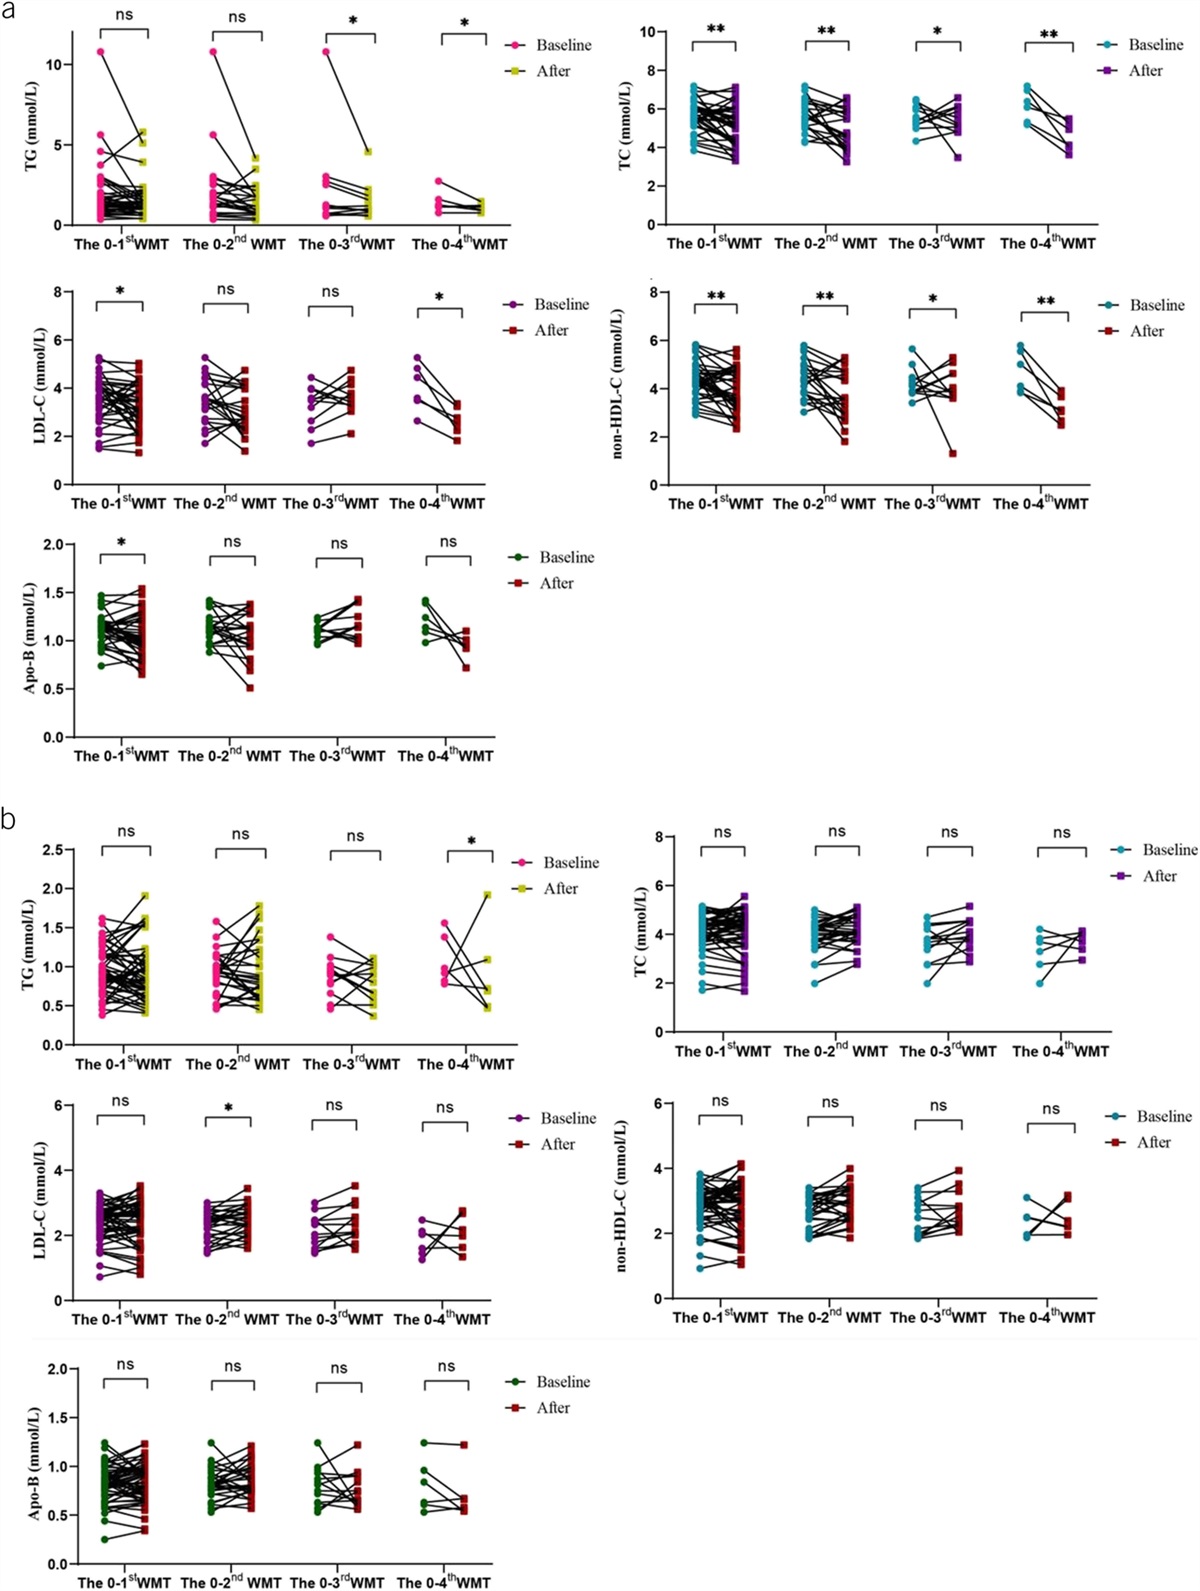
Effect of WMT on lipid profilesTable 3 and Figure 1 present the effect of WMT on the hyperlipidemic group and normal lipid group. After the first course, WMT showed a significantly lower effect on TC (from 5.64 ± 0.78 to 5.16 ± 1.0 mmol/L), LDL-C (from 3.54 ± 0.94 to 3.24 ± 0.9 mmol/L), and non-HDL-C (from 4.37 ± 0.73 to 3.92 ± 0.87 mmol/L) in the hyperlipidemia group (P < 0.05). After the second course, WMT showed a significantly lower effect on TC (P = 0.007), and non-HDL-C (P = 0.006) in the hyperlipidemia group. After the third course, WMT showed a significantly lower effect on TG (P = 0.021), TC (P = 0.032), and non-HDL-C (P = 0.049) in the hyperlipidemia group (P < 0.05). After the fourth course, WMT showed a significantly lower effect on TG (P = 0.043), TC (P = 0.001), LDL-C (P = 0.015), and non-HDL-C (P = 0.001) in the hyperlipidemia group (P < 0.05). Patients were divided into single-course, double-course, and multicourse groups based on the course count until the study deadline (Table 4). WMT showed a significantly decreased effect on TG (P = 0.028), TC (P = 0.002), LDL-C (P = 0.020), and non-HDL-C (P < 0.001) in the hyperlipidemia group with a single course. WMT showed a significantly decrease effect on TG (P = 0.042), TC (P = 0.007), and non-HDL-C (P = 0.003) in the hyperlipidemia group with a double course. WMT showed a significantly decreased effect on TG (P = 0.027), TC (P = 0.016), and non-HDL-C (P = 0.008) in the hyperlipidemia group with a multiple course. WMT can reduce blood lipids in patients with hyperlipidemia. There was no statistical difference between groups in the reduction of TG, TC, and non-HDL-C after a single course, double course, and multiple course. However, compared with single and double courses, the reduction of TG, TC, and non-HDL-C with multiple courses was more significant.
Table 3. - Lipid profiles of WMT treatment procedures in the study Items Baseline W1 P value Baseline W2 P value Baseline W3 P value Baseline W4 P value Baseline W5 P value Hyperlipidemia group TC 5.64 ± 0.78 (n = 37) 5.16 ± 1.02 (n = 37) 0.003 5.68 ± 0.79 (n = 22) 4.98 ± 1.05 (n = 22) 0.007 5.84 ± 0.90 (n = 11) 4.93 ± 0.97 (n = 11) 0.032 6.16 ± 0.71 (n = 6) 4.67 ± 0.73 (n = 6) 0.001 5.56 ± 0.77 (n = 56) 5.13 ± 0.96 (n = 56) 0.002 TG 1.37 (0.98–2.28) (n = 37) 1.31 (0.90–1.79) (n = 37) 0.137 1.59 (1.05–2.58) (n = 22) 1.20 (0.77–1.93) (n = 22) 0.064 1.16 (0.72–2.04) (n = 11) 0.87 (0.70–1.58) (n = 11) 0.021 1.21 (0.99–4.75) (n = 6) 0.97 (0.75–2.39) (n = 6) 0.043 1.55 (0.96–2.17) (n = 56) 1.24 (0.79–2.00) (n = 56) 0.022 LDL-C 3.54 ± 0.94 (n = 37) 3.24 ± 0.90 (n = 37) 0.040 3.50 ± 0.92 (n = 37) 3.07 ± 0.91 (n = 37) 0.057 3.59 ± 1.10 (n = 11) 3.07 ± 0.91 (n = 11) 0.217 3.59 ± 1.28 (n = 6) 2.62 ± 0.69 (n = 6) 0.015 3.62 (3.11–4.06) (n = 55) 3.14 (2.70–3.80) (n = 55) 0.016 HDL-C 1.24 (1.02–1.46) (n = 37) 1.23 (0.94–1.23) (n = 37) 0.365 1.24 (1.10–1.40) (n = 22) 1.20 (0.99–1.42) (n = 22) 0.702 1.37 ± 0.37 (n = 11) 1.27 ± 0.31 (n = 11) 0.054 1.34 (1.04–1.61) (n = 6) 1.21 (0.90–1.59) (n = 6) 0.249 1.26 (1.04–1.41) (n = 55) 1.20 (0.97–1.56) (n = 55) 0.694 Non-HDL-C 4.37 ± 0.73 (n = 37) 3.92 ± 0.87 (n = 37) 0.002 4.42 ± 0.78 (n = 22) 3.74 ± 1.01 (n = 22) 0.006 4.47 ± 0.91 (n = 22) 3.56 ± 1.10 (n = 22) 0.049 4.78 ± 0.85 (n = 6) 3.36 ± 0.56 (n = 6) 0.001 4.33 ± 0.70 (n = 55) 3.83 ± 0.86 (n = 55) <0.001 LIP-A 458.03 ± 697.79 (n = 4) 435.05 ± 627.62 (n = 4 0.582 543.65 ± 668.03 (n = 4) 445.35 ± 601.73 (n = 4) 0.103 — — — — — — 209.10 (84.50–626.40) (n = 9) 241.80 (57.60–606.20) (n = 9) 0.515 Apo-B 1.12 ± 0.15 (n = 37) 1.05 ± 0.22 (n = 37) 0.014 1.14 ± 0.15 (n = 22) 1.06 ± 0.23 (n = 22) 0.133 1.34 ± 0.16 (n = 11) 1.10 ± 0.21 (n = 11) 0.587 1.16 ± 0.16 (n = 6) 1.01 ± 0.14 (n = 6) 0.233 1.13 ± 0.15 (n = 55) 1.02 ± 0.19 (n = 55) <0.001 Normal group TC 4.08 ± 0.74 (n = 55) 4.13 ± 0.85 (n = 37) 0.549 4.05 ± 0.55 (n = 29) 4.19 ± 0.54 (n = 29) 0.101 3.82 ± 0.61 (n = 13) 4.02 ± 0.64 (n = 13) 0.216 3.99 ± 0.78 (n = 6) 4.02 ± 0.80 (n = 6) 0.869 4.12 (3.65–4.49) (n = 68) 4.22 (3.76–4.68) (n = 68) 0.093 TG 0.91 (0.77–1.15) (n = 55) 0.86 (0.70–1.09) (n = 55) 0.446 0.95 (0.72–1.14) (n = 29) 0.80 (0.61–1.21) (n = 29) 0.509 0.89 ± 0.26 (n = 13) 0.79 ± 0.23 (n = 13) 0.200 0.97 ± 0.11 (n = 6) 0.74 ± 0.20 (n = 6) 0.022 0.90 (0.72–1.15) (n = 68) 0.90 (0.67–1.15) (n = 68) 0.871 LDL-C 2.39 ± 0.53 (n = 55) 2.40 ± 0.55 (n = 55) 0.933 2.34 ± 0.42 (n = 29) 2.47 ± 0.40 (n = 29) 0.018 2.20 ± 0.49 (n = 13) 2.36 ± 0.57 (n = 13) 0.228 2.24 ± 0.49 (n = 6) 2.35 ± 0.65 (n = 6) 0.385 2.32 ± 0.55 (n = 68) 2.40 ± 0.59 (n = 68) 0.243 HDL-C 1.20 (1.05–1.48) (n = 55) 1.26 (1.09–1.53) (n = 55) 0.172 1.29 ± 0.30 (n = 29) 1.29 ± 0.31 (n = 29) 0.927 1.22 ± 0.27 (n = 13) 1.30 ± 0.26 (n = 13) 0.118 1.31 ± 0.36 (n = 6) 1.33 ± 0.35 (n = 6) 0.928 1.25 (1.05–1.53) (n = 68) 1.26 (1.08–1.48) (n = 68) 0.216 Non-HDL-C 2.82 ± 0.59 (n = 55) 2.82 ± 0.73 (n = 55) 0.954 2.76 ± 0.49 (n = 29) 2.90 ± 0.47 (n = 29) 0.067 2.60 ± 0.58 (n = 13) 2.71 ± 0.57 (n = 13) 0.416 2.68 ± 0.51 (n = 6) 2.69 ± 0.64 (n = 6) 0.926 2.74 ± 0.60 (n = 68) 2.83 ± 0.66 (n = 68) 0.231 LIP-A 157.00 ± 208.87 (n = 7) 158.11 ± 236.94 (n = 7) 0.939 — — — — — — — — — 60.35 (20.58–289.18) (n = 8) 48.95 (24.83–280.98) (n = 8) 0.398 Apo-B 0.82 ± 0.19 (n = 55) 0.83 ± 0.19 (n = 55) 0.463 0.82 ± 0.14 (n = 29) 0.86 ± 0.16 (n = 29) 0.131 0.77 ± 0.15 (n = 13) 0.77 ± 0.18 (n = 11) 0.976 0.76 ± 0.09 (n = 6) 0.71 ± 0.15 (n = 6) 0.456 0.80 ± 0.19 (n = 66) 0.81 ± 0.20 (n = 66) 0.582Data presented as mean ± SD or median (interquartile range).
W1, after the 1st course; W2, after the 2nd course; W3, after the 3rd course; W4, after the 4th course; W5, after the last WMT, treatment.
Apo-B, apolipoprotein B; HDL, high-density lipoprotein; LDL, low-density lipoprotein; LIP-A, lipoprotein A; on-HDL-C, non-high-density lipoprotein; TC, total cholesterol; TG, triglyceride; WMT, washed microbiota transplantation.
 Figure 1.:
 The effect of WMT on the hyperlipidemic group and normal lipid group. (a) Changes in TG, TC, LDL-c, non-HDL-c, and Apo-B in the hyperlipidemic group; (b) changes in TG, TC, LDL-c, non-HDL-c, and Apo-B in the normal lipid group. *Indicates P < 0.05; **indicates P < 0.01. Apo-B, apolipoprotein B; LDL-c, low-density lipoprotein cholesterol; non-HDL-c, non-HDL cholesterol; ns, not significant; TC, total cholesterol; TG, triglyceride.
Table 4. - Lipid profiles of WMT treatment of the hyperlipidemia group Items Baseline SC P value Baseline DC P value Baseline MC P value Baseline Within 1 yr P value Baseline Over 1 yr P value TG 1.58 (1.01–2.44) (n = 44) 1.27 (0.82–1.96) (n = 44) 0.028 1.58 (1.06–2.58) (n = 26) 1.39 (0.78–2.03) (n = 26) 0.042 1.21 (0.73–2.40) (n = 16) 0.94 (0.70–1.45) (n = 16) 0.027 1.31 (0.68–1.84) (n = 30) 1.19 (0.75–1.85) (n = 30) 0.465 1.74 (1.18–2.80) (n = 26) 1.26 (0.94–2.09) (n = 26) 0.019 TC 5.60 ± 0.78 (n = 44) 5.11 ± 0.96 (n = 44) 0.002 5.63 ± 0.79 (n = 26) 5.03 ± 1.02 (n = 26) 0.007 5.85 ± 0.75 (n = 16) 5.12 ± 1.08 (n = 16) 0.016 5.49 ± 0.68 (n = 30) 5.13 ± 0.89 (n = 30) 0.028 5.64 ± 0.86 (n = 26) 5.13 ± 1.05 (n = 26) 0.031 LDL-C 3.62 (3.10–4.05) (n = 43) 3.09 (2.51–3.85) (n = 43) 0.020 3.47 ± 0.96 (n = 26) 3.09 ± 0.88 (n = 26) 0.052 3.64 ± 0.98 (n = 16) 3.21 ± 0.90 (n = 16) 0.157 3.55 ± 0.76 (n = 30) 3.24 ± 0.77 (n = 30) 0.043 3.62 (3.14–4.17) (n = 25) 2.88 (2.47–3.79) (n = 25) 0.115 HDL-C 1.27 (1.04–1.50) (n = 43) 1.17 (0.98–1.58) (n = 43) 0.334 1.39 (0.78–2.03) (n = 26) 1.20 (0.99–1.45) (n = 26) 0.809 1.31 (1.14–1.41) (n = 26) 1.29 (1.12–1.58) (n = 26) 0.641 1.25 (1.03–1.60) (n = 30) 1.20 (0.97–1.56) (n = 30) 0.571 1.27 (1.05–1.39) (n = 25) 1.25 (0.97–1.58) (n = 25) 0.226 Non-HDL-C 4.36 ± 0.73 (n = 43) 3.84 ± 0.85 (n = 43) <0.001 4.38 ± 0.76 (n = 26) 3.76 ± 0.95 (n = 26) 0.003 4.53 ± 0.76 (n = 16) 3.75 ± 1.00 (n = 16) 0.008 4.22 ± 0.62 (n = 30) 3.85 ± 0.77 (n = 30) 0.016 4.46 ± 0.78 (n = 25) 3.80 ± 0.97 (n = 25) 0.002 LIP-A 99.40 ± 72.63 (n = 5) 101.68 ± 82.89 (n = 5) 0.859 521.70 ± 545.70 (n = 6) 476.95 ± 485.78 (n = 6) 0.340 84.50 ± 49.78 (n = 2) 61.10 ± 13.01 (n = 2) 0.304 221.35 ± 201.04 (n = 4) 118.50 ± 164.22 (n = 4) 0.359 444.73 ± 580.19 (n = 5) 422.87 ± 513.95 (n = 5) 0.620 Apo-B 1.13 ± 0.14 (n = 43) 1.00 ± 0.19 (n = 43) <0.001 1.13 ± 0.16 (n = 26) 1.04 ± 0.22 (n = 26) 0.051 1.14 ± 0.16 (n = 16) 1.07 ± 0.20 (n = 16) 0.533 1.11 ± 0.13 (n = 30) 1.03 ± 0.20 (n = 30) 0.020 1.16 ± 0.17 (n = 25) 1.00 ± 0.17 (n = 25) 0.001 Items SC within 1 yr SC over 1 yr DC within 1 yr MC within 1 yr MC over 1 yr Baseline Profile P value Baseline Profile P value Baseline Profile P value Baseline Profile P value Baseline Profile P value TG 1.37 (0.91–1.98) (n = 33) 1.14 (0.78–1.55) (n = 33) 0.046 1.92 (1.58–3.18) (n = 11) 1.62 (0.94–3.20) (n = 11) 0.424 1.60 (0.77–2.74) (n = 19) 1.59 (0.74–2.16) (n = 19) 0.067 0.68 (0.60–4.40) (n = 4) 0.91 (0.67–1.61) (n = 4) >0.999 1.27 (0.91–2.40) (n = 12) 0.94 (
Comments (0)