
Remember me


Primary liver cancer is the sixth leading cause of cancer-related mortality in the United States and is associated with significant morbidity and economic burden (1,2). Hepatocellular carcinoma (HCC) is the most common histologic subtype of liver cancer and accounts for more than 80% of all cases in the United States (3). Incidence rates of HCC began to plateau in the early 2010s and have decreased in recent years, likely related to improved prevention and treatment for viral hepatitis (4,5).
Current practice guidelines recommend semiannual abdominal ultrasound with or without serum α-fetoprotein (AFP) for HCC surveillance among at-risk populations, such as those with chronic hepatitis B or liver cirrhosis (6,7). HCC surveillance has been associated with curative treatment receipt and prolonged survival, contributing to the plateaued mortality rate of HCC (8,9). However, recent studies highlight that HCC surveillance is still underused in clinical practice, with only 8.8%–29.7% of cirrhotic patients receiving routine monitoring (10–12).
The coronavirus disease 2019 (COVID-19) pandemic and associated quarantine policies limited patients' access to healthcare resources and to cancer surveillance. A study from the Veterans Health Administration healthcare system reported a 44% decline in HCC surveillance during the early months of the pandemic (13). Several major hepatology and oncology professional societies published updated recommendations for HCC surveillance during the pandemic, including deferring surveillance in cases of active COVID-19 infection and during times of low radiologic capacity (14,15). The impact of these recommendations on HCC surveillance rates remains unclear. Early studies conducted during the pandemic observed a significant decline in screening rates, particularly among older individuals (13,16). Although studies have examined HCC incidence after pandemic in individual hospitals and health systems, the effect of the COVID-19 pandemic on HCC detection and outcomes in the United States on a national scale has not been well described. This represents an important gap in knowledge because population-level studies are the most accurate way of assessing how the COVID-19 pandemic and associated policies affected HCC surveillance and detection. Moreover, a nationwide study can identify the demographics of individuals at risk of HCC whose surveillance may be disproportionately affected by COVID-19 policies. In this population-based study, we aim to evaluate the impact of the COVID-19 pandemic on the incidence and mortality rates, treatment, and outcomes of HCC in the United States.
METHODS Data source and collectionHCC cases were procured from the United States Cancer Statistics (USCS) database, which comprised the National Program of Cancer Registries and Surveillance, Epidemiology, and End Results (SEER) databases (17,18). The National Program of Cancer Registries is a Centers for Disease Control (CDC)-based program that collects data from cancer registries in 46 states, the District of Columbia, Puerto Rico, the United States (US) Pacific Island Jurisdictions, and the US Virgin Islands (19). The National Cancer Institute's SEER program collects data from cancer registries in several geographical areas covering multiple states (17). The combined database includes data on demographic characteristics (i.e., age, sex, and race) and tumor characteristics (i.e., year of diagnosis, primary tumor site, histological type, and behavior). Variables not included in the USCS database—such as tumor size, grade, American Joint Committee on Cancer (AJCC) staging, and treatment—were procured from the SEER 17 database, which covers 26.5% of the US population (20). Cases of HCC were identified using the International Classification of Diseases for Oncology, third edition site code C22.0 and histology codes 8170–8175 (21). HCC cases diagnosed before 2004 were excluded from the analyses because of the lack of granular information including tumor size, AJCC tumor stage, and serum AFP level.
Mortality data for HCC were obtained from the National Vital Statistics System (NVSS) database, an intergovernmental data-sharing program run by the National Center of Health Statistics and covers >99% of the US population (22). Causes of death are obtained from an individual's death certificate, and those with ICD-10 code C22.0 (liver cell carcinoma) were included.
Last, HCC cases identified from the SEER 17 database were used for survival analyses. Patients were excluded from the survival analysis if (i) the patient had no follow-up period (i.e., survival months = 0) after diagnosis (n = 12,689), (ii) the patient was diagnosed on the basis of a death certificate only or newly diagnosed at autopsy (n = 1,802), OR (iii) incomplete survival dates were available (n = 406).
The study was exempted from Institutional Review Board review because it involved the analysis of a deidentified data set.
Study variablesStudy variables from the USCS databases include sex (male or female), age category (<50, 50–64, and > 65 years old), race/ethnicity (non-Hispanic White, non-Hispanic Black, non-Hispanic Asian and Pacific Islander, non-Hispanic American Indian/Alaska Native, and Hispanic), tumor stage (localized, regional, or distant), and geographic region (Northeast, Midwest, South, and West). Variables exclusive to the SEER 17 database include rural/urban counties stratified by population size, regions stratified by annual median household income (adjusted to the inflation in 2021), serum AFP category (positive/elevated, borderline, and negative/normal), liver fibrosis status (Ishak fibrosis scores 0–4 vs 5–6), tumor grade, tumor size/size category, AJCC tumor stage, and treatment. The study timeline was divided according to the timeframes of the AJCC staging edition (i.e., 2004–2009, corresponding to the sixth edition, 2010–2017 for the seventh edition, and 2018 onward for the eighth edition) to accurately present the staging data. Cases of HCC diagnosed in 2020 were classified as “pandemic cases” and presented separately in each table; cases diagnosed in previous years were classified as “prepandemic cases.”
Treatments were categorized into curative-intent treatments, noncurative treatments, other/unknown treatments, and no treatment. Curative-intent treatments include tumor ablation (surgery site codes: 10–17), liver resection (surgery site codes: 20–26, 30, 36–38, 50–52, 59, and 90), and liver transplantation (surgery site codes: 60–61 and 75). Noncurative treatments include other liver-directed treatment and systemic treatment.
Statistical analysisDemographic and clinical variables of HCC patients were presented as frequencies and percentages. The Pearson χ2 test was used to evaluate for differences in distribution between the year groups for all categorical variables, and analysis of variance or the Mann-Whitney-Wilcoxon test was applied to compare the differences among continuous variables as appropriate.
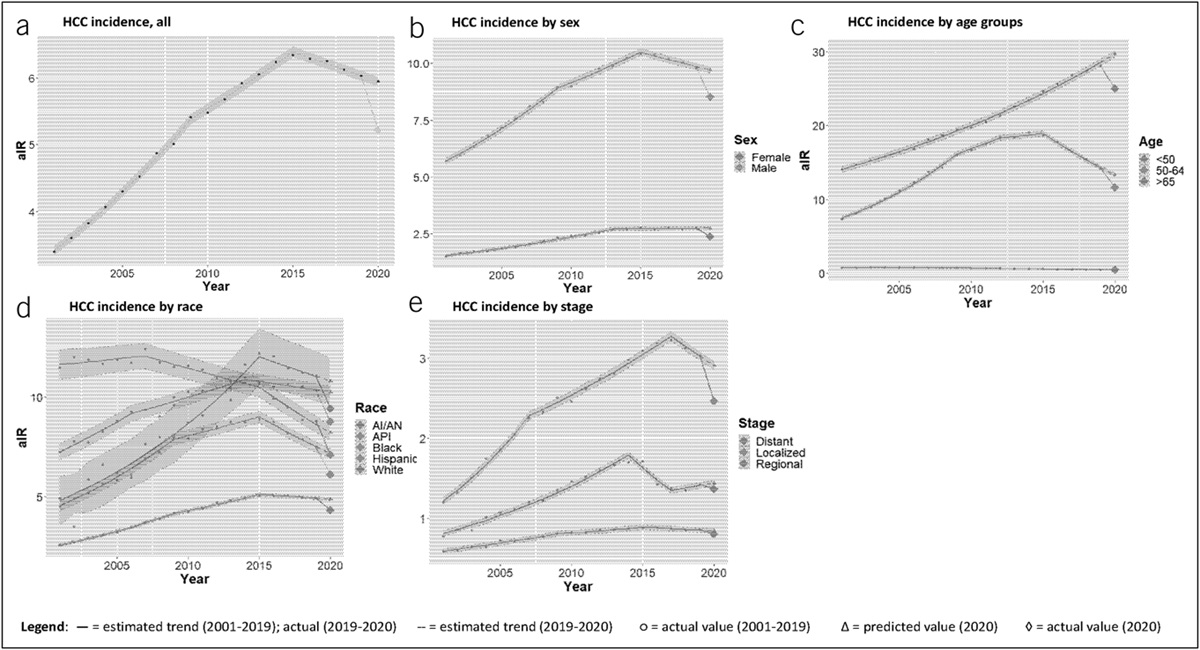
Adjusted incidence rate (aIR) and adjusted mortality rate (aMR) of HCC per 100,000 population (age-adjusted to the 2000 US population) from 2001 to 2020 were obtained from the USCS and NVSS databases, respectively. aIR and aMR were calculated for the pandemic year (2020) and compared with the aIR and aMR of the 2 years immediately before the pandemic (2018 and 2019). Trends in HCC incidence and mortality from 2001 to 2019 were calculated using a grid search method (23). The prepandemic annual percentage change (APC) and average APC (AAPC) were obtained for overall cases and for cases stratified by basic demographic variables. The empiric quantile method was used to estimate 95% confidence intervals (CIs) for the APC and AAPC, and the weighted BIC method was used to select the optimal trends model (24,25). Estimated aIR for 2020 was calculated by adding the 2019 aIR to the AAPC of prepandemic trend; this value was compared with the actual measured aIR in 2020, and the difference was reported as the percentage undiagnosed. A similar approach was used to calculate the percentage undiagnosed for aMR, using the corresponding values.
Kaplan-Meier survival curves were plotted to compare monthly overall survival (OS) for individuals diagnosed with HCC in 2004–2009, 2010–2017, 2018–19, and 2020; percentage survival at 3, 6, 9, and 11 months for each timeframe was calculated. Univariate and multivariable Cox proportional hazard models were applied to examine the demographic and clinical variables associated with OS. Missing values among the variables included in the Cox proportional hazard model were imputed using the multiple imputations by chained equations algorithm to reduce the potential bias (26). In brief, a total of 5 complete data sets were generated. The regression estimates represent the average coefficients of the 5 complete data and the variance equal to the imputation-corrected variance-covariance matrix.
The SEER*Stat and CDC-WONDER software were used to procure data from the USCS/SEER and NVSS databases, respectively (27,28). The Joinpoint Regression program v5.0.1 (National Cancer Institute) was used to estimate trends (29,30). All other statistical analyses were performed using R statistical software (version 4.2.2; R Foundation, Vienna, Austria) (31) with 2-sided tests and a significance level of 0.05 (Bonferroni correction was used to account for multiple comparisons).
RESULTS Demographic and clinical characteristics of HCC cases before and during the COVID-19 pandemicA total of 345,708 cases of HCC were identified from the USCS database from 2004 to 2020 (Table 1). The patients were mostly male (77.0%) and White (59.4%), and the most common age group was ≥65 years (47.4%). During this time frame, the relative proportion of incident cases has increased in women (22.9% in 2004–2009 to 24.1% in 2020) and in those ≥65 years of age (43.3% in 2004–2009 to 60.9% in 2020). The age and racial/ethnic distribution of individuals diagnosed in 2020 differed significantly from those diagnosed in 2018–2019; by contrast, there was no significant difference in the proportion of men and women diagnosed in 2018–2019 compared with 2020 (Table 1).
Table 1. - Demographic, clinical, and treatment characteristics of HCC patients in the USCS database and the SEER 17 database during 2004–2020 Characteristics (USCS database) Year of diagnosis P valuea (overall) P valuea (2018–19 vs 2020) 2004–2009 (n = 89,134) 2010–2017 (n = 183,412) 2018–2019 (n = 51,217) 2020 (n = 21,945) Age group, n (%) <0.001 <0.001 <50 yr 9,387 (10.5) 9,728 (5.30) 1,895 (3.70) 841 (3.83) 50–64 yr 41,151 (46.2) 90,980 (49.6) 20,201 (39.4) 7,736 (35.3) ≥65 yr 38,596 (43.3) 82,704 (45.1) 29,121 (56.9) 13,368 (60.9) Sex, n (%) <0.001 0.21 Female 20,431 (22.9) 41,744 (22.8) 12,097 (23.6) 5,278 (24.1) Male 68,703 (77.1) 141,668 (77.2) 39,120 (76.4) 16,667 (75.9) Race/ethnicity, n (%) <0.001 <0.001 Non-Hispanic White 52,756 (59.2) 108,603 (59.2) 30,609 (59.8) 13,252 (60.4) Non-Hispanic Black 13,434 (15.1) 28,695 (15.6) 7,278 (14.2) 2,935 (13.4) Non-Hispanic AI/AN 838 (0.9) 2,123 (1.2) 646 (1.3) 279 (1.3) Non-Hispanic API 8,505 (9.54) 14,386 (7.84) 3,747 (7.32) 1,547 (7.0) Hispanic 13,601 (15.3) 29,605 (16.1) 8,937 (17.4) 3,932 (17.9) Characteristics (SEER 17 database)b 2004–2009 (n = 27,166) 2010–2017 (n = 52,624) 2018–2019 (n = 14,230) 2020 (n = 6,173) P value (overall) P value (2018–19 vs 2020) Rural/urban counties, n (%) <0.001 0.004 Nonmetro/rural 2,363 (8.7) 4,997 (9.5) 1,442 (10.2) 676 (11.0) Metro <250,000 1,856 (6.8) 3,688 (7.0) 1,067 (7.5) 530 (8.6) Metro 250,000–1 million 5,275 (19.4) 11,506 (21.9) 3,219 (22.7) 1,422 (23.1) Metro >1 million 17,633 (65.0) 32,336 (61.6) 8,470 (59.7) 3,534 (57.4) Median household income, n (%) <0.001 <0.001 <$45,000 858 (3.2) 3,134 (6.0) 589 (4.1) 240 (3.9) $45,000–$60,000 4,336 (16.0) 10,142 (19.3) 2,452 (17.2) 1,067 (17.3) $60,000–$75,000 10,017 (36.9) 20,777 (39.5) 3,845 (27.0) 1,222 (19.8) >$75,000 11,951 (44.0) 18,559 (35.3) 7,341 (51.6) 3,643 (59.0) Serum AFP level, n (%) <0.001 0.03 Positive/elevated 14,674 (77.5) 28,470 (72.1) 7,253 (67.6) 3,050 (65.4) Negative/normal 4,187 (22.1) 10,915 (27.6) 3,441 (32.1) 1,598 (34.3) Borderline 66 (0.3) 94 (0.2) 38 (0.4) 15 (0.3) Fibrosis score, n (%)c <0.001 0.83 Ishak 0–4 1,293 (23.8) 2,496 (18.2) 573 (20.1) 197 (19.7) Ishak 5–6 4,135 (76.2) 11,254 (81.8) 2,282 (79.9) 804 (80.3) Grade, n (%)c <0.001 0.002 Well-differentiated 3,426 (34.1) 4,980 (29.9) 1,324 (29.8) 543 (27.6) Moderately differentiated 4,150 (41.4) 7,791 (46.8) 2,156 (48.6) 1,042 (52.9) Poorly differentiated 2,240 (22.3) 3,562 (21.4) 932 (21.0) 382 (19.4) Undifferentiated 220 (2.2) 302 (1.8) 27 (0.6) 3 (0.2) Tumor size <0.001 0.01 Median (Q1, Q3) 50.0 (30.0, 80.0) 44.0 (26.0, 75.0) 43.0 (26.0, 77.0) 45.0 (27.0, 80.0) Tumor size category, n (%) <0.001 0.004 Tumor ≤2 cm 2,419 (12.1) 6,137 (14.3) 1,678 (14.2) 672 (13.1) Tumor 2–5 cm 7,423 (37.1) 17,822 (41.5) 4,943 (41.7) 2,062 (40.1) Tumor ≥5 cm 10,164 (50.7) 18,895 (44.0) 5,225 (44.1) 2,404 (46.8) No primary tumord 29 (0.1) 48 (0.1) 6 (0.1) 2 (0.0) SEER combined summary stage (USCS data), n (%) <0.001 <0.001 Localized 40,443 (53.0) 88,285 (54.7) 26,007 (57.9) 10,362 (53.2) Regional 22,043 (28.9) 47,311 (29.3) 11,735 (26.1) 5,754 (29.5) Distant 13,870 (18.2) 25,847 (16.0) 7,188 (16.0) 3,367 (17.3) AJCC T stage, n (%) <0.001 0.002 T0 29 (0.1) 48 (0.1) 17 (0.1) 6 (0.1) T1 9,606 (35.4) 20,037 (38.1) 6,198 (43.6) 2,592 (42.0) T2 5,327 (19.6) 10,543 (20.0) 2,680 (18.8) 1,118 (18.1) T3 5,644 (20.8) 12,061 (22.9) 1,707 (12.0) 823 (13.3) T4 1,122 (4.1) 1,632 (3.1) 1,746 (12.3) 841 (13.6) TX 5,438 (20.0) 8,303 (15.8) 1,882 (13.2) 793 (12.8) AJCC N stage, n (%) <0.001 0.04 N0 19,575 (72.1) 41,509 (78.9) 11,214 (78.8) 4,827 (78.2) N1 1,628 (6.0) 3,433 (6.5) 992 (7.0) 492 (8.0) NX 5,963 (22.0) 7,682 (14.6) 2,024 (14.2) 854 (13.8) AJCC M stage, n (%) <0.001 0.60 M0 19,151 (70.5) 44,648 (84.8) 12,301 (86.4) 5,319 (86.2) M1 4,018 (14.8) 6,850 (13.0) 1,928 (13.5) 854 (13.8) MX 3,997 (14.7) 1,126 (2.1) 1 (0.0) 0 (0.0) Treatment, n (%) <0.001 <0.001 No treatment 12,689 (46.7) 19,801 (37.6) 5,056 (35.5) 2,507 (40.6) Curative treatment 6,859 (25.2) 11,856 (22.5) 3,349 (23.5) 1,417 (23.0) Noncurative treatment 7,055 (26.0) 19,779 (37.6) 5,369 (37.7) 2,033 (32.9) Other/unknown 563 (2.1) 1,188 (2.3) 456 (3.2) 216 (3.5)AFP, α-fetoprotein; AI/AN, American Indian/Alaskan Native; AJCC, American Joint Committee on Cancer; API, Asian/Pacific Islander; HCC, hepatocellular carcinoma; SEER, Surveillance, Epidemiology, and End Results; USCS, United States Cancer Statistics.
aP value <0.002 denotes significance (Bonferroni correction).
bThe percentages were calculated after excluding the unknown cases or missing values.
cThere was a high proportion of the cases with unknown information for the Ishak fibrosis score (77,159 cases) and tumor grade (67,113 cases).
dNo primary tumor indicates that no mass or tumor was found in the liver. This might occur, for example, when a tumor is not detected in the liver, but there is evidence of metastasis.
A total of 100,193 HCC cases were reported in the SEER 17 database (29.0% of the USCS database) during the same study period, of whom 6,173 were diagnosed in 2020. Demographic and clinical characteristics are detailed in Table 1. There was no significant difference in tumor size, N-stage, M-stage, or proportion of curative treatment between patients diagnosed in 2018–2019 vs those diagnosed in 2020. However, those diagnosed in 2020 presented with significantly more advanced T-stage than those diagnosed between 2018 and 2019 and were more likely to receive no treatment (40.6% vs 35.5%, P < 0.001). This difference seems to be primarily driven by patients with regional or distant stage tumor—65.2% of individuals in 2020 diagnosed with distant stage cancer received no treatment (compared with 56.1% of individuals diagnosed in 2018–2019, P < 0.001, Table 2), and 42.9% of individuals diagnosed with regional stage cancer in 2020 did not receive treatment (compared with 34.8% in 2018–2019, P < 0.001). However, the proportion of patients who received curative treatment remained unchanged, and there was no significant difference in treatment types among those with localized tumors.
Table 2. - Comparison of treatment types for HCC patients in 2018–19 vs 2020, stratified by stage, in the SEER 17 database Treatment type Stage Localized Regional Distant 2018–2019, n (%) 2020, n (%) P value 2018–2019, n (%) 2020, n (%) P value 2018–2019, n (%) 2020, n (%) P value No treatment 1297 (24.0) 563 (24.8) 0.51 1857 (34.8) 1015 (42.9) <0.001 1107 (56.1) 579 (65.2) <0.001 Curative treatment 2198 (40.6) 915 (40.3) 1036 (19.4) 458 (19.3) 58 (2.94) 27 (3.04) Noncurative treatment 1908 (35.3) 789 (34.7) 2438 (45.6) 887 (37.5) 802 (40.6) 181 (31.6) Unknown treatment 7 (0.13) 6 (0.26) 10 (0.19) 8 (0.34) 8 (0.41) 1 (0.11)HCC, hepatocellular carcinoma; SEER, Surveillance, Epidemiology, and End Results.
Bold indicates P < 0.05.
aIR and trends in HCC incidence are shown in Table 3 and Figure 1. In 2020, 21,945 HCC cases (aIR 5.22, 95% CI 5.15–5.29) were diagnosed, significantly fewer than those diagnosed in the 2 previous years (25,637 [aIR 6.03, 95% CI 5.95–6.10] in 2019 and 25,580 [aIR 6.12, 95% CI 6.04–6.20] in 2018). Based on the 2015–2019 AAPC of −1.44%, the predicted aIR in 2020 is 5.94; the actual aIR is 12.20% lower than predicted, which was outside the predicted 95% CI (5.87–6.01).
Table 3. - Age-adjusted rates (per 100,000) and trends of HCC incidence in the USCS database and mortality in the NVSS database Characteristic 2018
Comments (0)