
Remember me


Eosinophilic gastrointestinal diseases (EGIDs) are diagnosed by a broad range of gastrointestinal (GI) symptoms in the presence of mucosal eosinophilia, after the exclusion of other etiologies. With a widely accepted cutoff of ≥15 eosinophils per high-power field (eos/HPF) (1), the diagnosis of eosinophilic esophagitis (EoE) is considerably more straightforward compared to the nonesophageal mucosa, where eosinophils naturally reside. As the healthy esophageal mucosa is devoid of eosinophils, any infiltration likely reflects a pathology.
Beyond the esophagus, the mucosal architecture consisting of villi and crypts often leads to variable empty areas in conventional microscopic HPFs, complicating the harmonization of histological procedures and the unification of cutoffs. Consequently, applying the same esophageal counting paradigm in the distal GI tract could be problematic.
Efforts to establish normal eosinophil ranges in the GI tract were undertaken for multiple GI sites, although often limited to retrospective pediatric studies and affected by high variability and methodological heterogeneity (2–6).
Discriminating normal from pathological eosinophil infiltration is not only relevant in EGIDs but also in highly common but difficult-to-diagnose disorders such as functional dyspepsia (FD) and irritable bowel syndrome. A recent meta-analysis confirmed increased duodenal eosinophil infiltration in FD but highlighted the heterogeneity across the literature, further emphasizing the need for standardization (7). Similar limitations exist for histological mast cell quantification (8–11).
The first aim of this study was to standardize routine histological procedures in the duodenum using digitized biopsy slides to overcome the limitations in current intestinal cell quantification practice beyond the esophagus. In addition, we applied this method to a prospectively recruited cohort of healthy volunteers to establish robust normal eosinophil and mast cell ranges in the duodenum.
METHODS Study samplesParticipants underwent gastroduodenoscopy with collection of duodenal (D2) biopsies at the Endoscopy Unit of the University Hospitals Leuven, Belgium (development cohort and healthy control cohort), or at John Hunter Hospital, Gosford Hospital, or Wyong Hospital in New South Wales, Australia (validation cohort). Procedures were conducted in accordance with the Declaration of Helsinki and Good Clinical Practice regulations. All participants signed written informed consent before inclusion.
Development cohortStandard microscopy slides from previously collected duodenal biopsies of patients with FD (Rome IV) and age- and sex-matched healthy controls (HCs) without GI symptoms (12) were used to develop a standardized histological evaluation protocol. Participants were men or women aged 18–64 years, without a major inflammatory or metabolic condition, Helicobacter pylori negative, and not taking proton pump inhibitors (PPIs) in the 3 months before inclusion. Patients with FD recorded their symptoms at the time of endoscopy via the Patient Assessment of Upper GI Symptom Severity Questionnaire. The study was approved by the UZ Leuven Ethics Committee (S60953 and S60984).
Validation cohortThe software-based quantification method was validated using duodenal biopsy slides from patients with FD (Rome III) and non-FD cases (13). Non-FD cases were patients requiring endoscopy as part of routine clinical care but who did not meet Rome III criteria for FD. Participants were men or women aged 18–80 years not taking PPI less than 3 months before inclusion. Ethical approval was granted by the Hunter New England Human Research Ethics Committee (H-2014-0222).
Healthy control cohortIn addition to the HCs in the development cohort, duodenal biopsy sections obtained from HCs in 2 other prospective studies at the UZ Leuven were evaluated, for which ethical approval was granted by the UZ Leuven Ethical Committee (S64847 and S65020). HCs were men or women aged 18–64 years without GI symptoms and any other inflammatory or metabolic conditions, recruited via advertisement.
Histological proceduresFormalin-fixed and paraffin-embedded biopsies were sectioned at 5 μm before hematoxylin and eosin (H&E) staining or immunohistochemical (IHC) cKit staining. A subset of slides was immunohistochemically stained for eosinophil-derived neurotoxin (EDN). Additional details are provided in the Supplementary Methods (see Supplementary Digital Content 1, https://links.lww.com/CTG/B147).
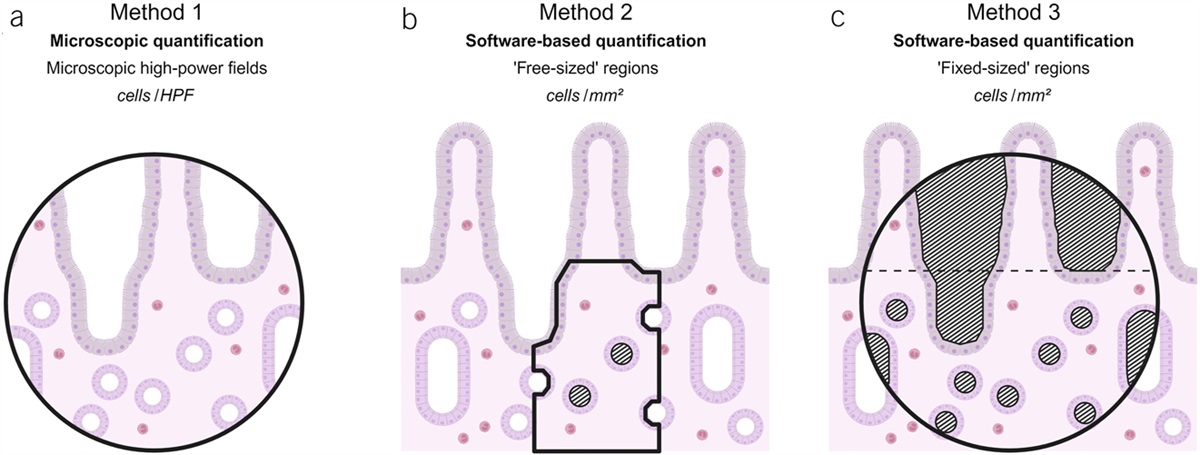
Microscopic quantification Method 1H&E-stained slides were microscopically evaluated at the UZ Leuven Pathology Unit using an Orthoplan widefield microscope (×400 total magnification, HPF = 0.264 mm2; Leitz) by 3 assessors. Each assessor independently selected 3 fields of view, primarily based on optimal longitudinal villus-crypt orientation, attempting to maximize tissue coverage (Figure 1a). Lymphoid follicles and Brunner glands were avoided. Eosinophils were counted in the mucosa (from, but not including, the muscularis mucosae to the villus tip), with the average counts of 3 HPFs per slide (mean eos/mm2) and the HPF with the highest cell density (peak eos/mm2) reported.
 Figure 1.: Eosinophils were quantified microscopically per high-power field (a) and digitally using free-sized (b) or fixed-sized (c) regions. Regions are delineated by a black line; hatched regions represent excluded segments. In method 3, lower lamina propria and villi are divided by the dashed line. Created with BioRender.com.Software-based quantification
Stained slides were digitized using Aperio CS2 or AT2 scanners (Leica Biosystems, Wetzlar, Germany) in Leuven or Newcastle, respectively, and analyzed in ImageScope software (version 12.4.3; Leica Biosystems). Blank, that is, uncovered, spaces, major blood vessels, and technical artifacts were excluded by negative selection. Eosinophils, enumerated at high magnification (×400) in 3 nonoverlapping regions, were divided by the included tissue area and expressed as the area-weighted average of 3 regions (mean eos/mm2) or the single region with highest eosinophil density (peak eos/mm2).
Method 2Three assessors counted eosinophils in independently chosen regions of variable size (free-sized). Within longitudinally oriented tissue, suitable regions were defined as the portion of lamina propria subjacent to a single well-oriented villus (Figure 1b).
Method 3Next, the protocol was refined by applying a circular mask with the diameter of a microscopic HPF (0.264 mm2) to evaluate fixed-sized regions (Figure 1c). Two assessors counted eosinophils in independently chosen regions per aforementioned guidelines. This final software-based method will be referred to as Leuven Intestinal Counting Protocol (LICP) from here on. The LICP was validated by evaluation of H&E-stained slides of an independent Australian cohort by 3 assessors. In a randomly selected subset of slides, eosinophils were also enumerated on EDN-stained sections by a single assessor using the LICP approach. Lastly, a single assessor quantified duodenal eosinophils (H&E) and mast cells (cKit) on slides of 70 HCs using the LICP to establish normal duodenal eosinophil and mast cell ranges.
Statistical analysisData were analyzed by parametric ((un)paired t test and Fisher exact test) or nonparametric tests (Wilcoxon or Mann-Whitney U test and Friedman test with Dunn post hoc test) depending on the Gaussian distribution in GraphPad Prism software (version 9.5.1). Normal cell ranges were determined based on the 95th percentile values of the extended HC cohort. Additional details are outlined in the Supplementary Methods (see Supplementary Digital Content 1, https://links.lww.com/CTG/B147).
RESULTS Microscopic quantificationDuodenal H&E-stained biopsy sections of 28 patients with FD (32 ± 12 years; 24 women, 86%) and 30 HCs (31 ± 11 years; 21 women, 70%) were microscopically evaluated by 3 independent assessors (Figure 1a). Mean eosinophil counts were similar between HC and FD for all assessors (8.2 ± 4.5 eos/HPF vs 6.7 ± 3.5, P = 0.15; 6.7 ± 3.4 vs 7.7 ± 3.7, P = 0.28; 10.8 ± 4.7 vs 11.7 ± 6.1, P = 0.51) (Figure 2). Similar results were found for the peak eosinophil counts (see Supplementary Results, Supplementary Digital Content 1, https://links.lww.com/CTG/B147). Inter-rater consistency for mean counts was good (ICC-C = 0.796), with moderate absolute agreement (ICC-A = 0.708).
 Figure 2.:
 Mean duodenal eosinophils across 3 microscopic high-power fields (HPFs) were similar between healthy controls (HCs) and patients with functional dyspepsia (FD) for 3 assessors (P > 0.05). Intraclass correlation coefficients indicate the consistency (ICC-C) and agreement (ICC-A) between assessors.
Software-based quantification in free-sized regionsNext, we attempted to improve histological quantification by software-based enumeration of cells on digitized slides, enabling the exclusion of blank spaces between villi or artifacts (Figure 1b).
Eosinophil counts in 3 independently chosen regions of variable size by each assessor were lower in HC compared to FD for 2 assessors (140.4 ± 78.3 eos/mm2 vs 193 ± 90.6, P = 0.028; 114.6 ± 48.4 eos/mm2 vs 334.1 ± 91.4, P < 0.0001) but not for the third assessor (179.5 ± 93.9 vs 170.5 ± 71.8; P = 0.69) (see Supplementary Figure 1B, Supplementary Digital Content 2, https://links.lww.com/CTG/B148). Reliability among assessors was moderate (ICC-C = 0.644, ICC-A = 0.619). The combined included area per slide differed significantly between assessors (0.26 ± 0.07 mm2 vs 0.10 ± 0.03 vs 0.04 ± 0.01; all Padj < 0.0001) (see Supplementary Figure 1C, Supplementary Digital Content 2, https://links.lww.com/CTG/B148). The combined included area of 3 regions was also considerably smaller for the 2 raters that reported differences between groups, compared to the size of a single microscopic HPF (0.264 mm2; both P < 0.0001) (see Supplementary Figure 1C, Supplementary Digital Content 2, https://links.lww.com/CTG/B148), posing a significant risk of underrepresenting the biopsy tissue as a whole.
Software-based quantification in fixed-sized regionsTo overcome this problem, we refined our software-based quantification method by applying larger fields of view with a fixed size corresponding to the size of a microscopic HPF (0.264 mm2), again excluding blank spaces (Figure 1c). On average, the tissue area included per region using this LICP was 58% (range 32%–84%) of the size of a microscopic HPF, corresponding to 0.153 mm2 (0.084–0.222 mm2) of tissue area (Figure 3a). This highlights once more the variability induced by microscopic counting per HPF, which does not account for the poor and variable tissue coverage.
 Figure 3.:
 (a) Average tissue coverage of a microscopic high-power fields (HPFs, 0.264 mm2) was only 58% (range 32%–84%). (b) Eosinophils were more abundant in the lower lamina propria (“intercrypt” [IC] region) compared to the villi (V) (P < 0.0001). (c) Mean eosinophil counts across 3 regions were similar between healthy controls (HCs) and patients with functional dyspepsia (FD) for 2 assessors (P > 0.05). Intraclass correlation coefficients indicate the consistency (ICC-C) and agreement (ICC-A) between assessors.
Since the intercrypt (IC) region harbors most mucosal eosinophils (Figure 3b, see Supplementary Results, Supplementary Digital Content 1, https://links.lww.com/CTG/B147) and villi exhibit a wide variety in size and shape, the fields of view were focused on the IC region for the remainder of the project. Mean duodenal eosinophils were similar between HC and FD for 2 assessors using the LICP (222.7 ± 70.9 eos/mm2 vs 215.8 ± 78.9, P = 0.73; 172.7 ± 70.6 vs 170.2 ± 63.3; P = 0.89) (Figure 3c). Inter-rater consistency was excellent and significantly increased compared to microscopic evaluation (ICC-C = 0.909, P = 0.0014), while absolute agreement was numerically increased (ICC-A = 0.809, P = 0.38). The combined included area per slide was comparable between assessors (0.369 ± 0.066 mm2 vs 0.361 ± 0.11; P = 0.54), indicating that the risk of bias in terms of area selection with the LICP approach is low. Lastly, duodenal eosinophil counts tended to correlate with general GI symptoms in patients with FD (ρ = 0.36, P = 0.06) (see Supplementary Figure 2, Supplementary Digital Content 3, https://links.lww.com/CTG/B149).
Validation in an independent cohortThe LICP approach was validated by re-evaluation of digitized H&E-stained slides obtained from an Australian cohort of 18 patients with FD (46 ± 18 years; 15 women, 83%) and 19 non-FD subjects (57 ± 10 years, P = 0.026; 11 women, 58%, P = 0.15) by 3 independent assessors. Mean duodenal eosinophil counts were numerically higher in controls compared to FD for 2 assessors (208.7 ± 143.1 eos/mm2 vs 150.8 ± 59, P = 0.30; 176.3 ± 95 vs 130.2 ± 51.5, P = 0.22), reaching significance for the third assessor (308.9 ± 163.2 eos/mm2 vs 210.1 ± 81.2, P = 0.027) (see Supplementary Figure 3A, Supplementary Digital Content 4, https://links.lww.com/CTG/B150). Results were similar for the peak eosinophil counts (see Supplementary Results, Supplementary Digital Content 1, https://links.lww.com/CTG/B147). Nevertheless, consistency between assessors was excellent for mean eosinophil counts (ICC-C = 0.910), validating the high reproducibility of the LICP. Absolute agreement between mean counts of both assessors was good (ICC-A = 0.832).
Specificity of different staining methodsAlthough H&E staining is routinely used for histological examination (Figure 4a), H&E eosinophil counts were compared to IHC staining for EDN (Figure 4b) in a random subsample of 21 subjects (12 HCs and 9 patients with FD). Again, eosinophils were similar between HC and FD (mean: 211.7 ± 93.3 eos/mm2 vs 168.9 ± 69.4, P = 0.26; peak: 254.7 ± 113.8 vs 219.4 ± 67.9, P = 0.60). Eosinophil counts were similar using both staining methods (H&E: 182.7 ± 65.5, IHC: 193.4 ± 84.8; P = 0.55) (Figure 4c). An average bias of 10.6 eos/mm2 toward the IHC staining was observed, indicating minimal difference between both staining methods (Figure 4d).
 Figure 4.:
 (a) Routine hematoxylin and eosin (H&E) staining was compared to (b) immunohistochemical (IHC) staining for eosinophil-derived neurotoxin (EDN). In each representative image, 3 eosinophils are indicated. (c) Duodenal eosinophils in matched duodenal biopsy sections were similar between stainings (P = 0.55). (d) The Bland-Altman plot shows an average bias (mean difference, dashed line) of 10.6 eos/mm2 toward the I staining. Dotted lines represent the 95% confidence interval.
Redefining the normal range of duodenal eosinophils and mast cellsApplying the LICP, eosinophils and mast cells were quantified on digitized H&E- and cKit-stained slides, respectively, from 70 healthy controls (30 ± 10 years; 48 women, 69%). Mean duodenal eosinophils were 228.8 ± 94.7/mm2 (Figure 5a), while mast cells were on average 419.5 ± 132.2/mm2 (Figure 5b). Based on the 95% percentile values (eosinophils: 402.8/mm2; mast cells: 707.6/mm2), a cutoff of 400 eosinophils/mm2 and 700 mast cells/mm2 can be used to define abnormal infiltration. Female sex tended to be associated with higher duodenal eosinophils (P = 0.078) but not mast cells (P = 0.14), without effect of age (eosinophils: P = 0.73, mast cells: P = 0.85). In addition, eosinophil and mast cell infiltration in the healthy duodenum correlated positively (r = 0.25, P = 0.041).
 Figure 5.:
 Eosinophils (hematoxylin and eosin staining, H&E) and mast cells (cKit staining) were quantified in duodenal biopsy sections of healthy adults using the Leuven Intestinal Counting Protocol. Based on the 95th percentile values (402.8 eosinophils/mm2 and 707.6 mast cells/mm2), a cutoff of 400 eosinophils/mm2 (a) and 700 mast cells/mm2 (b) is indicative of abnormal duodenal infiltration (dashed lines).
DISCUSSIONThe lack of uniform histological cell quantification procedures beyond the esophagus, for eosinophils in particular, impedes comparisons across literature, unification of cutoff values for pathological infiltration, and definition of reference ranges in the healthy small intestine. Here, we present a novel and standardized method, the LICP, for the enumeration of duodenal eosinophils using digitized slides, which demonstrated enhanced reproducibility over traditional microscopic eosinophil quantification. Application of this software-based method to a cohort of true healthy volunteers identified accurate eosinophil and mast cell cutoff values for abnormal infiltration in the duodenum.
The distinction between normal and pathological eosinophil infiltration beyond the esophagus is challenging. However, eosinophil enumeration to date has been performed in all GI sites by the same procedures, despite the profound differences in mucosal architecture along the GI tract, which calls for site-specific approaches. Using digitized slides, we demonstrated that only slightly more than half of the surface area per well-oriented duodenal HPF is covered by tissue due to the typical crypt-villus architecture. Histopathology guidelines recommend the microscopic field of view to be covered by tissue as much as possible to minimize the risk of underrepresentation (14). However, this approach often sacrifices an optimal tissue orientation in favor of maximal coverage. Therefore, the importance of well-oriented fields of view, as well as normalization to the tissue area included and not to an HPF itself, should be acknowledged.
Especially in disorders where the immune cell infiltrate is thought to be only slightly elevated such as FD or irritable bowel syndrome, subtle methodological differences can bias results and conclusions. Our data showing similar eosinophil counts between FD and HC are at variance with previously reported increased eosinophil counts in FD both by our group and others (7,12), even if several other groups could not detect duodenal eosinophilia in FD (15,16). The current analysis does not invalidate a role for duodenal eosinophils, as GI symptoms tended to correlate with duodenal eosinophil counts in this patient cohort, but it does highlight that results are dependent on the methodology used and that standardization is warranted. Moreover, it is advisable to also focus on activation status of eosinophils rather than only eosinophil counts in disorders with limited immune activation like FD (17,18).
A similar caveat also applies to EGIDs, where a large proportion of patients present with eosinophil counts that are on the borderline of the diagnostic cutoff value (19). In addition, monoclonal antibody therapies under investigation for these difficult-to-treat conditions have failed to reach sufficient symptom relief despite marked histological improvement (20). This may be attributed to the shortcomings in current diagnostic criteria for patient selection, including histologic quantification and cutoffs, while the current lack of standardization also acts as a roadblock for further mechanistic studies.
Recently, Dellon et al. (21) facilitated the clinical diagnosis of EGIDs by determining optimal eosinophil cutoffs based on a single HPF, which could accelerate the diagnosis of eosinophilic gastritis and eosinophilic duodenitis without impacting sensitivity. In contrast, the main purpose of our methodological study was to improve and standardize histological cell counts. This workflow could be applied as a diagnostic tool, but importantly, it also enables quantitative pathophysiological research to yield reliable insights in the role of mucosal immune infiltration in relation to gene expression and other mucosal disturbances including altered permeability. In addition, the field of pathology is rapidly evolving toward a digitalized discipline where cutoffs expressed per HPF will become less relevant. Here, we show increased reliability of digital cell counts compared to microscopic quantification, which is an additional argument to shift the quantification of intestinal eosinophils and mast cells toward software-based approaches.
Furthermore, our current knowledge on normal intestinal eosinophil ranges is largely based on retrospective pediatric studies. However, eosinophil counts in pediatric EGIDs differ from those of adult patients (22), questioning the reliability of extrapolating pediatric ranges to cutoffs for adults. In addition, a multitude of cutoffs for duodenal eosinophils is found in the literature, ranging from ≥20 eos/HPF (23,24), over ≥30 eos/HPF in ≥3 HPFs (19,25–27), to ≥52 eos/HPF in a single HPF (28,29), which profoundly affects patient inclusion and histological outcomes in clinical studies on EGIDs. Applying the LICP approach on a large cohort of adult healthy controls, we proposed novel thresholds of 400 eosinophils/mm2 and 700 mast cells/mm2 for abnormal duodenal infiltration, by defining the upper limit of normal in health. These numbers transcend most other estimations across literature (4), although higher cell counts in general can be explained by the tissue area normalization, meanwhile removing the bias that was naturally introduced by the blank spaces in HPFs. Taken together, our approach identifies any abnormal leukocyte infiltration, irrespective of the disease investigated.
H&E staining is routinely used to quantify eosinophils, while IHC alternatives are available, but require specific staining. In this study, eosinophil counts were similar between H&E and IHC EDN staining. Although this contrasts with higher counts in nasal polyps using IHC staining for major basic protein compared to H&E (30), our findings suggest that immunohistochemistry can be omitted for duodenal histology.
The strengths of this study include the strict selection of participants and the exclusion of potential confounding therapies such as PPI or anti-inflammatory drugs, which ensures reliable results. To our knowledge, this is the first report of normal intestinal eosinophil and mast cell ranges in a prospectively recruited cohort of true healthy controls, contrasting with the retrospective selection of patients who underwent endoscopy for suspected GI malignancies or other GI symptoms (4,6). Furthermore, this adult healthy cohort is also an important gain to the large body of literature describing pediatric normal ranges. In addition, we implemented the latest recommendations for histological practices in the intestine to match the current methodological standards in the field (14). Lastly, this standardized protocol is broadly applicable to multiple GI regions and various cell types beyond eosinophils and mast cells and was easily applied in an independent center.
In addition, we acknowledge the following limitations. A positive confirmation of the methodology in a cohort of patients with suspected primary non-EoE EGID is currently lacking, which is an essential subject for future studies and will be an additional confirmation of its performance. Second, relatively small sample sizes in the development and validation cohort were included, although the results on normal eosinophil and mast cell ranges were obtained from larger group of healthy controls. Finally, all healthy volunteers were recruited in 1 center, including only European, White individuals, which warrants future investigation on the effect of geographic area and race.
In conclusion, the LICP is a novel software-based approach to histological cell quantification in the small intestine using digitized slides. It effectively minimized bias and increased representativeness compared to traditional microscopic evaluation, while its excellent reproducibility was validated in an independent cohort. Applying this method to a cohort of true healthy adults indicated that 400 eosinophils/mm2 and 700 mast cells/mm2 can be used as a threshold for abnormal duodenal infiltration. Ultimately, the implementation of this novel method could improve the challenging diagnosis of non-EoE EGIDs, which will assist in the differentiation and classification of immune-mediated disorders.
CONFLICTS OF INTERESTGuarantor of the article: Tim Vanuytsel, MD, PhD.
Specific author contributions: M.C.: conceptualization equal; methodology lead; formal analysis lead; investigation equal; writing—original draft lead; visualization lead; project administration lead. P.H.: methodology supporting; formal analysis supporting; investigation equal; writing—review and editing supporting. G.D.H.: conceptualization supporting; methodology supporting; investigation equal; resources equal; writing—review and editing supporting. R.C.: formal analysis supporting; investigation equal; writing—review and editing supporting. J.S. and G.L.B.: resources equal; writing—review and editing supporting. SK: writing—review and editing supporting. L.W.: methodology supporting; formal analysis supporting; resources equal; investigation equal; writing—review and editing supporting. J.T. and N.J.T.: writing—review and editing supporting; supervision supporting; funding acquisition equal. T.V.: conceptualization equal; methodology supporting; writing—original draft supporting; supervision lead; funding acquisition equal.
Financial support: T.V. is supported by Flanders Research Foundation (FWO) through a senior clinical research mandate (1830517N) and a research grant (G059822N). J.S. is supported by Flanders Research Foundation (FWO) through a doctoral fellowship (11C4921N). J.T. is supported by a Methusalem grant of KU Leuven (EZX-C9725-METH/14/05). N.J.T. is supported by funding from the National Health and Medical Research Council (NHMRC) to the Centre for Research Excellence in Digestive Health and he holds an NHMRC Investigator grant.
Potential competing interests: N.J.T. reports personal fees from Allakos (gastric eosinophilic disease, 2021) and Dr Falk Pharma (eosinophilic esophagitis, 2020). The other authors report no conflicts relevant to the contents of this study.
Data transparency statement: Data are available upon reasonable request.
Study Highlights
WHAT IS KNOWN ✓ Gastrointestinal eosinophilia and eosinophilic gastrointestinal diseases are increasingly diagnosed. ✓ Diagnostic criteria and methodologies vary widely, highlighting the need for standardization in clinical and research settings. WHAT IS NEW HERE ✓ The Leuven Intestinal Counting Protocol is a standardized, software-based quantification method that improves the reproducibility of histological cell counts in the duodenum. ✓ Thresholds of 400 eosinophils and 700 mast cells/mm2 are indicative of abnormal infiltration in the duodenum. ACKNOWLEDGEMENTSWe thank Raf Bisschops, Chelsea Camps, and Hilde Willekens (Endoscopy Unit, University Hospitals Leuven) for providing and assisting with the Aperio CS2 scanning system. We thank Pieter Vanden Berghe (TARGID, Katholieke Universiteit Leuven) for the insightful discussions. We thank the University Hospitals Leuven Pathology Unit and Hunter Medical Research Institute Core Histology Facility for the processing and staining of the histological sections. Finally, we thank all patients and volunteers for their participation.
REFERENCES 1. Dellon ES, Liacouras CA, Molina-Infante J, et al. Updated international consensus diagnostic criteria for eosinophilic esophagitis: Proceedings of the AGREE conference. Gastroenterology 2018;155(4):1022–33.e10. 2. Turner KO, Sinkre RA, Neumann WL, et al. Primary colonic eosinophilia and eosinophilic colitis in adults. Am J Surg Pathol 2017;41(2):225–33. 3. Matsushita T, Maruyama R, Ishikawa N, et al. The number and distribution of eosinophils in the adult human gastrointestinal tract: A study and comparison of racial and environmental factors. Am J Surg Pathol 2015;39(4):521–7. 4. Silva J, Canão P, Espinheira MC, et al. Eosinophils in the gastrointestinal tract: How much is normal? Virchows Arch 2018;473(3):313–20. 5. Iwaya M, Kobayashi S, Nakayama Y, et al. Number and distribution of eosinophils and lymphocytes in the Japanese pediatric gastrointestinal tract: In search of a definition for “abnormally increased eosinophils”. World J Pediatr 2023;19(3):251–60. 6. Kiss Z, Tél B, Farkas N, et al. Eosinophil counts in the small intestine and colon of children without apparent gastrointestinal disease: A meta-analysis. J Pediatr Gastroenterol Nutr 2018;67(1):6–12. 7. Shah A, Fairlie T, Brown G, et al. Duodenal eosinophils and mast cells in functional dyspepsia: A systematic review and meta-analysis of case-control studies. Clin Gastroenterol Hepatol 2022;20(10):2229–42.e29. 8. Reed CC, Genta RM, Youngblood BA, et al. Mast cell and eosinophil counts in gastric and duodenal biopsy specimens from patients with and without eosinophilic gastroenteritis. Clin Gastroenterol Hepatol 2021;19(10):2102–11. 9. Mir SA, Schady D, Olive AP, et al. Mucosal mast cell counts in pediatric eosinophilic gastrointestinal disease. Pediatr Allergy Immunol 2014;25(1):94–5. 10. Bashashati M, Moossavi S, Cremon C, et al. Colonic immune cells in irritable bowel syndrome: A systematic review and meta-analysis. Neurogastroenterol Motil 2018;30(1):13192. 11. Shivji S, Conner JR, Kirsch R. Mast cell evaluation in gastrointestinal biopsies: Should we be counting? A critical review and practical guide for the surgical pathologist. Histopathology 2023;82(7):960–73. 12. Wauters L, Ceulemans M, Frings D, et al. Proton pump inhibitors reduce duodenal eosinophilia, mast cells and permeability in patients with functional dyspepsia. Gastroenterology 2021;160(5):1521–31.e9. 13. Burns GL, Bruce JK, Minahan K, et al. Type 2 and type 17 effector cells are increased in the duodenal mucosa but not peripheral blood of patients with functional dyspepsia. Front Immunol 2022;13:1051632. 14. Turner KO, Collins MH, Walker MM, et al. Quantification of mucosal eosinophils for the histopathologic diagnosis of eosinophilic gastritis and duodenitis: A primer for practicing pathologists. Am J Surg Pathol 2022;46(4):557–66. 15. Puthanmadhom Narayanan S, O'Brien DR, Sharma M, et al. Duodenal mucosal barrier in functional dyspepsia. Clin Gastroenterol Hepatol 2022;20(5):1019–28.e3. 16. Nojkov B, Zhou SY, Dolan RD, et al. Evidence of duodenal epithelial barrier impairment and increased pyroptosis in patients with functional dyspepsia on confocal laser endomicroscopy and “ex vivo” mucosa analysis. Am J Gastroenterol 2020;115(11):1891–901. 17. Ceulemans M, Jacobs I, Wauters L, et al. Immune activation in functional dyspepsia: Bystander becoming the suspect. Front Neurosci 2022;16:831761. 18. Vanuytsel T, Bercik P, Boeckxstaens G. Understanding neuroimmune interactions in disorders of gut-brain interaction: From functional to immune-mediated disorders. Gut 2023;72(4):787–98. 19. Talley NJ, Peterson KA, Genta RM, et al. High discovery rate of duodenal and gastric eosinophilia in patients with unexplained moderate-severe abdominal symptoms: A prospective US multisite study. Gastroenterology 2023;164(4):680–3.e2. 20. Dellon ES, Spergel JM. Biologics in eosinophilic gastrointestinal diseases. Ann Allergy Asthma Immunol 2023;130(1):21–7. 21. Dellon ES, Bortey E, Chang AT, et al. Determination of optimal eosinophil thresholds for diagnosis of eosinophilic gastritis and duodenitis: A pooled analysis of 4 prospective studies. Clin Transl Gastroenterol 2024;15(1):e00656. 22. Pesek RD, Reed CC, Collins MH, et al. Association between endoscopic and histologic findings in a multicenter retrospective cohort of patients with non-esophageal eosinophilic gastrointestinal disorders. Dig Dis Sci 2020;65(7):2024–35. 23. Genta RM, Sonnenberg A, Turner K. Quantification of the duodenal eosinophil content in adults: A necessary step for an evidence-based diagnosis of duodenal eosinophilia. Aliment Pharmacol Ther 2018;47(8):1143–50. 24. Licari A, Votto M, Scudeller L, et al. Epidemiology of nonesophageal eosinophilic gastrointestinal diseases in symptomatic patients: A systematic review and meta-analysis. J Allergy Clin Immunol Pract 2020;8(6):1994–2003.e2. 25. Dellon ES, Peterson KA, Murray JA, et al. Anti-siglec-8 antibody for eosinophilic gastritis and duodenitis. N Engl J Med 2020;383(17):1624–34. 26. Kliewer KL, Murray-Petzold C, Collins MH, et al. Benralizumab for eosinophilic gastritis: A single-site, randomised, double-blind, placebo-controlled, phase 2 trial. Lancet Gastroenterol Hepatol 2023;8(9):803–15. 27. Dellon ES, Gonsalves N, Rothenberg ME, et al. Determination of biopsy yield that optimally detects eosinophilic gastritis and/or duodenitis in a randomized trial of lirentelimab. Clin Gastroenterol Hepatol 2022;20(3):535–45.e15. 28. Pesek RD, Greuter T, Lopez-Nunez O, et al. Clinicopathologic correlations in eosinophilic gastrointestinal disorders. J Allergy Clin Immunol Pract 2021;9:3258–66. 29. Shoda T, Rochman M, Collins MH, et al. Molecular analysis of duodenal eosinophilia. J Allergy Clin Immunol 2023;151(4):1027–39. 30. Song Y, Yin J, Chang H, et al. Comparison of four staining methods for detecting eosinophils in nasal polyps. Sci Rep 2018;8(1):17718.
Comments (0)