
Remember me


T-cell proliferation necessitates cholesterol for the generation of new membranes, which can be acquired via biosynthesis and/or uptake. We hypothesized that these processes might be altered in T cells from CLL patients compared to HD, potentially contributing to the observed proliferation defects in CLL T cells. To assess this notion, PBMCs from CLL patients or age-matched HD were labeled with cell-trace violet (CTV) to be able to follow cellular divisions by flow cytometry, and stimulated with αCD3/28 soluble antibodies. Proliferation was assessed under two distinct culture conditions; In complete medium (i.e., medium containing lipoproteins) and in lipoprotein-deficient medium (LPDS). After 5 days, proliferation of T cells from both groups was compared. In line with previous reports [8, 13], proliferation of CLL T cells was reduced in complete medium conditions compared to HD, both in CD4+ and CD8+ T cells (Supplementary Fig. 1A). T-cell proliferation was fully abrogated in the LPDS condition in HD and CLL CD4+ (Fig. 1A) and CD8+ T cells (Supplementary Fig. 1B), indicating a clear dependency on exogenous cholesterol for proliferation, which was evident in the percentage of dividing cells and in the average number of cell divisions that a cell in the original population has undergone (division index). A primary route for cells to acquire exogenous cholesterol relies on LDL uptake by the LDL receptor (LDLR) [37]. We therefore tested whether supplementation of LDL restored proliferation in LPDS-cultured cells. Our results demonstrate that the impaired proliferation of HD and CLL cells in LPDS could be rescued by LDL supplementation, albeit the effect being smaller in CLL cells (Fig. 1A, Supplementary Fig. 1B).
Fig. 1
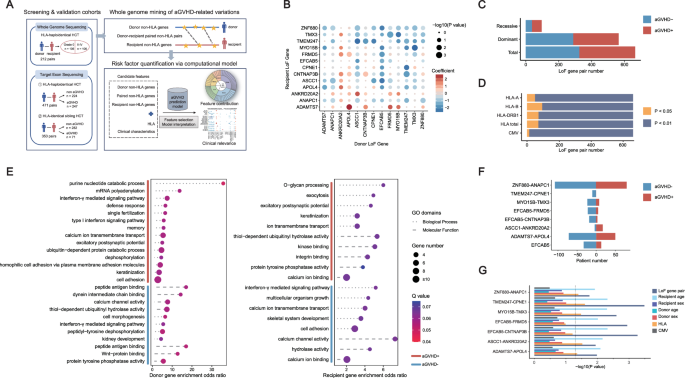
Extracellular cholesterol import is required for T-cell proliferation and is decreased in T cells from CLL patients. A PBMCs from healthy donors (HD) and chronic lymphocytic leukemia (CLL) patients were labeled with cell-trace violet (CTV) and stimulated with αCD3/αCD28 antibodies for 5 days under complete serum conditions, lipid deprivation (lipoprotein-deficient serum, LPDS) and LPDS supplemented with LDL. Proliferation of CD4+ T cells was measured as percentage divided cells (left) and division index (average number of cell divisions that a cell in the original population has undergone; right). Representative CTV histograms are shown (complete serum: black, LPDS: blue, and LPDS+ LDL: purple). B Expression of CD25, CD71 and IL-2 (intracellularly, after 4 h of Brefeldin treatment) was measured on CD4+ HD and CLL T cells after 2 days of stimulation in the same experimental conditions as in (A). C PBMCs from HD and CLL patients were stimulated with αCD3/αCD28 antibodies for 5 days in the presence or absence of the NPC1 inhibitor U18666A (10 µM). Proliferation of CD4+ T cells is shown as percentage divided cells (left) and division index (right). Representative CTV histograms are shown (αCD3/αCD28 only: black, αCD3/αCD28 + U1866A: orange). D Expression of CD25 was measured after 2 days of stimulation in the same experimental conditions as in (C). E Expression of LDLR was measured on CD4+ HD and CLL T cells after a 2-day stimulation with αCD3/αCD28 antibodies in total CD4+ T cells (left) and within CD4+ CD25high T cells (right). F expression of LDLR was measured on CD4+ HD and CLL T cells in the same experimental conditions as in (B). G LDLR expression was measured on day 2 and day 5 upon PBMC stimulation in the presence or absence of the NPC1 inhibitor U18666A (10 µM) on CD4+ T cells (left) and within CD4+ CD25high T cells (right). Data are presented as mean ± SEM and differences were analyzed with two-way repeated measures ANOVA with Tukey’s/Šidák’s multiple comparison test (A–E (left), F, G) or t-test (E (right)). **** = p < 0.0001; *** = p < 0.001; ** = p < 0.01; * = p < 0.05
Differences in T cell activation between HD and CLL T cells have been previously reported [8] and can contribute to different proliferation rates. Thus, we evaluated by flow cytometry the expression of several markers of T-cell activation and effector function in the lipid deprivation setting. The evaluated markers were IL-2 receptor (CD25), transferrin receptor 1 (CD71), cyclic ADP ribose hydrolase (CD38), the early activation marker CD69, intracellular interleukin 2 (IL-2), and granzyme B (GZMB). CD25 levels were found reduced in stimulated T cells from CLL patients, as expected [11]. A reduction in CD25 expression was observed in the LPDS condition in both HD and CLL CD4+ and CD8+ T-cells (Fig. 1B, Supplementary Fig. 1C). CD71 was also decreased in the LPDS condition in CD4+ T cells from both groups (Fig. 1B), and in CD8+ T cells from CLL patients (Supplementary Fig. 1C). Intracellular IL-2 was decreased in the LPDS condition in HD only in the CD8+ compartment, and in CLL in both CD4+ and CD8+ (Fig. 1B, Supplementary Fig. 1C). Furthermore, surface levels of CD38 and CD69 were decreased in LPDS conditions only in T cells from CLL patients, but not in HD (Supplementary Fig. 1D). Taken together, the effects of extracellular cholesterol depletion on T-cell activation and effector markers were much more pronounced in T cells from CLL patients than in HD, possibly indicating a lack of compensatory mechanisms to maintain cholesterol levels in these cells. Except for a small increase in CD25 expression in HD, LDL supplementation did not restore the expression of activation or effector markers, suggesting that lipoprotein availability is not directly linked to activation status in T cells.
Following its uptake, LDL is trafficked to the lysosome where cholesterol egress to other cellular compartments is initially coordinated by the cholesterol transporter Niemann-Pick C1 protein (NPC1). As LDL uptake is a primary way for cells to acquire exogenous cholesterol, we reasoned that attenuated cholesterol availability was the limiting factor for T-cell proliferation in the LPDS setting. To further substantiate this claim, we inhibited NPC1 with the small molecule U18661A [38]. Treating cells with U18661A mimics sterol depletion without altering the medium composition [39]. Similar to the results obtained with LPDS medium, the percentage of proliferating cells and division index of HD and CLL T cells was reduced when NPC1 was inhibited (Fig. 1C, Supplementary Fig. 1E). In line with this, T-cell activation was reduced when cultured in the presence of U18661A (Fig. 1D, Supplementary Fig. 1F).
To further investigate whether defects in LDL uptake could be, at least in part, the basis of decreased proliferation in CLL T cells, the surface abundance of LDLR was assessed by flow cytometry. This analysis showed that HD T cells robustly increased the abundance of surface LDLR following T-cell stimulation, while this response was severely impaired in CLL T cells (Fig. 1E left, Supplementary Fig. 1G). In order to rule out the differences in activation status between HD and CLL patients as a confounding factor, LDLR levels were also analyzed within the highly activated T-cell population (CD25high) in both groups (gating strategy example in Supplementary Fig. 1H). Also in the CD25high sub-population, LDLR levels were reduced in CLL compared to HD T cells (Fig. 1E right), indicating that reduced surface LDLR is an inherent lesion of CLL T cells that is not dependent on the degree of activation. Expression of LDLR is primarily regulated by sterol levels through the SREBP transcriptional pathway [37, 40]. Thus, we next assessed LDLR levels in response to a 2-day stimulation in LPDS medium. Lipid deprivation-induced LDLR expression in HD T cells (Fig. 1F, Supplementary Fig. 1I) was similar to responses previously described in hepatocytes and macrophages [41,42,43]. As expected, LDL supplementation decreased the level of LDLR to that measured in the control condition (Fig. 1F, Supplementary Fig. 1I). The same pattern was observed in CLL T cells, revealing that despite decreased LDLR levels, sterol sensing mechanisms are functional in these cells (Fig. 1F, Supplementary Fig. 1I). However, the dynamics of LDLR regulation upon stimulation in the presence of U18661A were divergent. In HD, LDLR was only increased after 5 days of stimulation in the presence of U18661A (Fig. 1G left, Supplementary Fig. 1J left), when T-cell activation levels reached their peak (Supplementary Fig. 1K [44]). In contrast, LDLR expression was decreased in CLL T cells at day 5 in the presence of U18661A, compared to their control stimulated counterparts (Fig. 1G left, Supplementary Fig. 1J left). Differences in LDLR levels upon U1886A were also observed within the CD25 high sub-population at day 5 (Fig. 1G right, Supplementary Fig. 1J right), indicating that CLL T cells likely lack additional determinants to properly sense cholesterol deficiency upon U18661A exposure. Altogether, these results show that T cells are dependent on exogenous cholesterol for expansion upon TCR-mediated activation. Furthermore, CLL T cells not only have reduced expression of LDLR but also fail to fully adapt to cholesterol deprivation.
Key transcriptional programs governing lipid metabolism are downregulated in CLL T cellsLipid metabolism in T cells is subject to tight (post-) transcriptional regulation [24]. Herein, the SREBPs, PPARs, and the ligand X receptors (LXR) play a crucial role [24]. To uncover transcriptional differences that may be at the basis of the proliferation defects in CLL T cells, the transcriptome of HD and CLL T cells was compared at baseline and after 2 days of TCR stimulation. To avoid differences in subset skewing between HD and CLL as confounders in these analyses, samples were matched for CD4, CD8, and subset distribution (Supplementary Fig. 2A, B). In addition, selected samples had comparable expression levels of CD25 upon activation, and an equal CD4 to CD8 distribution after sorting (Supplementary Fig. 2C). In order to specifically analyze the T-cell transcriptome, PBMCs (either at baseline or after 2 days of stimulation with αCD3/28 soluble antibodies) were subjected to CD19 depletion by MACS followed by sorting of viable CD4+ and CD8+ T cells. Samples were pelleted, and mRNA was extracted and subjected to RNA sequencing. Both at baseline and upon in vitro stimulation, CLL and HD T cells clustered separately in a principal component analysis, indicating they have distinct transcriptomic signatures (Supplementary Fig. 2D). To specifically analyze whether the expression of lipid genes was different between the two groups, we compiled a list of 452 lipid-related genes using publicly available gene sets of target genes regulated by SREBPs, PPARs, and LXR, and specific lipid pathways (FA metabolism and cholesterol metabolism) (Supplementary Table 3). Out of the 452 genes, 119 were differentially expressed between HD and CLL T cells at baseline, of which the majority were reduced in CLL T cells (Fig. 2A, Supplementary Table 4). Significantly downregulated genes included the LXR-regulated cholesterol efflux transporters ABCA1 and ABCG1, as well as FA synthase (FASN). Upregulated genes included carnitine palmitoyl transferase I (CPT1A) and squalene epoxidase (SQLE), a rate-limiting enzyme in the cholesterol biosynthetic pathway (Fig. 2B), indicating that T cells from both groups already differed in the regulation of some specific lipid genes prior to stimulation. However, we did not identify homogenous up/downregulation of specific transcription factor signatures at baseline.
Fig. 2
Key transcriptional programs governing lipid metabolism are downregulated in CLL T cells. CD4+ and CD8+ T cells of HD and CLL patients were FACS-sorted and subjected to RNA sequencing, either (A, B) at baseline or (C–F) after a 2-day stimulation with αCD3/αCD28 antibodies. To specifically analyze the main transcription factor families regulating lipid metabolism and their targets, a list of 452 genes was compiled using publicly available gene sets (Supplemental Table 3). Expression of these genes is visualized in volcano plots and heatmaps. A, C In the volcano plots, differentially expressed genes between CLL and HD T cells (padj. ≤ 0.05) are depicted in black dots and, among them, specific genes of interest are highlighted in blue (downregulated in CLL) or red (upregulated in CLL). B, D Heatmaps showing Z-scores of the significantly differentially expressed genes between the two groups (padj. < 0.05). Genes of interest are highlighted in bold. E Heatmap of the expression of differentially expressed SREBP1, SREBP2, PPARα, PPARγ, and LXR target genes in CLL compared to HD T cells (padj. ≤ 0.05) after a 2-day stimulation with αCD3/αCD28 antibodies. Genes of interest are highlighted in bold. F Boxplots showing DESeq2 normalized counts of SREBF1, SREBF2, PPARA, PPARG, and NIH13 in CLL and HD T cells after a 2-day stimulation. Differences in (F) were analyzed with Mann–Whitney test. * = p < 0.05
Upon stimulation, 74 out of the 452 genes were differentially expressed. Among the most significantly downregulated genes in CLL T cells, we found FA and cholesterol transporters (ABCG1, ABCD1, and ABCA2) and SREBF1/2 (SREBP1/2) (Fig. 2C, D, Supplementary Table 5). Accordingly, multiple target genes of SREBP1/2 were downregulated in CLL T cells upon stimulation, including Stearoyl-CoA Desaturase (SCD), an SREBP1 target involved in FA desaturation, LDLR, an SREBP2 target we previously found decreased at the protein level (Fig. 1E, Supplementary Fig. 1G), and mevalonate diphosphate decarboxylase (MVD), an SREBP2 target involved in cholesterol synthesis (Fig. 2D, E). Contrarily, most PPARα target genes were upregulated in CLL with the exception of CPT1B, involved in FA transport in the mitochondria (Fig. 2E), while expression of PPARA itself was significantly lower in CLL T cells (Fig. 2F). Expression of the transcription factors PPRG (PPARγ) and NR1H3 (LXR) was not significantly different between both groups (Fig. 2F), however, most LXR target genes were downregulated in CLL T cells, and PPARγ target genes showed a mixed response (Fig. 2E). Analysis of gene expression by functional pathways revealed that CLL T cells exhibited an overall decrease in the expression of genes involved in cholesterol biosynthesis and FA metabolism upon stimulation (Supplementary Fig. 2E). Collectively, these findings demonstrate that the key transcriptional programs governing lipid metabolism are dampened in CLL T cells compared to healthy T cells.
We next examined the relevance of our observation of lower levels of key transcription regulators upon stimulation in CLL T cells by measuring protein levels of FASN and SCD by flow cytometry. These enzymes are essential for FA synthesis and desaturation, respectively, and are both well-established downstream targets of SREBP1. FASN and SCD were equally abundant in CLL and HD T cells at baseline (Fig. 3A, Supplementary Fig. 3A), but CLL T cells failed to upregulate them upon TCR activation (Fig. 3B, Supplementary Fig. 3B). Analysis of the sub-population of CD25high T cells revealed a trend towards decreased levels of FASN and a significant reduction in SCD expression in CLL T cells compared to HD T cells (Fig. 3C, Supplementary Fig. 3C). This indicates that defects in SREBP1 signaling are inherent in T cells from CLL patients and not a product of decreased activation levels.
Fig. 3
Essential lipid metabolism proteins are downregulated in CLL T cells, which portrays increased dependency on de novo cholesterol biogenesis. A Levels of FASN and SCD were measured on CD4+ T cells from HD and CLL patients at baseline, B after a 2-day stimulation with αCD3/αCD28, and C within CD4+ CD25high T cells by flow cytometry. D Expression of PPARα and PPARγ was measured on CD4+ T cells from HD and CLL patients at baseline, E after a 2-day stimulation with αCD3/αCD28, and F within CD4+ CD25high T cells. G Expression of CPT1α was measured on CD4+ T cells from HD and CLL patients after a 2-day stimulation with αCD3/αCD28. H PBMCs from HD and CLL patients were labeled with CTV and stimulated with αCD3/αCD28 antibodies for 5 days in the presence or absence of the squalene inhibitor NB598 (10 µM) or Simvastatin (10 µM). Proliferation of CD4+ T cells is shown as percentage divided cells (left) and division index (right). I PBMCs from HD and CLL patients were labeled with CTV and stimulated with αCD3/αCD28 antibodies for 5 days in the presence or absence of the LXR agonist GW3695 (1 µM). Proliferation of CD4+ T cells is shown as percentage divided cells (left) and division index (right). J Expression of SCD at day 2 was measured under the same experimental conditions as in (I). Data are presented as mean ± SEM and differences were analyzed with t-tests (A, C, D, F) or two-way repeated measures ANOVA with Tukey’s/Šidák’s multiple comparison test (B, E, G, H, I, J). **** = p < 0.0001; *** = p < 0.001; ** = p < 0.01; * = p < 0.05
Decreased protein levels of PPARγ and PPARα were observed in CLL T cells at baseline (Fig. 3D, Supplementary Fig. 3D). Upon activation, expression of these proteins increased significantly in HD T cells but not in CLL T cells (Fig. 3E, Supplementary Fig. 3E), including CD25high cells (Fig. 3F, Supplementary Fig. 3F), where a statistically significant reduction of protein levels was observed in the CD8+ compartment compared to healthy CD8+ cells (Supplementary Fig. 3F). Accordingly, significantly lower levels of the PPARα target CPT1α were detected in CLL T cells upon stimulation, compared to HD T cells (Fig. 3G, Supplementary Fig. 3G).
In conclusion, CLL T cells exhibited impaired upregulation of key transcription factors governing lipid metabolism, especially SREBP1 and 2, PPARα and PPARγ and its target genes, upon TCR stimulation, implying reduced capacity for FA and cholesterol synthesis and limited use of lipids for energy production.
T cells from CLL patients have increased dependency on de novo cholesterol biogenesis compared to healthy T cellsCholesterol homeostasis involves uptake (through LDLR), efflux, and de novo biogenesis, which is even more relevant when uptake is impaired. The SCAP-SREBP2 complex in the endoplasmic reticulum (ER) senses low sterol levels, triggering SREBP2 proteolysis [45]. Cleaved active SREBP2 translocates to the nucleus and increases the transcription of genes of the mevalonate pathway, which facilitates the synthesis of cholesterol and its derivatives [45, 46]. Transcriptomic analyses showed decreased expression of LDLR and MVD (Fig. 2E), which catalyzes one of the essential steps in cholesterol biogenesis in the mevalonate pathway. To compare the activity of this pathway between HD and CLL T cells, we targeted two distinct enzymatic steps and evaluated proliferation, using a SQLE inhibitor (NB598) and an HMG-CoA reductase inhibitor (simvastatin) during PBMC simulation. It is important to note that simvastatin has previously been reported to not only halt cholesterol biosynthesis but to also inhibit the isoprenoid branch of the mevalonate pathway, disturbing membrane composition and inhibiting protein prenylation in T cells [47]. NB598 dampened proliferation only in CLL T cells, whilst simvastatin significantly reduced it in both HD and CLL T cells (Fig. 3H, Supplementary Fig. 3H). These results suggest a higher dependency on de novo cholesterol biogenesis in CLL T cells compared to HD. We speculate that healthy T cells compensate for the inhibition of SQLE by increasing exogenous cholesterol uptake through LDLR, whilst we have shown that CLL T cells are not able to equally do so upon cholesterol deprivation (Fig. 1F, G, Supplementary Fig. 1I, J).
While SREBP2 controls cholesterol uptake and synthesis, LXR regulates cholesterol efflux. To investigate its relevance in cholesterol homeostasis in T cells, we used the LXR agonist GW3695. Increase of cholesterol efflux by GW3695 did not affect T-cell proliferation in neither HD or CLL cells (Fig. 3I, Supplementary Fig. 3I), which is different from what was previously reported in mice [48]. Nevertheless, levels of SCD, which is indirectly regulated by LXR through SREBP1, were strongly upregulated by GW3695 in HD T cells but not in CLL (Fig. 3J, Supplementary Fig. 3J). This indicates that the axis LXR-SREBP1 is more active in HD T cells than in CLL. In summary, these data demonstrate a tight link between cholesterol availability and proliferation in T-cells, which is compromised at the levels of uptake and synthesis in CLL.
The organization of lipids in the cytoplasm is different in T cells from CLL patients compared to HDDecreased SREBP1/2 signaling upon TCR stimulation in CLL implies reduced capacity for FA and cholesterol synthesis and thus we hypothesized that CLL T cells would exhibit reduced intracellular lipid content. In order to analyze this, the fluorescent dye BodipyTM493/503 was used. PBMCs were stimulated for 2 days and subsequently incubated in the presence of BodipyTM493/503, which diffuses inside cells, binds to neutral lipids, and can be detected by flow cytometry. Contrary to our expectations, lipid storage was increased in CLL T cells both in unstimulated and stimulated conditions, compared to HD, which was especially notable within the CD8+ T-cell subset (Fig. 4A, Supplementary Fig. 4A). Monocytes, which are known to accumulate substantial amounts of lipids in their cytoplasm [23] were used as reference (Supplementary Fig. 4B). Confocal microscopy further validated the presence of lipid aggregates based on BodipyTM493/503 staining in the cytoplasm of T cells (Fig. 4B), supporting our findings by flow cytometry.
Fig. 4
The organization of lipids in the cytoplasm is different in T cells from CLL patients compared to HD. A PBMCs from HD and CLL patients were stimulated with αCD3/αCD28 antibodies for 2 days. Neutral lipid accumulation was quantified using BodipyTM493/503 staining by flow cytometry on CD4+ T cells. Raw gMFI values were normalized to unstimulated HD samples in each independent experiment. B Upon culturing in the same experimental conditions as in (A), samples were subjected to CD19 MACS depletion and immunofluorescence was performed, first staining with BodipyTM493/503 and then with antibodies against CD4+ and CD8+ (both conjugated to AF549). DAPI was used as nuclear staining. Samples were imaged with confocal microscopy. Representative images of a stimulated HD and CLL sample are shown. C Upon culturing in the same experimental conditions as in (A), immunofluorescence was performed, first staining with BodipyTM493/503 and then with antibodies against CD4+ and CD8+ (both conjugated to AF549) and PLIN2 (unconjugated). A secondary antibody goat anti-mouse conjugated to AF647 was used to detect PLIN2, and DAPI was used as nuclear staining. Regions of interest (ROI) were manually selected based on BodipyTM493/503. Fluorescence intensity of BodipyTM493/503 and PLIN2 was quantified in ImageJ as gray values throughout each ROI and plotted in spatial plots to assess co-occurrence in a cross-sectional ROI. Representative images with ROIs highlighted in yellow are provided (left). Representative spatial plots of fluorescence intensity from a stimulated HD and CLL samples are shown (right). D In each ROI, the 50 pixels with the highest BodipyTM493/503 fluorescence were selected. Intensity of BodipyTM493/503 and PLIN2 within the same pixel were plotted against each other and correlation was calculated. Data from all ROIs analyzed in stimulated cells are shown. Every dot represents one pixel and every color corresponds to one ROI. E The percentage of T cells with significant positive correlation between BodipyTM493/503 and PLIN2 was calculated in each condition (p < 0.05). Data are presented as mean ± SEM (A) and differences were analyzed with two-way repeated measures ANOVA with Tukey’s/Šidák’s multiple comparison test (A) or linear regression analysis (D). **** = p < 0.0001; * = p < 0.05
Lipid droplets, primarily characterized in adipocytes, typically express perilipin-2 (PLIN2) on their surface [23]. To investigate whether the identified neutral lipid aggregates in T cells were organized in lipid droplets, we conducted confocal microscopy to assess co-localization of BodipyTM493/503 with PLIN2. PBMCs were stimulated for 2 days and subjected to CD19 depletion by MACS before staining of BodipyTM493/503, PLIN2 and DAPI for confocal analyses (Supplementary Fig. 4C, D). Cross-sectional analysis of T cells in both HD and CLL PBMCs revealed strong co-localization between BodipyTM493/503 and PLIN2 in HD T cells (Fig. 4C, Supplementary Fig. 4E), particularly in stimulated samples, indicating that all lipid aggregates in these cells were lipid droplets (PLIN2+). In contrast, areas positive for BodipyTM493/503 were not always PLIN2-positive in CLL T cells (Fig. 4C, Supplementary Fig. 4E), suggesting a different organization of neutral lipids in the cytoplasm. Linear regression analysis of BodipyTM493/503 and PLIN2 signal within multiple cells showed significant correlation in HD T cells, in both stimulated (Fig. 4D) and unstimulated conditions (Supplementary Fig. 4F). This positive correlation was found in all T cells analyzed in HD (Fig. 4E, Supplementary Fig. 4G). In CLL, two different T-cell populations were found, one where co-localization of BodipyTM493/503 and PLIN2 occurred (57.1% in the unstimulated, and 72.7% in the stimulated samples), and another where no co-localization was present. Even within cells where co-localization was present, PLIN2-negative lipid aggregates were observed (Fig. 4D, Supplementary Fig. 4F, G).
The lipidome of CLL T cells is characterized by low cholesterol and phospholipids, and accumulation of triglycerides, compared to healthy T cellsTo compare the lipid composition of HD and CLL T cells, we performed untargeted mass spectrometry-based lipidomic analysis at baseline and in samples stimulated for 2 days from the same HD and patients used in the RNA sequencing experiments. This approach enabled a direct comparison between lipid profiles and gene expression patterns, enhancing our understanding of metabolic alterations in CLL T cells.
In order to specifically analyze the T-cell lipidome, PBMCs (either at baseline or after 2 days of stimulation with αCD3/28 soluble antibodies) were subjected to CD19 depletion by MACS, followed by sorting of viable CD4+ and CD8+ T cells. Samples were pelleted and subjected to lipidome extraction and liquid chromatography-mass spectrometry (LC-MS) analysis. Principal component analysis of lipidomic profiles at baseline revealed no global differences between HD and CLL T cells on the first 2 principal components (Fig. 5A). However, a general trend to increased lipid abundance was observed in CLL T cells across all lipid classes (Supplementary Fig. 5A). This trend was particularly evident among lipids with a variable importance in projection (VIP) higher than 1, i.e., the most different between the two groups (Fig. 5A). These findings align with the accumulation of neutral lipids observed in CLL T cells at baseline (Fig. 4A, Supplementary Fig. 4A).
Fig. 5
The lipidome of CLL T cells is characterized by low cholesterol and phospholipids, and accumulation of triglycerides, compared to healthy T cells. CD4+ and CD8+ T cells of HD and CLL patients were FACS-sorted and subjected to liquid chromatography-mass spectrometry (LC-MS)-based lipidomics (A) at baseline or (B) after 2-day stimulation with αCD3/αCD28 antibodies. Abundance of each lipid molecule was normalized by internal standards and protein amount (A) or total lipidome pool (B). Results are visualized as principal component analysis plots, volcano plots, and heatmaps of differentially abundant lipid species. In the volcano plots, the three horizontal dotted lines indicate p values of 0.05, 0.01, and 0.001, respectively. The two vertical dotted lines indicate log2 (fold change) of −2 and 2, respectively. Lipid molecules with significantly different abundance in CLL T cells compared to HD T cells (p ≤ 0.01) are colored according to the lipid class they belong to. For heatmap representation of lipidomics data, a cutoff for variable importance in projection (VIP) score >1 from all lipid molecules analyzed was defined. Abundance of the different lipid classes relative to the total lipids sum is shown in Supplementary Fig. 5A, B. C Relative abundance of triacylglycerols and cholesterol esters after a 2-day stimulation with αCD3/αCD28 antibodies is plotted separately. D PBMC from HD and CLL patients were stimulated for 2 days with αCD3/αCD28 antibodies and protein levels of ATGL were measured. E FAO was assessed by flow cytometry on CD4+ T cells by FAOBlue in the same experimental conditions as in (D). F Abundance of acylcarnitines after a 2-day stimulation with αCD3/αCD28 antibodies is plotted separately. Data are presented as mean ± SEM (C–F) and differences were analyzed with t-test (C) or two-way repeated measures ANOVA with Tukey’s/Šidák’s multiple comparison test (D–F). **** = p < 0.0001; *** = p < 0.001; ** = p < 0.01; * = p < 0.05. PC phosphatidylcholine, PC[O] alkylphosphatidylcholine, PC[P] alkenylphosphatidylcholine, PC[O + P] alkyl/alkenylphosphatidylcholine, LPC lysophosphatidylcholine, LPC[O] alkyllysophosphatidylcholine, LPC[P] alkenyllysophosphatidylcholine, LPC[O + P] alkyl/alkenyllysophosphatidylcholine, PE phosphatidylethanolamine, PE[P] alkenylphosphatidylethanolamine, PE[O] alkylphosphatidylethanolamine, PE[O + P] alkyl/alkenylphosphatidylethanolamine, LPE lysophosphatidylethanolamine, LPE[P] alkyllysophosphatidylethanolamine, LPE[O + P] alkyl/alkenyllysophosphatidylethanolamine, PI phosphatidylinostiol, BMP bis(monoacylglycero)phosphate, PG phosphatidyglycerol, PS phosphatidylserine, CL cardiolipin, SM[d] sphingomyeline, SM[t] hydroxysphingomyeline, SPH[d] sphingosine, GM3 monosialdihexosylganglioside, Cer[d] ceramide, HexCer[d] hexosylceramide, Hex2Cer[d] dihexosylceramide AC acylcarnitine, TAG triacylglycerol, TAG[O] alkyltriacylglycerol, DAG diacylglycerol, CE cholesterol ester, FA fatty acid
After 2 days of stimulation, a clear separation in lipid composition was identified between CLL and HD T cells (Fig. 5B). The majority of lipids with a VIP score higher than 1 were lower in abundance in CLL T cells compared to HD (Fig. 5B). Grouping lipids by structural similarity revealed decreased relative abundance of most classes in CLL T cells, including essential phospholipids that are part of cellular membranes, such as phosphatidylcholine (PC) and sphingomyelin (SM) (Fig. 5B, Supplementary Fig. 5B). Notably, CE were also found decreased in CLL T cells (Fig. 5C, Supplementary Fig. 5B), corroborating our previous findings of a reduced SREBP2 signature in these cells. Conversely, TAG were significantly increased in CLL T cells (Fig. 5C, Supplementary Fig. 5B). This suggests that the neutral lipid accumulations previously detected by flow cytometry and confocal imaging (Fig. 4) likely have different compositions in CLL T cells (predominantly TAG) versus HD (predominantly CE). In summary, lipidomic analyses revealed a distinct lipid profile in stimulated CLL T cells characterized by cholesterol
Comments (0)