
Remember me
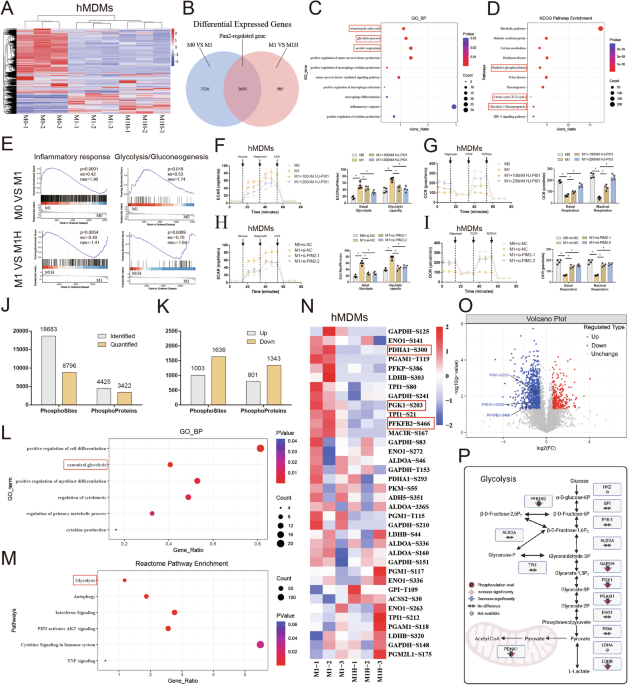


To elucidate the role of Pim2 in macrophages, circulating monocytes were isolated from healthy donors and then further differentiated into macrophages (hMDMs) in vitro, followed by M1 induction with lipopolysaccharide (LPS)/interferon-γ (IFN-γ) and Pim2 inhibition with HJ-PI01. Then, RNA-seq was conducted using untreated hMDMs (M0 group), LPS/IFN-γ-treated hMDMs (M1 group) and LPS/IFN-γ- and HJ-PI01-treated hMDMs (M1H group). The results revealed 9974 DEGs between the M0 and M1 groups and 3235 DEGs between the M1 and M1H groups. Moreover, 2650 key DEGs were regulated by Pim2, as visualized in the Venn diagram (Fig. 1A, B). Gene Ontology (GO) analysis revealed that biological processes such as glycolysis, positive regulation of macrophage cytokine production, positive regulation of macrophage activation, and macrophage differentiation signaling pathways were enriched in these key genes (Fig. 1C). Kyoto Encyclopedia of Genes and Genomes (KEGG) pathway analysis further revealed that “glycolysis/gluconeogenesis,” “oxidative phosphorylation,” and the “tricarboxylic acid cycle” were enriched predominantly among the Pim2-regulated genes (Fig. 1D). Additionally, gene set enrichment analysis (GSEA) revealed that inflammatory response- and glycolysis-related pathways were enriched in the upregulated genes between the M0 and M1 groups. Moreover, the genes whose expression was downregulated between the M1H and M1 groups were enriched in these pathways. Subsequent qPCR also validated the expression of inflammation-related genes and glycolysis-related genes, which roughly aligned with the results from transcriptome sequencing (Supplementary Fig. S1A–C). These findings suggest that Pim2 may regulate the metabolic reprogramming of macrophages.
Fig. 1
Pim2 promotes glycolytic reprogramming in macrophages. A, B Cluster heatmap and Venn plot of DEGs identified by RNA-seq in the M0, M1, and M1H groups (n = 3). C–E GO-BP, KEGG, and GSEA analyses of Pim2-regulated genes. F ECAR of hMDMs treated with or without HJ-PI01 after M1 induction (100 or 200 nM) (n = 4). G OCRs of hMDMs treated with or without HJ-PI01 (100 or 200 nM) after M1 induction (n = 4). H ECAR of hMDMs in the presence or absence of Pim2 knockdown after M1 induction (n = 4). I OCRs of hMDMs in the presence or absence of Pim2 knockdown after M1 induction (n = 4). J Histogram showing the number of phosphorylation sites and the corresponding proteins detected in hMDMs treated with or without 200 nM HJ-PI01 after M1 induction. K Histogram showing the number of Pim2-regulated phosphorylation sites and the corresponding proteins. L‒M GO-BP and Reactome pathway enrichment analyses of Pim2-regulated proteins. N Cluster heatmap of metabolic enzymes (n = 3). O Volcano plots of metabolic enzymes identified by phosphoproteomic analysis of the M1 and M1H groups. P Changes in the protein and phosphorylation levels of metabolic enzymes
Macrophage polarization is intricately linked to cellular metabolism and changes in metabolic signaling pathways. M1 macrophages rely on glycolysis, whereas M2 macrophages utilize oxidative phosphorylation [7,8,9]. To elucidate the role of Pim2 in the metabolic reprogramming of macrophages, we assessed glycolysis and oxidative phosphorylation via the extracellular acidification rate (ECAR) and oxygen consumption rate (OCR). Compared with untreated hMDMs, LPS/IFN-γ-treated hMDMs presented a greater ECAR and a lower OCR; however, HJ-PI01 treatment reversed these effects (Fig. 1F, G). Additionally, compared with untreated hMDMs, LPS/IFN-γ-treated hMDMs presented elevated lactate levels and reduced ATP levels, and these effects were reversed by HJ-PI01 treatment (Supplementary Fig. S3A, B). These findings suggest that Pim2 promotes glycolytic reprogramming in macrophages.
To further elucidate the role of Pim2 in metabolic reprogramming in macrophages, we designed three specific siRNAs targeting Pim2. siRNA1 and siRNA2 significantly reduced Pim2 expression in hMDMs (Supplementary Fig. S2A, B). Compared with those treated with si-NC, LPS/IFN-γ-treated hMDMs treated with si-Pim2-1 or si-Pim2-2 exhibited a decreased ECAR and an increased OCR (Fig. 1H, I). Additionally, Pim2 knockdown reduced the level of lactate and increased the level of ATP in LPS/IFN-γ-treated hMDMs, indicating that Pim2 knockdown promotes the transition from glycolysis to oxidative phosphorylation in macrophages (Supplementary Fig. S3C, D). These findings further suggest that Pim2 promotes glycolytic reprogramming in macrophages.
Protein phosphorylation plays a crucial role in regulating glycolysis and oxidative phosphorylation [21]. Pim2 modulates glycolytic activity by mediating the phosphorylation of various glycolytic enzymes [17,18,19,20]. To further elucidate the specific mechanisms by which Pim2 regulates metabolic reprogramming in macrophages, we analyzed the protein phosphorylation profiles of LPS/IFN-γ-treated hMDMs (M1 group) and LPS/IFN-γ- and HJ-PI01-treated hMDMs (M1H group). We identified a total of 18,683 phosphorylation sites in 4,425 proteins, 8,796 of which were quantifiable (Fig. 1J). Compared with those in the M1 group, the phosphorylation levels of 801 proteins (1,003 sites) were increased, whereas the phosphorylation levels of 1,343 proteins (1,636 sites) were decreased in the M1H group (Fig. 1K). GO-BP and Reactome pathway enrichment analyses of proteins with decreased phosphorylation levels revealed significant enrichment in the glycolytic pathway (Fig. 1L, M). These results indicate that Pim2 potentially regulates the metabolic reprogramming of macrophages via metabolic enzyme phosphorylation.
Pim2 promotes glycolytic reprogramming via metabolic enzyme phosphorylationTo investigate the specific mechanism by which Pim2 regulates the metabolic reprogramming of macrophages, we analyzed the phosphorylation levels of metabolic enzymes in macrophages via phosphoproteomic data. The analyses revealed that HJ-PI01 treatment reduced the phosphorylation levels of several metabolic enzymes, including PGK1-S203, PDHA1-S300, PFKFB2-S466, ADH5-S351, GAPDH-S210, GAPDH-S125, LDHB-S203 and PGAM1-T119, in LPS/IFN-γ-treated hMDMs, as demonstrated in the heatmap and volcano plot in Fig. 1N‒P. We first examined the expression levels of these metabolic enzymes and found that HJ-PI01 treatment did not alter their mRNA or protein levels (Fig. S4A, B). Further examination of the phosphorylation levels of these enzymes revealed that the phosphorylation levels of PGK1, PDHA1, and PFKFB2 were greater in the LPS/IFN-γ-treated hMDMs than in the untreated hMDMs but decreased after HJ-PI01 treatment (Fig. 2C–E). In contrast, the phosphorylation levels of the other proteins were not significantly altered (Supplementary Fig. S4C–F). These results suggest that Pim2 may regulate M1 macrophage polarization by modulating the phosphorylation levels of PGK1, PDHA1 and PFKFB2.
Fig. 2
Pim2 regulates glycolytic activity via phosphorylation of glycolytic enzymes. A, B The mRNA and protein levels of PGK1, PDHA1, and PFKFB2 in hMDMs with or without 200 nM HJ-PI01 treatment after M1 induction were determined by RT‒qPCR and Western blotting (n = 3). C–E The phosphorylation levels of PGK1, PDHA1, and PFKFB2 in hMDMs with or without 200 nM HJ-PI01 treatment after M1 induction were determined by immunoprecipitation followed by Western blotting (n = 3). HEK293T cells were transfected with the indicated HA-tagged PGK1 (F‒G), PDHA1 (H‒I), and PFKFB2 (J‒K), along with Flag-tagged Pim2 proteins. Immunoprecipitation and immunofluorescence staining were performed using anti-HA and anti-Flag antibodies. L-N HEK293T cells were transfected with the indicated HA-tagged PGK1 (WT or S203A), PDHA1 (WT or S300A), and PFKFB2 (WT or S466A), along with Flag-tagged Pim2 proteins. The phosphorylation levels of PGK1, PDHA1, and PFKFB2 in HEK293T cells were determined by immunoprecipitation followed by Western blotting (n = 3). O–T PGK1 (WT, S203A, or S203E), PDHA1 (WT, S300A, or S300E), and PFKFB2 (WT, S466A, or S466E) were overexpressed in HEK293T cells. The ECAR and OCR of the different groups of HEK293T cells were determined
To verify the interaction between Pim2 and the metabolic enzymes PGK1, PDHA1, and PFKFB2, we exogenously expressed Flag-Pim2 in combination with HA-tagged PGK1, PDHA1, and PFKFB2 in 293T cells. Coimmunoprecipitation (co-IP) assays demonstrated that Pim2 binds to PGK1, PDHA1, and PFKFB2 (Fig. 2F, H, J). Subsequent confocal microscopy analysis of 293T cells revealed that Pim2 and these metabolic enzymes colocalized (Fig. 2G, I, K). Given the localization of the PDHA1 protein in the mitochondrial matrix, the cellular localization of Pim2 was investigated. We confirmed the presence of Pim2 in both the cytoplasm and the mitochondrial matrix via mitochondrial fractionation, Western blotting and immunofluorescence staining (Supplementary Fig. S5A, B). These findings confirm the interaction between Pim2 and the metabolic enzymes PGK1, PDHA1, and PFKFB2.
To pinpoint the specific sites where Pim2 regulates PGK1, PDHA1, and PFKFB2, we next constructed wild-type and phosphorylation-inactive point mutant proteins, PGK1 (WT or S203A), PDHA1 (WT or S300A), and PFKFB2 (WT or S466A), and overexpressed them alongside Pim2 in 293T cells. As shown in Fig. 2L, the S203A mutation in PGK1 blocked Pim2-mediated phosphorylation compared with that in wild-type PGK1, indicating that S203 is a critical site for Pim2 regulation of PGK1 (Fig. 2L). Similarly, the S300A mutation in PDHA1 blocked Pim2-mediated phosphorylation relative to that in wild-type PDHA1, suggesting that S300 is a key site for Pim2 regulation of PDHA1 (Fig. 2M). Compared with wild-type PFKFB2, the S466A mutation blocked Pim2-mediated phosphorylation, indicating that S466 is a crucial site for Pim2 regulation of PFKFB2 (Fig. 2N).
To further investigate the impact of Pim2-mediated phosphorylation on metabolic enzyme activity, we constructed wild-type, phosphorylation-inactive and phosphorylation-active point mutant proteins, PGK1 (WT, S203A, or S203E), PDHA1 (WT, S300A, or S300E), and PFKFB2 (WT, S466A, or S466E), and overexpressed them in 293T cells. Compared with PGK1-WT, the S203A mutation in PGK1 decreased the ECAR and increased the OCR of 293T cells, whereas the S203E mutation had the opposite effect (Fig. 2O–P). Similarly, compared with PDHA1-WT, the S300A mutation in PDHA1 inhibited the ECAR and increased the OCR, whereas the S300E mutation had the opposite effect (Fig. 2Q, R). In the case of PFKFB2, the S466A mutation inhibited the ECAR and increased the OCR compared with those of PFKFB2-WT, whereas the S466E mutation had the opposite effect (Fig. 2S, T). These data indicate that the phosphorylation of PGK1 at S203, PDHA1 at S300, and PFKFB2 at S466 plays crucial roles in Pim2-mediated metabolic reprogramming.
Macrophage Pim2 expression is elevated in patients with inflammatory arthritis and in CIA model miceTo investigate the relationship between inflammatory arthritis and Pim2 expression, we analyzed public data (GEO36700) to determine the mRNA levels of Pim2 in patients with various forms of arthritis, including serum-negative arthritis, microcrystalline arthritis, SLE-related arthritis, osteoarthritis (OA), and rheumatoid arthritis (RA). Pim2 was found to be more highly expressed in patients with RA than in patients with other types of arthritis (Fig. 3A). To further verify the expression of Pim2 in synovial tissues, we examined the knee joint synovial tissues of OA and RA patients. Compared with those in the synovial tissue of the OA group, the mRNA and protein expression levels of Pim2 were significantly greater in the synovial tissue of the RA group (Fig. 3B, C). We further examined the diagnostic value of Pim2 in the PBMCs of RA patients and found that the mRNA level of Pim2 in PBMCs was positively correlated with the disease activity score (DAS28), which reflects the severity of RA (Fig. 3D).
Fig. 3
Macrophage Pim2 expression is elevated in patients with inflammatory arthritis and in CIA model mice. A The expression of Pim2 in the synovial tissue of patients with arthritis was obtained from the public dataset GEO36700. B, C The mRNA and protein levels of Pim2 in the synovial tissues of patients with OA and RA (n = 6). D Pim2 was upregulated in the PBMCs of RA patients and correlated with DAS28. E Representative IHC images showing Pim2 expression in the synovium of OA and RA patients (n = 6). F Representative immunofluorescence images showing Pim2 expression in CD68+ macrophages in the synovial tissues of OA and RA patients (CD68, green; Pim2, red) (n = 6). G Representative IHC images showing Pim2 expression in the synovial tissues of NC and CIA model mice (n = 6). H Representative immunofluorescence images showing Pim2 expression in F4/80+ macrophages in the synovial tissues of NC and CIA model mice (F4/80, green; Pim2, red) (n = 6)
Immunohistochemical (IHC) analysis revealed that Pim2 expression was significantly higher in the RA group than in the OA group (Fig. 3E). Compared with that in the OA group, the infiltration of CD68+ macrophages in the synovial tissue of RA patients was markedly greater, and the expression of Pim2 in these CD68+ macrophages was significantly greater (Fig. 3F). In the CIA mouse model, a classic animal model for studying arthritis, chronic synovial inflammation and M1 macrophage polarization are crucial for the development and maintenance of arthritis [22]. Therefore, we also measured Pim2 expression in ankle joint tissue from CIA model mice and normal control (NC) mice. IHC results demonstrated that Pim2 expression was significantly increased in the CIA group (Fig. 3G). The immunofluorescence results indicated that the infiltration of F4/80+ macrophages in the synovial tissue of CIA model mice was significantly greater than that in control mice and that Pim2 expression in these F4/80+ macrophages was markedly increased (Fig. 3H). These findings suggest that Pim2 expression is elevated in macrophages in inflammatory arthritis.
Pim2 promotes M1 macrophage polarization in vitroCorrecting the skewed M1/M2 macrophage ratio in the joints of RA patients could mitigate joint damage, as M1 macrophages appear to be able to drive the pathological process of RA [23]. To further investigate the function of Pim2 in macrophage polarization, we used LPS/IFN-γ and IL-4 to induce M1-like and M2-like macrophages, respectively, in vitro. M1 induction significantly increased Pim2 mRNA and protein levels, but M2 induction did not change Pim2 mRNA or protein levels in hMDMs (Fig. 4A–C), suggesting that Pim2 plays a critical role in the regulation of M1 macrophage polarization.
Fig. 4
Pim2 promotes M1 macrophage polarization in vitro. A, B The mRNA and protein levels of Pim2 during M1/M2 polarization of hMDMs were determined by qRT‒PCR and Western blotting (n = 3). C Pim2 expression was positively correlated with M1 polarization. D, E MFI of HLA-DR and CD206 in CD68+ hMDMs treated with or without HJ-PI01 (100 or 200 nM) after M1/M2 induction, as detected by flow cytometry (n = 3). F–I mRNA and protein expression levels of inflammatory factors in hMDMs treated with or without HJ-PI01 (100 or 200 nM) after M1/M2 induction, as determined by RT‒qPCR and Western blotting (n = 3). J–K MFI of HLA-DR and CD206 in CD68+ hMDMs in the presence or absence of Pim2 knockdown after M1/M2 induction, as detected by flow cytometry (n = 3). L‒O mRNA and protein expression levels of inflammatory factors in hMDMs in the presence or absence of Pim2 knockdown after M1/M2 induction, as determined by RT‒qPCR and Western blotting (n = 3)
To investigate the effect of Pim2 inhibition on M1 or M2 macrophage polarization, we measured the expression of an M1 marker (HLA-DR) and an M2 marker (CD206) in HJ-PI01-treated hMDMs via flow cytometry. Inhibiting Pim2 with HJ-PI01 significantly decreased the mean fluorescence intensity (MFI) of HLA-DR in hMDMs after M1 induction (Fig. 4D). Conversely, HJ-PI01 treatment increased the MFI of CD206 in hMDMs after M2 induction (Fig. 4E). M1 macrophages are known to express proinflammatory cytokines, such as IL-1β, IL-6, and TNF-α, whereas M2 macrophages express anti-inflammatory cytokines, such as IL-10, TGF-β and CD206 [24]. HJ-PI01 significantly decreased the mRNA levels of M1-associated genes (IL-1β, IL-6, and TNF-α) in hMDMs after M1 induction but increased the mRNA levels of M2-mediated genes (IL-10, TGF-β, and CD206) in hMDMs after M2 induction (Fig. 4F, G). Consistent with these findings, Western blot analysis revealed that HJ-PI01 reduced the protein level of CD86 in hMDMs after M1 induction but increased the protein level of CD206 in hMDMs after M2 induction (Fig. 4H, I). These results reveal that Pim2 inhibition reduces M1 polarization but enhances M2 polarization in macrophages.
To further investigate the effect of Pim2 knockdown on M1 or M2 macrophage polarization, we measured M1 and M2 markers in hMDMs treated with si-Pim2 via flow cytometry. Pim2 knockdown decreased the MFI of HLA-DR in hMDMs after M1 induction but increased the MFI of CD206 in hMDMs after M2 induction (Fig. 4J, K). Pim2 knockdown also decreased the mRNA levels of IL-1β, IL-6, and TNF-α in hMDMs after M1 induction but increased the mRNA levels of IL-10, TGF-β and CD206 in hMDMs after M2 induction (Fig. 4L, M). Consistent with these results, Western blot analysis revealed that Pim2 knockdown reduced the protein level of CD86 in hMDMs after M1 induction and increased the protein level of CD206 in hMDMs after M2 induction (Fig. 4N, O). These observations indicate that Pim2 knockdown reduces M1 polarization but enhances M2 polarization in macrophages.
These results suggest that Pim2 promotes the proinflammatory response of macrophages by influencing M1/M2 differentiation.
Pim2 expression in macrophages is involved in the development of inflammatory arthritisTo explore the role of Pim2 in inflammatory arthritis, we generated macrophage-specific Pim2 knockout mice (Pim2fl/fl-Lyz2Cre mice) and their littermate controls (Pim2fl/fl mice) and subjected them to arthritis induction (Supplementary Fig. S6A). All the mice were genotyped via DNA electrophoresis (Supplementary Fig. S6D). The absence of Pim2 in bone marrow-derived macrophages (BMDMs) from Pim2fl/fl-Lyz2Cre mice was confirmed by Western blotting and RT‒qPCR (Supplementary Fig. S6B, C).
The CIA score was lower, and the hind paw thickness was lower in Pim2fl/fl-Lyz2Cre mice than in Pim2fl/fl mice (Fig. 5B). Consistently, Pim2fl/fl mice exhibited severe swelling, redness, and inflammatory infiltration in the joints following arthritis induction, and these effects were significantly ameliorated in Pim2fl/fl-Lyz2Cre mice (Fig. 5C). Additionally, the severe cartilage and bone destruction observed in Pim2fl/fl-Lyz2Cre mice was markedly reduced compared with that in Pim2fl/fl mice (Fig. 5C). These findings indicate that Pim2 deficiency in macrophages mitigates the development of inflammatory arthritis.
Fig. 5
Pim2 expression in macrophages is involved in the development of inflammatory arthritis. A Schematic of CIA induction in Pim2fl/fl-Lyz2Cre mice. B CIA scores and hind paw thicknesses of Pim2fl/fl and Pim2fl/fl-Lyz2Cre mice (n = 6). C Macroscopic images, micro-CT, H&E, and safranin O staining of the ankles of Pim2fl/fl and Pim2fl/fl-Lyz2Cre mice (n = 6). D The expression of TNF-α, IL-1β, IL-6 and IL-10 in Pim2fl/fl and Pim2fl/fl-Lyz2Cre mice after CIA induction, as detected by IHC. E The expression of iNOS and Arg-1 in synovial macrophages from Pim2fl/fl and Pim2fl/fl-Lyz2Cre mice, as detected by IF staining (F4/80, green; iNOS, red; Arg-1, red). F, G ECARs and OCRs of BMDMs isolated from Pim2fl/fl and Pim2fl/fl-Lyz2Cre mice after M1 induction (n = 4). H, I MFIs of MHC-II and CD206 in F4/80+ BMDMs isolated from Pim2fl/fl and Pim2fl/fl-Lyz2Cre mice after M1/M2 induction, as detected by flow cytometry (n = 6). J‒M mRNA and protein expression levels of inflammatory factors in BMDMs isolated from Pim2fl/fl and Pim2fl/fl-Lyz2Cre mice after M1/M2 induction, as determined by RT‒qPCR and Western blotting (n = 6)
The overproduction of inflammatory factors is recognized as a key regulator driving synovial inflammation and joint destruction. Therefore, we examined the levels of inflammatory cytokines in the synovial tissues of mice via IHC staining. As expected, compared with those in the blank group, the number of TNF-α-, IL-1β-, and IL-6-positive cells was significantly greater, whereas the number of IL-10-positive cells remained low in the Pim2fl/fl group. However, in the Pim2fl/fl-Lyz2Cre group, the number of TNF-α-, IL-1β-, and IL-6-positive cells was significantly decreased, whereas the number of IL-10-positive cells showed the opposite trend (Fig. 5D), suggesting that myeloid Pim2 deficiency reduces M1 polarization but enhances M2 polarization of macrophages in vivo. iNOS and Arg-1 are markers of M1-type and M2-type macrophages, respectively. We conducted immunofluorescence staining of synovial membranes from mice across all experimental groups, employing double staining for iNOS/Arg-1 and F4/80. As anticipated, the Pim2fl/fl group presented a significant increase in the number of iNOS+F4/80 + M1 macrophages, whereas the number of Arg-1 + F4/80 + M2 macrophages remained markedly low. Conversely, in the Pim2fl/fl-Lyz2Cre group, there was a notable reduction in the number of iNOS+F4/80 + M1 macrophages, accompanied by an increase in the number of Arg-1 + F4/80 + M2 macrophages (Fig. 5E). These findings further confirmed that myeloid Pim2 deficiency reduces M1 polarization but enhances M2 polarization in macrophages in vivo.
To elucidate the mechanism by which Pim2 in macrophages exacerbates inflammatory arthritis, we conducted a comparative analysis of glycolytic and oxidative phosphorylation activities in BMDMs isolated from Pim2fl/fl-Lyz2Cre and Pim2fl/fl mice, followed by treatment with LPS/IFN-γ. Moreover, the ECAR of LPS/IFN-γ-treated BMDMs from Pim2fl/fl-Lyz2Cre mice was decreased, whereas their OCR was increased (Fig. 5F, G). These findings suggest that myeloid Pim2 deficiency facilitates the metabolic transition from glycolysis to oxidative phosphorylation in macrophages.
We next determined the M1/M2 polarization of BMDMs isolated from Pim2fl/fl-Lyz2Cre and Pim2fl/fl mice. Consistently, the MFI of MHC-II was significantly lower in BMDMs from Pim2fl/fl-Lyz2Cre mice than in those from Pim2fl/fl mice after M1 induction. Conversely, the MFI of CD206 was significantly greater in BMDMs from Pim2fl/fl-Lyz2Cre mice than in those from Pim2fl/fl mice (Fig. 5H, I). Similar results were observed for the expression of key inflammatory factors in M1/M2 macrophages. Compared with those from Pim2fl/fl-Lyz2Cre mice, BMDMs from Pim2fl/fl-Lyz2Cre mice expressed lower mRNA levels of TNF-α, IL-1β, and IL-6 after M1 induction (Fig. 5J). Conversely, BMDMs from Pim2fl/fl-Lyz2Cre mice expressed higher mRNA levels of IL-10, TGF-β, and CD206 than did those from Pim2fl/fl mice after M2 induction (Fig. 5K). Additionally, the protein levels of iNOS were significantly decreased after M1 induction, whereas the protein levels of CD206 were increased after M2 induction in Pim2fl/fl-Lyz2Cre mice compared with Pim2fl/fl mice (Fig. 5L, M). These results suggest that myeloid Pim2 deficiency reduces M1 polarization but enhances M2 polarization in macrophages in vitro.
These findings suggest that Pim2 exacerbates inflammatory arthritis primarily by promoting glycolysis and M1 polarization in macrophages.
Pim2 is a therapeutic target for inflammatory arthritisGiven that Pim2 exacerbates inflammatory arthritis, as suggested by the findings above, inhibiting Pim2 may slow the progression of this disease. To test this hypothesis, CIA model mice were generated, and the Pim2 inhibitor HJ-PI01 was administered orally (Fig. 6A). The CIA score was lower, and the hind paw thickness was lower in the HJ-PI01 group than in the control group (Fig. 6B). Consistently, HJ-PI01 treatment alleviated swelling and redness, decreased inflammatory cell infiltration, and reduced cartilage erosion and bone destruction in CIA model mice, as demonstrated by H&E staining, safranin O staining, and micro-CT, respectively (Fig. 6C).
Fig. 6
Pim2 is a therapeutic target for inflammatory arthritis. A Schematic of CIA model mice treated with HJ-PI01 (10 or 20 mg/kg). B CIA scores and hind paw thickness of the mice in each group (n = 6). C Macroscopic images, micro-CT, H&E, and safranin O staining of the ankles from the mice in each group (n = 6). D The expression of TNF-α, IL-1β, IL-6 and IL-10 in the mice in each group, as detected by IHC (n = 6). E The expression of iNOS and Arg-1 in the synovial macrophages of the mice in each group, as detected by immunofluorescence staining (F4/80, green; iNOS, red; Arg-1, red) (n = 6)
Next, we measured the levels of inflammatory cytokines in the synovial tissues of the mice via IHC staining. Compared with those in the control group, the number of TNF-α-, IL-6-, and IL-1β-positive cells in the HJ-PI01 group was significantly lower, whereas the number of IL-10-positive cells was markedly greater (Fig. 6D). Furthermore, immunofluorescence staining of the synovium revealed a substantial decrease in the number of iNOS+F4/80 + M1 macrophages and a significant increase in the number of Arg-1 + F4/80 + M2 macrophages in the HJ-PI01 group (Fig. 6E). These findings corroborate that Pim2 inhibition with HJ-PI01 reduces M1 polarization but enhances M2 polarization in macrophages in vivo.
To confirm that the immune modulation of HJ-PI01 is specifically mediated by the inhibition of PIM2, we conducted genetic knockout experiments in both cell and animal models. At the cellular level, HJ-PI01 treatment inhibited M1 polarization in BMDMs derived from Pim2fl/fl mice while promoting M2 polarization. In contrast, BMDMs from Pim2fl/fl-Lyz2Cre mice presented reduced M1 polarization and enhanced M2 polarization, and HJ-PI01 treatment did not further affect their M1/M2 polarization balance (Supplementary Fig. S7A–F). At the animal level, HJ-PI01 treatment improved arthritis symptoms in Pim2fl/fl mice by reducing M1 macrophage infiltration in synovial tissues and increasing M2 macrophage infiltration. However, in Pim2fl/fl-Lyz2Cre mice, which exhibited only mild arthritis symptoms, HJ-PI01 treatment had no further effect on arthritis progression (Supplementary Fig. S7G–K). These results are sufficient to indicate that HJ-PI01 exerts its regulatory effect on macrophage polarization by targeting PIM2 inhibition, thereby improving inflammatory arthritis.
These results suggest that targeting Pim2 to inhibit M1 macrophage polarization may be a therapeutic strategy for treating inflammatory arthritis.
The FDA-approved drug bexarotene inhibits macrophage M1 polarization and alleviates arthritis in CIA model miceDrugs targeting Pim2 have not yet been approved for clinical use, limiting the application of Pim2 as a therapeutic target for the treatment of human diseases. To identify potential drugs that target Pim2, we performed molecular docking and dynamic simulations via the FDA Drugs Database. Drug-binding scores for the pockets of Pim2 were analyzed via the PROTEIN PLUS website (Supplementary Tables S1 and 2). Various structures of human Pim2, including 2IWI and 4X7Q, have been used for molecular docking. A total of 2,115 FDA-approved drugs were selected for docking analysis. The top 30 drugs with the lowest binding energies in each molecular docking scenario were identified, and 10 drugs—azelastine, bexarotene, dasabuvir, differin, eltrombopag, ergotamine, irinotecan, lumacaftor, nilotinib, and rolapitant—were selected for further analysis (Fig. 7A). The binding energies and rankings of these ten drugs are listed in Supplementary Table S3. To verify the potential of these FDA-approved drugs to target Pim2, we measured the enzymatic activity of Pim2 following incubation with each drug. The results showed that bexarotene inhibited Pim2 activity in a concentration-dependent manner, and its inhibitory effect was slightly weaker than that of HJ-PI01. Nilotinib and irinotecan exhibited slight inhibitory effects, whereas the other seven drugs had no inhibitory effects (Supplementary Fig. S8A).
Fig. 7
The FDA-approved drug bexarotene inhibits M1 macrophage polarization and alleviates arthritis in CIA model mice. A Workflow of the molecular docking and virtual screening analyses. B Molecular docking of bexarotene to Pim2 and the bonds between bexarotene and Pim2. C Pim2 (2IWI or 4X7Q) interacting with bexarotene at the beginning and end of 40-ns molecular dynamics simulations. D, E The RMSD and potential energy plot indicating the interaction between Pim2 and bexarotene (PDB 2IWI). F, G The RMSD and potential energy plot indicating the interaction between Pim2 and bexarotene (PDB ID: 4X7Q). H, I MFIs of HLA-DR and CD206 in CD68+ hMDMs treated with or without bexarotene (200 or 400 nM) after M1/M2 induction, as detected by flow cytometry (n = 3). J Schematic of CIA model mice treated orally with bexarotene (25 or 50 mg/kg). K CIA scores and hind paw thickness of the mice in each group (n = 6). L Macroscopic images, micro-CT, H&E, and safranin O staining of the ankles from the mice in each group (n = 6). M The expression of TNF-α, IL-1β, IL-6 and IL-10 in mice from each group after CIA induction, as detected by IHC. N The expression of iNOS and Arg-1 in the synovial macrophages of the mice in each group, as detected by immunofluorescence staining (F4/80, green; iNOS, red; Arg-1, red)
Next, the interaction between bexarotene and Pim2 was further validated. Visual analysis revealed that bexarotene docks to human Pim2 through hydrogen bonds and hydrophobic bonds, suggesting that bexarotene could influence the ATP binding pocket to inhibit Pim-2 (Fig. 7B). Bexarotene was selected for further molecular dynamic simulations. The root mean square deviation (RMSD) and total energy analyses revealed that the Pim2(2IWI)-bexarotene complex and Pim2(4X7Q)-bexarotene complex were stabilized during the 40 ns simulations (Fig. 7D, E). Furthermore, the structures of the Pim2-bexarotene complexes at the end of the dynamic simulations did not show dramatic changes compared with the original Pim2-drug complex structures (Fig. 7C). These results suggest that bexarotene may specifically target Pim2, indicating its potential for treating inflammatory arthritis.
To explore the effects of bexarotene on the metabolic reprogramming of macrophages in vitro, we initially assessed the glycolytic and oxidative phosphorylation activities in hMDMs treated with bexarotene upon M1 induction. Compared with untreated hMDMs, LPS/IFN-γ-treated hMDMs presented elevated lactate levels and reduced ATP levels, and these effects were reversed by bexarotene (Supplementary Fig. S8B, C). Additionally, compared with untreated hMDMs, LPS/IFN-γ-treated hMDMs presented a greater ECAR and a lower OCR; however, bexarotene reversed these effects (Supplementary Fig. S8D, E). These results indicate that bexarotene promotes the metabolic shift from glycolysis to oxidative phosphorylation in macrophages. Furthermore, we measured the impact of bexarotene on M1/M2 macrophage polarization. Bexarotene significantly reduced the MFI of HLA-DR in LPS/IFN-γ-treated hMDMs but increased the MFI of CD206 in IL-4-treated hMDMs compared with that in untreated hMDMs (Fig. 7H, I). RT‒qPCR analysis revealed that treatment with bexarotene significantly decreased the mRNA levels of IL-1β, IL-6, and TNF-α in the LPS/IFN-γ-treated hMDMs but increased the mRNA levels of IL-10, TGF-β and CD206 in the IL-4-treated hMDMs (Supplementary Fig. S8F, G). Consistently, Western blot analysis revealed that bexarotene reduced the expression of CD86 in hMDMs after M1 induction but increased the expression of CD206 in hMDMs after M2 induction (Supplementary Fig. S8H, I). These results indicate that bexarotene reduces M1 polarization but enhances M2 polarization of macrophages in vitro.
To investigate the therapeutic efficacy of bexarotene in inflammatory arthritis, bexarotene was administered to inflammatory arthritis model mice (Fig. 7J). The CIA score and hind paw thickness were decreased in bexarotene-treated mice (Fig. 7K). Consistently, bexarotene treatment alleviated swelling and redness, decreased inflammatory cell infiltration, and ameliorated cartilage erosion and bone destruction in CIA model mice, as evidenced by H&E staining, safranin O staining, and micro-CT, respectively (Fig. 7L). Additionally, we examined the levels of inflammatory cytokines in the synovial tissues of the mice via IHC staining. Compared with those in the CIA group, the number of TNF-α-, IL-6-, and IL-1β-positive cells was significantly lower in the bexarotene group, whereas the number of IL-10-positive cells was significantly greater (Fig. 7M). Subsequent immunofluorescence staining revealed that the number of iNOS+F4/80 + M1 macrophages was significantly reduced in the bexarotene group, whereas the number of Arg-1 + F4/80 + M2 macrophages was significantly increased (Fig. 7N). These observations indicate that bexarotene reduces M1 polarization but enhances M2 polarization of macrophages in vivo.
Given the well-established role of the retinoid X receptor (RXR) in inflammation and immune regulation by bexarotene [25], we conducted additional genetic and pharmacological experiments to assess whether the observed anti-inflammatory effects are driven predominantly by PIM2 inhibition or RXR activation. In vitro, the RXR-selective agonist LG268 significantly inhibited M1 polarization in BMDMs derived from Pim2fl/fl mice, although its effect was weaker than that of bexarotene. When BMDMs derived from Pim2fl/fl-Lyz2Cre mice displayed reduced M1 polarization and enhanced M2 polarization, neither bexarotene nor LG268 appeared to further influence the M1/M2 polarization balance (Supplementary Fig. S9A–F). In vivo, LG268 significantly improved arthritis symptoms in Pim2fl/fl mice, but its therapeutic effect was weaker than that of bexarotene. In Pim2fl/fl-Lyz2Cre mice, which presented significantly milder arthritis symptoms, neither bexarotene nor LG268 seemed to provide additional improvement (Supplementary Fig. S9F, G). These results suggest that RXR activation is at least partially involved in the in vitro and in vivo anti-inflammatory effects of BEX.
Taken together, these findings suggest that bexarotene modulates macrophage metabolic reprogramming and M1/M2 polarization through a dual mechanism of synergistically inhibiting Pim2 activity and activating RXR, thereby mitigating the progression of inflammatory arthritis.
NM@NP-Bex inhibits macrophage M1 polarization and alleviates arthritis in CIA model mice in a targeted and safe mannerBexarotene is used primarily for the clinical treatment of refractory early-stage cutaneous T-cell lymphoma (CTCL). However, its use is associated with several side effects, including leukopenia, anemia, hyperlipidemia, hypothyroidism, and hepatotoxicity [26]. These adverse effects limit its broader application in treating other diseases. Therefore, we developed a targeted delivery system that can enhance the therapeutic efficacy of bexarotene while minimizing its systemic toxicity and side effects. As shown in Supplementary Fig. S10A, bexarotene was loaded into PLGA-based nanoparticles (NP-Bex). The NPs were coated with neutrophil-derived membranes (NM) via ultrasonication to generate NM@NP-Bex. Compared with that of NP-Bex, the hydrodynamic diameter of NM@NP-Bex increased by approximately 11 nm, indicating successful encapsulation of the neutrophil membrane on the surface of NP-Bex (Supplementary Fig. S10B, C). Additionally, the negative zeta potential of NM@NP-Bex was lower than that of the core (Supplementary Fig. S10D). The drug loading efficiency of NM@NP-Bex was 8.48%, and the encapsulation efficiency was 54.5% (Supplementary Fig. S10E). The drug release curve indicated that NM@NP-Bex also exhibited sustained release of bexarotene (Supplementary Fig.
Comments (0)