
Remember me


The analysis of MBEN samples with their unique microanatomy and cellular compositions was performed on fresh frozen tissue sections from four distinct patients (Additional file 1: Table S1) using different ST methods (Fig. 1). These patients were previously studied with sequencing, microdissection, and spatial technologies [20].
Fig. 1
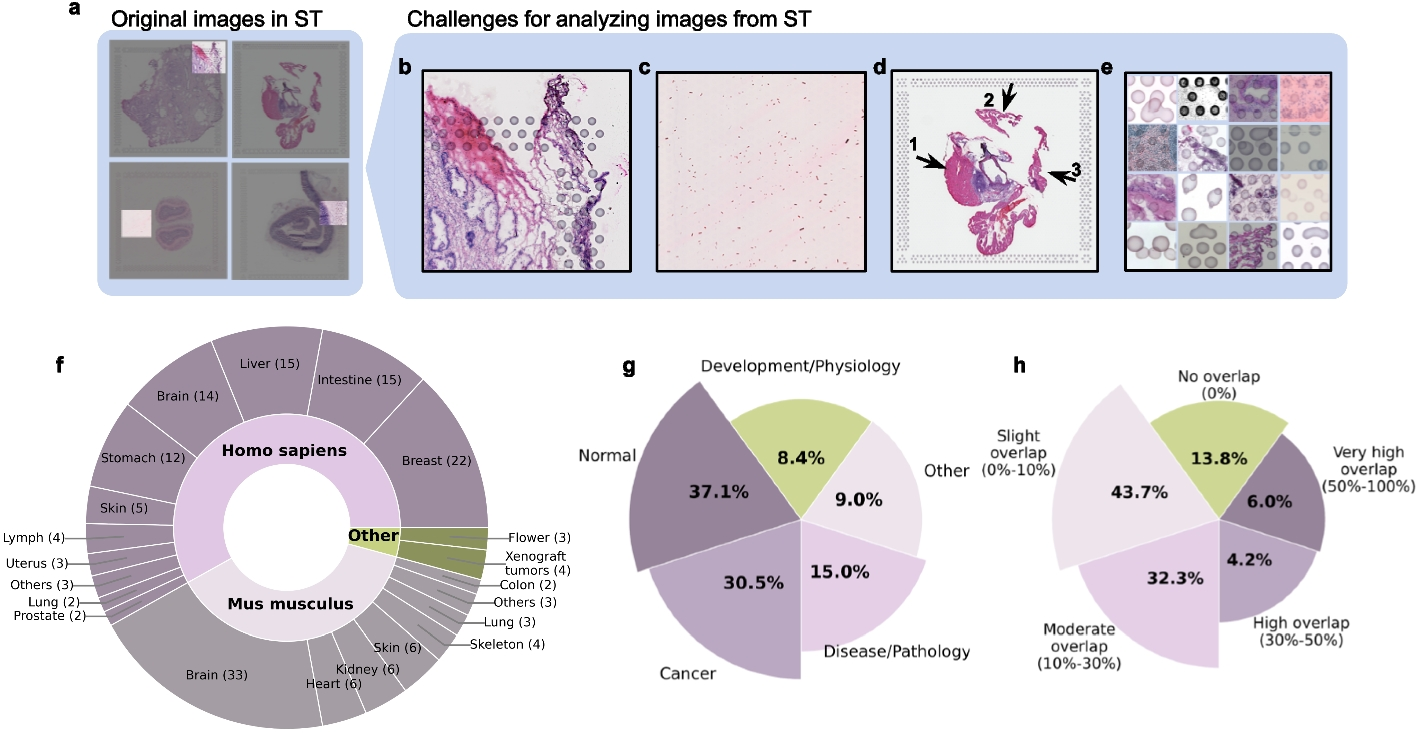
Overview of ST technologies compared in this study. Marker genes NRXN3 (magenta, nodular compartment), LAMA2 (green, internodular compartment), and MKI67 (orange, proliferating cells) are shown for sample MB295. a H&E reference staining [20]. b Visium. c RNAscope. d Molecular Cartography. e Merscope. f Xenium
Exemplary tissue images are presented for hematoxylin and eosin (H&E) staining (Fig. 1a) alongside the various ST technologies utilized (Fig. 1, Additional file 2: Fig. S1, Additional file 3: Table S2). These included Visium (Fig. 1b), RNAscope (10 gene panel, Fig. 1c), MC (100 gene panel, Fig. 1d), Merscope (138 gene panel, Fig. 1e), and Xenium (345 gene panel, Fig. 1f) (Supplementary Dataset 1). All iST panels encompassed the 10 genes from RNAscope, while MC, Merscope, and Xenium panels shared 96 genes. The MBEN tumor microanatomy is visible in the H&E staining, and its structure was highlighted by all iST methods at the transcript level, with the transcription of NRXN3 and LAMA2 as marker genes for the nodular and internodular compartments, respectively (Fig. 1). However, the Visium analysis did not offer sufficient spatial resolution to distinctly delineate the two tumor compartments, as indicated by the NRXN3/LAMA2 expression ratio (Fig. 1b). Additionally, we incorporated snRNA-seq data generated on the Chromium platform as a reference for a single-cell transcriptome analysis of solid tumor samples.
ST image acquisition and reimaging of slidesFor Visium and RNAscope experiments, image acquisition is decoupled from transcript detection and decoding. For Visium, H&E images were acquired on a slide scanner, and the RNAscope iST data was acquired by spinning disk confocal microscopy (SDCM). The commercial MC 1.0, Merscope V1, and Xenium instruments provide automated image acquisition on a built-in wide-field fluorescence microscope. The three systems differ in objectives, cameras, and preprocessing software (Table 1). All systems generally decode the transcript identities from fluorescent signals across several rounds of staining, imaging, and destaining and yield transcript coordinates and a matching tissue map as a DAPI image.
Table 1 Feature overview of automated iST platformsTo compare the resolution of the iST platforms, we imaged 0.31 µm multicolor fluorescent particles across all systems. We analyzed the full width at half maximum (FWHM) of the beads (Additional file 4: Fig. S2). For comparison, we included SDCM images obtained with 40× and 60× oil immersion objectives under the same conditions used for RNAscope and reimaging, respectively. Overall, the observed FWHM was very similar for Xenium (474 ± 55 nm) and Merscope (480 ± 85 nm). For MC, the FWHM was only 352 ± 50 nm, which could indicate a deconvolution step in the onboard image processing pipeline before image stitching. The optical resolution of the automated microscopy systems limits the separation of crowded (highly expressed) transcripts of the same gene and the total number of transcripts that can be detected. In contrast, transcripts of different genes can be separated even when localizing to the same pixel. This is achieved through an intelligent combinatorial barcoding codebook design, along with a sufficiently large number of imaging rounds and colors, as well as the inclusion of the z coordinates for decoding. This holds true for Xenium and Merscope, where we found a minimal distance between any two transcripts that was below one pixel. For MC, the minimal distance between any two transcripts was larger than one pixel (Table 1).
The iST systems used in this study implement different smRNA-FISH protocols. The most prominent difference is the presence (Xenium, RNAscope) or absence (MC, Merscope) of secondary signal amplification and clearing of the tissue section (Merscope only). To estimate the signal-to-noise and signal-to-background ratios, we also analyzed actual transcript spots in single-tile z stacks (Additional file 5: Fig. S3a). Unfortunately, these are not provided for Xenium (even upon request to 10x Genomics) and are, therefore, missing from this assessment. As we could not match the provided raw data (single tile stacks) confidently to the actual transcript coordinates, spots on the images were called using RS-FISH [25]. Then, we analyzed line profiles (x-direction) spanning 10 pixels on either side of the spot center. The background levels were more homogeneous for Merscope as expected due to the clearing step. However, the signal-to-noise ratio was slightly higher for MC and even higher, but also more variable for RNAscope (Additional file 5: Fig. S3b). Last, the signal-to-background ratio was higher and more variable for RNAscope as expected for a method relying on secondary signal amplification. Overall, we conclude that the experimental procedures for all analyzed methods result in spots that can be readily separated from background. We anticipate that the major challenge lies rather in the reidentification of the same spots across all imaging rounds required for decoding the combinatorial barcodes.
After the ST run, conducting a reimaging step may be beneficial to acquire higher resolution images (e.g., improved DAPI images for cell segmentation, see below) or to include additional imaging modalities such as H&E, membrane, or immunostaining. For MC and Xenium, this process is straightforward since tissue integrity is preserved during the runs and standard slide formats are utilized (Additional file 2: Fig. S1).
We have developed a workflow for MC and Xenium that involves reimaging the slides using SDCM, with the resulting images registered to the original wide-field DAPI images obtained from the automated systems (Fig. 2a). Reimaging of Merscope slides was not tested because the sample clearing step prior to the run removes all tissue components except RNA and DNA. To overlay images of the tissue obtained from a different microscope, images (maximum intensity projections) were first stitched together and then registered to the DAPI images from the iST analysis of the MC or Xenium system. This approach allows for the integration of the cells’ transcriptome profile with additional readouts.
Fig. 2
Reimaging and segmentation. a Reimaging workflow for MC and Xenium slides. b Widefield overview DAPI image, zoomed-in and segmented image for MC. c Same as panel b after applying the MindaGap software to fill the non-overlapping line between images. d Same region as panels b and c after reimaging with the spinning disk microscope. e The gap between images introduces artifacts in stitching and registration, leading to the artificial generation of duplications for 0.15% of the transcripts. f Segmentation for Merscope with membrane staining. Left: DAPI-stained wide-field image; middle: membrane staining; right: segmentation based on DAPI signal and membrane staining. g DAPI images (zoomed in on the indicated regions) of the Xenium slide and segmentation based on SDCM and widefield images for tumor tissue MB266. The region overview is represented as a transcript density map. The fraction of transcripts assigned to segmented nuclei or cells was 68% for Xenium SDCM nuclei (Cellpose-based segmentation of Xenium slide reimaged by SDCM), 59% for Xenium nuclei (Cellpose-based segmentation on the original Xenium image), and 95% for Xenium cells (original segmentation provided by the Xenium workflow). The cell expansion used for the latter segmentation covers nearly all transcripts. However, this is associated with artifacts, as indicated for the cells marked with arrowheads. For quantification, see Additional file 6: Fig. S4
Although stitching and registration are generally seen as standard image processing tasks, they can be challenging in practice due to several factors. First, multiple rounds of transcript detection (MC: 8, Merscope: 18, Xenium: 15) involving washing, bleaching, and recoloring can compromise tissue integrity, making reimaging to enhance the DAPI signal ineffective. While we have not observed this in our MBEN samples, we do not rule it out for other tissue types or additional staining procedures (e.g., for proteins or DNA). Second, registration becomes difficult when the tissue is not firmly attached to the slide, causing deformation during the imaging processes, or when stitching is inaccurate on either the registration source or template. We have rarely noticed deformation, and when it does occur, it is mostly limited to single cells rather than large tissue areas. Stitching artifacts were an issue for MC (see below), but these could be resolved by using elastic transformations instead of affine ones. Lastly, evaluating the quality of the registration results is difficult because the intensity distributions across the tissue and even within single cells vary significantly between confocal and widefield images, rendering correlation metrics unsuitable. Practically, we performed a pairwise overlay of the DAPI images from different modalities and visually inspected the results.
Image processing and cell segmentationTo assign transcripts to individual cells after segmentation, several image processing steps were performed. Unless noted otherwise, we used segmentation based on DAPI staining (MC), DAPI and membrane staining (Merscope), and DAPI staining with cell expansion (Xenium) as the default workflows for the various systems. We find that the quality of DAPI images is critical and strongly relies on experimental factors (tissue quality and staining) as well as technical aspects, namely image acquisition parameters (excitation intensity, exposure time, dynamic range of the detector), image resolution and out-of-focus signal for the wide-field microscopes used in these systems. Therefore, it is essential to optimize the DAPI signal-to-noise ratio and to avoid too low a signal as well as overexposure.
The DAPI image quality obtained with the default settings of automated iST systems can be insufficient for resolving single cells in the highly cell-dense MBEN tissue sections. To evaluate the impact of this issue for the subsequent preprocessing and segmentation methods, we also acquired SDCM images for MC and Xenium (referred to as “MC SDCM” and “Xenium SDCM”). In cell-dense regions, analysis of the original wide-field images can yield ambiguous results. This is demonstrated for the MC workflow in Fig. 2b–d. The analysis also highlighted stitching artifacts caused by non-overlapping images, resulting in black strips that bisect cells spanning across imaging tiles (Fig. 2b). On the image analysis side, Gaussian blurring can mitigate this issue (Fig. 2c). Still, the inaccurate stitch borders may lead to duplicate transcripts. To further explore this concern, the confocal images were registered, and the transcript duplicates were eliminated (Fig. 2d). These duplicates were identified at a low but still detectable frequency of 0.15% across all transcripts (Fig. 2e). It is important to note that inaccurate stitch borders in the registration template (i.e., the original DAPI image) hinder the use of robust affine registration models in most cases, as they result in systematic shifts across the large dimensions of the imaged areas. Instead, we employed elastic registration with bUnwarpJ in Fiji [26], which locally adjusts the images at inaccurate stitch borders, yielding excellent results despite being less robust and more contingent on initial registration parameters. This type of stitching error was not observed with Merscope and Xenium systems. Lastly, the option available for Merscope to incorporate membrane staining into the standard workflow can enhance cell segmentation in wide-field areas, as illustrated in Fig. 2f. The same objective can be addressed for Xenium with the newly introduced multi-tissue stain mix [27]. It combines nuclear (DAPI), membrane (ATP1A1, E-Cadherin, CD45), cytoplasmic (18S rRNA), and cytoskeletal (αSMA, Vimentin) stains to facilitate cell segmentation.
In general, segmentation with Cellpose [8] using the DAPI signal yielded good results, and the SDCM images showed a 15–30% higher count of segmented nuclei. This is demonstrated for sample MB266 in Additional file 6: Fig. S4a–d. Approximately 71% (MC) and 68% (Xenium) of the total detected transcripts were found within the segmented nuclei. In contrast, nuclei segmentation on the corresponding widefield image resulted in roughly 10% fewer assigned transcripts to nuclei (MC, 58%; Xenium, 59%). This discrepancy can be partly attributed to the lower total number of segmented nuclei in the widefield images (~ 28% for MC and ~ 15% for Xenium in the case of MB266). However, it is important to note that not only does the number of segmented cells or nuclei matter, but also their size and shape. More transcripts were detected in larger cells. Furthermore, the area covered by segmented cells/nuclei also needs to be considered. Simply extending segmented nuclei to include cytoplasmic transcripts led to some incorrectly assigned transcripts, resulting in a mixed transcriptome from different cells (Fig. 2g). Notably, the improved segmentation result from SDCM DAPI reimaging does not stem from higher resolution per se (Additional file 4: Fig. S2), but rather from the suppression of out-of-focus light in confocal microscopy, which yields more contrasted and detailed nuclei (Additional file 6: Fig. S4e–f).
Sensitivity of ST methodsThe sensitivity of ST methods can be defined as the fraction of transcripts detected. To assess this parameter, we analyzed the distribution of the total number of transcripts detected (“transcripts”) as well as the number of genes (“features”) for the shared 96 gene panel common to all ST methods except RNAscope. To eliminate the confounding effect of segmentation, we conducted a spatial binning analysis as a segmentation-free approach. The number and type of transcripts were determined within spatial bins (48.74 × 48.74 µm) that correspond to the area of a circular Visium spot, which is approximately 2375 µm2 in size. The iST techniques clearly outperformed the Visium sST method regarding the number of transcripts and features in this comparison (Fig. 3a). While increasing the sequencing depth might improve the Visium results, we still expect that Visium’s sensitivity will remain considerably lower than that of the iST techniques. Among the latter group, MC yielded the highest number of transcripts per bin, while the number of features was similar across all automated iST methods. Interestingly, the spatial binning analysis yielded a bimodal distribution for Xenium, indicating the presence of tissue regions with decreased transcript coverage. The bins within the lower transcript distribution were enriched in the outer regions of the tissue in line with the observation that tissue borders often suffer more damage during freezing and cutting processes (Additional file 7: Fig. S5a).
Fig. 3
Sensitivity of ST methods. a Density ridge plots showing transcript and feature counts per spatial bin (48.74 µm side length square), equivalent to the area of one Visium spot. b Density ridge plots of transcript and feature counts per cell after segmentation for 96 shared genes. c Same as panel b, but for the 10 shared genes included in the RNAscope panel. d Correlations of transcript counts between different iST methods, with the dashed line indicating the equivalent number of transcripts detected for the two methods compared. Correlations of automated iST with snRNA-seq data are provided in Additional file 7: Fig. S5b–d
Next, the number of transcripts or features was calculated per cell for the 96 gene set (Fig. 3b). This comparison revealed only minor sensitivity differences among the automated iST instruments. The well-established RNAscope method consistently produced high numbers of transcripts/features per cell for the 10 shared genes (Fig. 3c). This result confirms its use as an smRNA-FISH reference in the field. We then conducted a pairwise comparison of the detected mean transcripts per cell across the different iST methods for the shared gene set (Fig. 3d). Some genes with lower expression levels, such as BOC, appeared to be better detected on a per-cell basis by Merscope and Xenium compared to MC. This might also stem from variations in the segmentation protocol, as the extension of the cells in the Xenium analysis results in nearly complete coverage of the tissue area.
The same analysis was applied in reference to snRNA-seq, which has a reported detection efficiency of 14–15% for the Chromium 3′-RNA v2 chemistry (10x Genomics) used in our experiments (Additional file 7: Fig. S5b–d). The resulting correlation coefficients of iST methods with snRNA-seq were between 0.53 and 0.63, which is somewhat lower than the coefficients between the iST methods themselves, ranging from 0.7 to 0.84 (Fig. 3d). On average, the number of a given transcript per nucleus or cell was 2.3- to 2.5-fold higher for the iST methods than for snRNA-seq (Fig. 3b, Additional file 7: S5b–d). This suggests that the detection efficiency of the iST methods is approximately 33–37%.
Overall, the automated iST methods produced very similar results, with MC showing a slightly lower count of less abundant transcripts per cell when using different default segmentation methods. When assessing the number of transcripts and molecules per cell, all iST techniques demonstrated higher sensitivity than snRNA-seq performed with the Chromium v2 chemistry.
Specificity of automated iST methods using RNAscope as a referenceTo assess ST specificity, we used the 10 genes mapped in the RNAscope data as a reference. We calculated the correlations of the mean number of transcripts per cell for these 10 genes. The highest correlation was found between RNAscope and Xenium (Fig. 4a). Next, we computed pairwise correlation coefficients for transcripts within a cell for each of the different methods (Fig. 4b).
Fig. 4
Comparison with RNAscope. a Correlation of gene expression across different automated iST methods with RNAscope for the 10 shared genes. The dashed line represents the same number of transcripts detected by the two methods being compared and indicates that 7 out of 10 (MC) and 8 out of 10 genes (Merscope, Xenium) exhibited a higher number of transcripts per cell/nucleus, while CNTN2 was identified more effectively with all automated iST methods. b Analysis of marker gene co-expression from the pairwise Pearson correlation coefficient
This correlation analysis indicated that the RNAscope data accurately reflected the MBEN tissue microanatomy described in ref. [20]. Marker genes of the nodular compartment (RBFOX3, NRXN3) and those of the internodular compartment (GLI1, TRPM3, LAMA2, and PTCH1) showed high positive correlations within their respective groups but were neither correlated nor anti-correlated between the two groups. The Merscope data was most similar to the pattern of (anti-)correlations between gene pairs observed in the RNAscope data (coefficient of determination R2 = 0.72), while this pattern was somewhat less apparent for the other methods (MC, R2 = 0.45; Xenium, R2 = 0.58) (Additional file 8: Table S3). This type of assessment relies on prior knowledge about the spatial expression patterns of a given tissue and can be implemented after cell segmentation as a quality assessment for specific marker genes that exhibit distinct spatial relations, as demonstrated here for MBEN.
Specificity of iST methods inferred from background probesNext, we assessed specificity by relating the signal from fluorescently labeled control probes, referred to as background probes here, which lack a complementary sequence in the sample across different length scales (Fig. 5). It is important to note that the manufacturers supplied the background probes, and information regarding their sequences is lacking. The three iST methods also utilize different controls (Additional file 9: Table S4). MC and Merscope rely on the binding of numerous probes to achieve a sufficient signal. Consequently, false positive signals typically arise from the read-out probes rather than the primary probes, as a single, incorrectly bound primary probe yields fluorescence signals below the detection limit and will therefore be “invisible”. In the case of Xenium, due to the amplification of the signal from a single padlock probe, both off-target binding of primary and secondary probes must be considered. Accordingly, unspecific primary probes are also included in the kit.
Fig. 5
Specificity analysis comparing target and background probes. Data are shown for MB266. a Approach for the specificity analysis across different length scales. Coordinates for three different transcripts are represented in purple (NRXN3), green (LAMA2), and orange (MKI67). Left: whole tissue analysis with target and background probes ranked by summing all signals detected for each probe. Middle: spatial autocorrelation of probe signal calculated using Moran’s I. This value increases if a given cell’s signal (indicated by outgoing distance vectors) is similar to the average signal of neighboring cells at distance r, as shown by the connecting vectors, weighted by 1/r between two cells (vector thickness indicates greater weights). Right: minimal distance to the nearest probe signal of the same type. This parameter helps to identify clusters at subcellular resolutions arising from rare and isolated cell types. Exemplary pairs of transcripts are marked with white arrows. b Ranked target and background sum counts for all targets and the corresponding technology-specific background probes (see Additional file 9: Table S4, Additional file 10: Fig. S6). c Analysis of the spatial distribution of target and background probes. Moran’s I (scaled from 0 to 1) was plotted against the median nearest neighbor distance. Higher values of Moran’s I and lower nearest neighbor distances indicate a non-random distribution. The gray area highlights low confidence probes based on the 0.05 percentile of the nearest neighbor distance within a given range of Moran’s I
By comparing the sum of all signals from a given probe across the entire tissue, we identified 29 ± 8 (MC), 43 ± 2 (Merscope), and 18 ± 2 (Xenium) probes for which the signal range fell within that of the background probes (Fig. 5b). Among these, the genes GFI1, LMX1 A, IL4, FOXJ1, CD19, TMEM119, MOG, CD69, and GFI1B exhibited consistently low expression values across all three automated iST technologies. This could indicate true negative signals or RNAs that are difficult to target, e.g., due to stable secondary structures. Based on the evaluations of target and background probes, we calculated global, segmentation-free FDR values of 0.41 ± 0.2% (MC), 5.23 ± 0.9% (Merscope), and 0.47 ± 0.1% (Xenium). According to these average global FDR estimates, the specificity is quite similar for MC and Xenium, with Merscope showing a higher FDR value.
The average FDR value does not account for specific signals that are simply low in abundance. Therefore, we evaluated the spatial distribution of the target probes (Fig. 5a). We computed their spatial autocorrelation using Moran’s I [28, 29] and assessed the minimal distance between probe signals targeting the same RNA. The analysis of Moran’s I was based on the premise that a false positive signal due to technical issues would be randomly distributed (I = 0). In contrast, a lowly abundant true positive signal (for example, a lowly expressed marker for a niche cell type) would exhibit some enrichment (I > 0) and/or display clustering at the (sub)cellular level within isolated rare cell types that would result in a low minimal distance. By combining spatial autocorrelation signals with nearest neighbor distances, specific cut-offs can be established to identify targets that exhibit a lowly abundant signal that is not randomly distributed within tissue space (Fig. 5c, Additional file 10: Fig. S6a).
The spatial autocorrelation analysis was performed at the resolution of individual cells and their neighboring cells, while the distance to a transcript’s next nearest neighbor also encompasses subcellular distances. This distance tends to be small for transcripts primarily located in isolated rare cell types scattered throughout the tissue sections. We applied a 0.95 percentile cut-off for a given Moran’s I range, with four distinct ranges for each technique based on Supplementary Dataset 2. The number of confident transcripts increased for all techniques compared to the expression level analysis. On average, 7 ± 3 (Xenium), 12 ± 3 (MC), and 17 ± 3 (Merscope) transcripts did not meet the threshold (as demonstrated in Fig. 5c). This indicates a slightly noisier signal for the latter method, which aligns with its higher average FDR value.
We also examined the spatial distribution of target and background probes in relation to the segmented area by measuring the ratio of probe signals inside and outside nuclei. This analysis yielded similar results for both target and background probes across technologies and tissue samples, even when using nuclear segmentation with no expansion (Additional file 10: Fig. S6b,c). Thus, the majority of the signals from both target and background probes were located in the nucleus. Finally, we explored the distribution of detected molecules across the recorded z-levels for each technology. While MC and Xenium yield images for a wide range of z-values from below to above the actual sample, detected molecule numbers were high for all seven z planes for Merscope, and the distribution appeared to be cut off (Additional file 10: Fig. S6 d). This suggests that a significant number of molecules above and below the seven imaged planes in Merscope remain undetected.
Detection of cell types across platformsTo compare cell type identification across different technologies, we followed standard clustering workflows, assigned cell types based on the expression signatures identified in our previous MBEN study [20], and visualized the data using UMAPs (Fig. 6a–c, Additional file 11: Fig. S7). The overall cell type annotations were very similar for the iST methods, and the same major cell types were found across all platforms. However, inspection of the cluster heatmaps revealed differences in the detection efficiency of single transcripts that affect cell type assignment (Additional file 11: Fig. S7 d–f, Supplementary Dataset 3). For example, a TULP1-positive cell type (MC), a differentiated neuronal-like cell type marked by KHDRBS2 (Merscope), and CD19+ (Xenium) were specific for the three different platforms. Thus, cell type annotations differ between technologies mainly due to lowly abundant transcripts detected better on one platform than on another. For example, as illustrated in Fig. 5b and c, the specificity of CD19 detection was similar to that of the background probe, which demonstrates the need to consider this technical aspect for cell type assignment.
Fig. 6
Clustering and cell type annotation for iST methods. Clustering was based on the shared set of 96 genes in samples MB266, MB295, and MB299. The joint cell type annotation relied on the expression signatures of the different clusters described in Additional file 11: Fig. S7. a Clustering and UMAP visualization for MC (n = 106,403 cells). b Same as panel a, but for Merscope (n = 139,916 cells, MB266 and MB295 only). c Same as panel a, but for Xenium (n = 569,152 cells). d Images with cells colored according to their cluster. e Same as panel d, but for Merscope. f Same as panel d, but for Xenium. g Heatmap showing the z-scores of the enrichment or depletion of pairs of neighboring cell types compared to random distribution for MC with non-significant interactions shown in gray. h Same as panel g, but for Merscope. i Same as panel g, but for Xenium
The “differentiated neuronal-like” annotation revealed subclusters for both Merscope and Xenium, while cell subtypes were identified for the stromal compartment by MC. Determining whether these subclusters represent distinct cell types or states requires further investigation. The spatial distribution of cell types, along with the corresponding coloring, is shown for exemplary images and regions in Fig. 6d–f.
Next, we assessed the ability of the three automated iST platforms to capture spatial relationships between cell types by conducting a neighborhood analysis (Fig. 6g–i). All three platforms enabled the identification of three distinct neighborhoods: the nodular compartment containing astrocytic-like and differentiated neuronal-like cells, the internodular compartment characterized by cerebellar granule neuronal precursor (CGNP)-like cells, and a stromal neighborhood enriched with stromal, vascular, and immune cells. These patterns appeared more distinct in Xenium and Merscope, likely due to the larger image area and cell number compared to MC. Finally, we evaluated the impact of using nuclear segmentation after reimaging with SDCM (Fig. 2g) on this analysis for two Xenium slides (MB266 and MB295, Additional file 12: Fig. S8).
While the major cell types (Fig. 6g–i) and their expression profiles were not drastically changed between the two different segmentations, some distinct differences were observed (Additional file 11: Fig. S7f, Additional file 12: Fig. S8b): (i) B cells and oligodendrocyte-like cells were undetected in the re-analysis. This is likely because they are relatively rare cell types (0.81% and 0.27%, respectively) and the reanalysis was conducted only on smaller parts of the tissue sections. (ii) Late CGNP-like and stromal/meningeal clusters display distinct subclustering in the re-analysis. As mentioned above, the relevance of these distinctions needs to be analyzed further. (iii) A population of migrating CGNP-like cells was identified by SDCM imaging and nuclear segmentation that could not be detected in the standard Xenium data. These migrating CGNP-like cells were concentrated in dense tissue areas, suggesting that improved imaging and segmentation lead to differences in transcript assignment that are particularly relevant for identifying cell types in the cell-dense regions of the tissue (Additional file 12: Fig. S8c–e).
Implementation of additional readouts after iST analysisWhile the ST analysis offers a wealth of information on molecular cell profiles in their spatial tissue context, corresponding studies typically require integration with other readouts. Merscope enables the inclusion of protein co-detection through up to five oligo-conjugated antibodies. Similar methods have been announced for the MC and Xenium platforms. A frequently used alternative is to prepare consecutive tissue sections for ST and other readouts. However, in many cases, the cell-by-cell assignment of these consecutive sections can be cumbersome and effective only in certain areas. Other approaches involve conducting additional readouts on the same tissue by either reimaging and subsequent image registration (MC and Xenium) or incorporating extra custom readouts directly into the ST run (Merscope). This is described here for three examples.
The first step involves virtual H&E staining of tissue following the MC run (Fig. 7a). Conventional H&E staining after the iST run is compatible with both MC and Xenium; however, it will hinder the subsequent acquisition of additional fluorescence signals, as the broad absorbance spectrum of hematoxylin interferes with nearly all fluorophores in the visible spectrum. This limitation can be bypassed by imaging DNA through DAPI staining (λex = 405 nm, λem = 445 ± 23 nm) and eosin (λex = 488 nm, λem = 521 ± 19 nm), followed by transforming these signals into a virtual H&E staining (Fig. 7a) [30]. Factors such as cell type-specific shades of pink produced by eosin in brightfield images or variations in cell autofluorescence cannot be fully addressed with the method used here. Nevertheless, it provides a valuable approximation whose applicability must be evaluated for each specific use case.
Fig. 7
Additional readouts after iST analysis. a Virtual H&E staining of MBEN tissue after MC run. b Immunostaining on the Comet system after the Xenium run. Transcript signal is given as a single dot while the protein image reflects the original fluorescent signal. c Amplified readout of nestin (NES) as an exemplary custom RNA via the auxiliary channel on the Merscope
In Fig. 7b, we demonstrate that the Xenium slide can also be utilized for subsequent multiplexed immunostaining (up to 40 targets) on the Comet platform from Lunaphore (Additional file 13: Table S5). For our test case, we validated the presence of CD19+ B cells, which were detected on the Xenium but not on the MC and Merscope systems. By employing immune (CD45) and B-cell (CD20) specific antibodies, along with Ki67 to stain cycling cells on the Comet system after a Xenium run, the immunostaining confirms the presence of CD19+/CD20+ B cells at both the transcript and protein levels.
The third example is the detection of a custom gene using the Merscope with signal amplification [31] (Fig. 7c). Overhangs on the primary probe are hybridized by the primary amplification probe, which then serves as a binding site for the secondary amplifier (Additional file 14: Table S6). The secondary amplifier can be detected using auxiliary probes in the Merscope chemistry. Nestin (NES), as an exemplary custom RNA target, was identified via an auxiliary probe on the Merscope and showed enrichment in the nodular structure (dashed outline). Signal amplification allowed for the detection of NES using only two primary probes instead of 30 in the original workflow. This workflow could potentially be used to detect short transcripts or gene fusions. Additionally, these auxiliary probes may also facilitate protein co-detection through oligo-conjugated antibodies, which we did not test in our experiments.
In summary, all three automated iST platforms allow for the integration of protein readouts, although MC and Xenium offer somewhat greater flexibility since the overall tissue structure remains intact during the experiment. However, it is important to note that the iST platforms use different tissue fixation chemistries, which may require antibody testing before conducting the experiments.
Selecting a platform for a specific applicationTo guide selecting a method for a specific application, we compared key features of automated iST platforms (Table 1). Based on our experience, each platform presents unique advantages tailored to various research goals. MC is particularly effective for analyzing a limited number of samples, offering a versatile format for validation experiments, with its standard reagent kit supporting 8 tissue sections per slide and a panel of 100 custom genes. Merscope stands out with larger tailored panels (up to 960 genes), while Xenium is designed for large-scale datasets, facilitating the analysis of many samples or large tissue areas.
From a practical implementation perspective, MC and Xenium showcase user-friendly protocols with straightforward washing and incubation steps. In contrast, Merscope requires more extensive hands-on time and optimization for essential steps, including tissue clearance, quenching, and gel formation, which carry the risk of sample loss if detachment occurs. While the microscope and liquid handling systems across all platforms generally performed reliably, we noted specific technical challenges: MC occasionally encountered issues with sample transport and liquid handling due to its modular robot arm setup. In this system, readout probes are removed after each imaging round, allowing the entire workflow to be restarted in case of a power outage or system malfunction. This option is not available for Merscope, as the fluorophores become irreversibly bleached during imaging and are not removed. Merscope required meticulous objective alignment and readjustment, and Xenium sometimes experienced dispensing or data processing issues. Overall, Merscope exhibited the fewest aborted runs during our trials, probably due to the microfluidic-based liquid management. However, we emphasize that these technologies are rapidly evolving, and our observations reflect only current implementations. Based on our comparative analysis, researchers should prioritize the following key factors when selecting a platform:
1.Reimaging capabilities: Reimaging can significantly improve cell segmentation accuracy, which is particularly critical for 3D applications. Xenium’s limited z-resolution in the DAPI channel (3 µm slice distance) makes 3D segmentation challenging, while Merscope's tissue-clearing process precludes subsequent imaging modalities like DNA-FISH.
2.Resolution and data accessibility: While all platforms provide sufficient resolution for ST applications, MC exhibited superior optical resolution (352 ± 50 nm) when compared to Merscope (480 ± 85 nm) and Xenium (474 ± 55 nm). Access to raw image data is essential for troubleshooting low transcript counts or high background signals. Notably, Xenium was the only system that entirely restricted access to the original transcript image data.
3.Workflow complexity and hands-on time: Both Xenium and MC require approximately 1.5 days for slide preparation, using straightforward protocols suitable for various tissue types. Merscope demands significantly more time (5–7 days), using complex procedures, including gel embedding, that require specialized technical expertise.
4.Probe panel customization: Although all platforms support custom gene panels, their implementation varies. MC offers simple 100-gene custom panels, Merscope provides the highest custom-designed panel capacity (up to 960 genes), and Xenium boasts extensive catalog panels with additional customization options.
5.Tissue size and placement considerations: To efficiently use resources, it is important to match tissue dimensions to platform capabilities (Additional file 2: Fig. S1). MC accommodates multiple small samples in separate areas (ideal for our MBEN case with multiple patient samples). At the same time, Merscope and Xenium offer larger continuous imaging areas better suited to extensive tissue sections. Tissue placement is most challenging with Merscope due to its confined area and unmarked round slide format.
6.Data analysis support: All systems provide transcript coordinates, DAPI images, and quality reports, but only Merscope and Xenium include built-in cell segmentation. Xenium also offers standard gene expression clustering, potentially reducing downstream analysis complexity.
In summary, MC offers an excellent balance of flexibility and straightforward implementation for validation experiments with smaller sample sizes. Researchers looking for larger
Comments (0)