
Remember me


A Swiss wheat collection shows variation in powdery mildew resistance to 10 Bgt isolates with different virulence profiles.
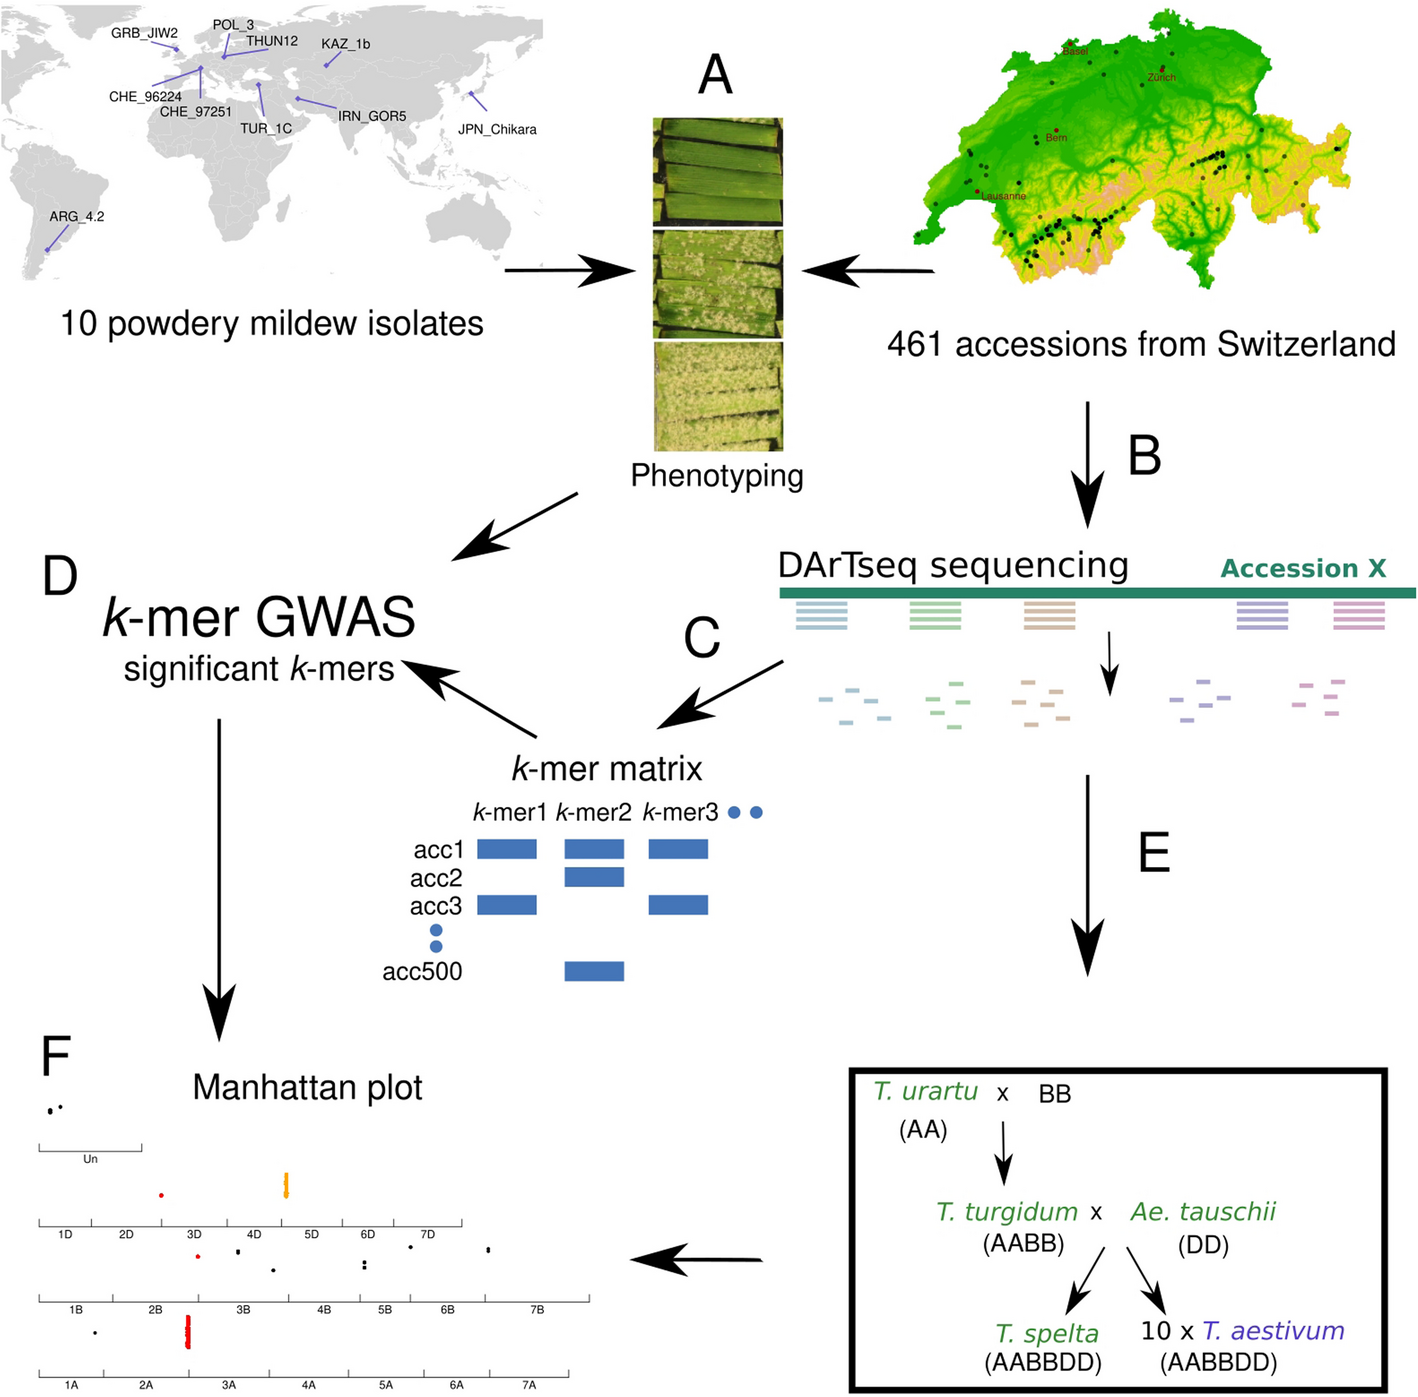
Powdery mildew isolates differ in avirulence gene content and, therefore, the observed reaction to wheat Pm resistance genes is isolate-dependent. High-throughput sequencing technologies allow a prediction of effector gene content. As most avirulence genes are still unknown at the molecular level, there are no straightforward tools to select Bgt isolates with functional effectors without prior functional validation or extensive phenotyping in tester lines. Therefore, we picked Bgt isolates prioritizing diversity, avirulence/virulence spectra, and availability from a global collection [23], ensuring representation from different regions where wheat is cultivated to support a wide search of potential host-resistance components (Fig. 2A).
Fig. 2
Phenotyping of the Swiss wheat collection with 10 powdery mildew isolates representative of the global genetic diversity of Blumeria graminis f. sp. tritici. A PCA of 400 Bgt isolates with 9 of the 10 isolates used in this study highlighted. B Avirulence (blue) and virulence (red) pattern of the 10 isolates across 37 Pm-tester lines [24]. C Phenotype distribution of the isolate CHE_96224 on the Swiss wheat collection. Pictures represent example phenotypes for fully resistant, partially resistant, and fully susceptible seedling reactions. D Correlation plot of the phenotype of all accessions for each isolate. Background color represents the Pearson correlation value. E Heatmap representing the phenotype of each accession of the Swiss collection for the ten Bgt isolates sorted the same way as B. The three main clusters were split
We selected nine Blumeria graminis f. sp. tritici isolates from six of the nine populations representing geographical origins detected by [23]. These include two Swiss isolates (CHE_96224 and CHE_97251) from the European cluster, and one from England (GRB_JIW2), Poland (POL_3), Turkey (TUR_1c), Iran (IRN_GOR5), Kazakhstan (KAZ_1b), Argentina (ARG_4_2), and Japan (JPN_CHIKA) each (Fig. 2A). An additional isolate from Poland (THUN12) is a hybrid between wheat and rye mildew, which was not part of the PCA analysis presented in Fig. 2A [23]. The geographic origin of those 10 isolates is shown in Fig. 1A.
To assess the potential of the selected Bgt isolates to search for resistance genes, we first determined their avirulence/virulence pattern on 37 Pm-tester lines (Fig. 2B). Such tester genotypes have been generated through different crosses, usually involving a wild relative of wheat with a susceptible hexaploid wheat genotype, to ensure the sole presence of a specific Pm gene for pathogenicity tests. Across all Pm-tester lines, each of the ten isolates revealed a different resistance pattern. Interestingly, only the Pm13 tester line was resistant to all isolates. In contrast, Pm9, Pm5b, Pm20, and Pm3g were susceptible to all ten isolates. Overall, we observed a large variation between the Pm-tester lines across the isolates, demonstrating the potential of the chosen Bgt isolates for detecting a wide variety of powdery mildew resistance genes (Fig. 2B).
Using the ten chosen Bgt isolates, we then phenotyped a collection of Swiss accessions, consisting of 139 and 276 spring and winter accessions, respectively, together with 46 accessions of undefined growth habit (growing in both conditions), totaling 461 accessions. Those accessions include old cultivars and landraces and represent a selection of the diversity held in the Swiss genebank. Mildew resistance phenotyping revealed a large variation in powdery mildew resistance among the collection (Additional file 2: Table S1). Across the 10 isolates, an average of 80 accessions were resistant to individual Bgt isolates, while, on average, 354 were susceptible to single Bgt isolates (Additional file 2: Table S1). The most virulent Bgt isolate, POL_3, had only 32 resistant accessions, while the most avirulent Bgt isolate, ARG_4_2, had over 25% (n = 146) of the accessions showing resistance. Additionally, 206 accessions were susceptible to all Bgt isolates, while only 28 were resistant to all (full data in Additional file 2: Table S1). The latter are of great interest to discover potential broad-spectrum resistance genes.
We developed a Shiny app (https://benjiapp.shinyapps.io/Map_agent_pheno/) to explore the resistance distribution for each Bgt isolate. As an example, the resistance distribution is shown for isolate CHE_96224, a very avirulent Bgt isolate widely used [25, 26] (Fig. 2C). One hundred thirty-eight accessions showed resistance (≤20% leaf covered) to CHE_96224, whereas 94 accessions were fully susceptible (=100), with 229 accessions showing an intermediate phenotype.
To further explore the commonality between the isolates, we looked at the correlation of their virulence/avirulence patterns across the Swiss collection (Fig. 2D). The highest correlations were observed between JPN_CHIKA and ARG_4_2 (r = 0.76) and between CHE_96224 and IRN_GOR5 (r = 0.81), with POL_3 being the most distinct Bgt isolate with an average correlation value of 0.42 to all other isolates. There was no particular correlation between the geographical origin of the isolate and the virulence/avirulence pattern. For example, the virulence/avirulence patterns of the two isolates from Switzerland, as well as the two from Poland, are poorly correlated with each other compared to the other isolates. Further, we compared the genetic distance (IBS) between isolates and their correlation based on the virulence/avirulence patterns (Additional file 1: Fig. S1), without detecting any significant correlation.
When grouping based on the phenotypic responses to Bgt isolates, wheat accessions were grouped into three main clusters. The first and biggest cluster (315 accessions) consists of mostly susceptible accessions to all Bgt (Fig. 2E). The second cluster (105 accessions) has mostly accessions resistant to all isolates or accessions susceptible to CHE_96224, IRN_GOR5, POL_3, and TUR_1C Bgt isolates. When comparing with the Pm-tester lines, such a pattern of accessions being only susceptible to CHE_96224, IRN_GOR5, POL_3, and TUR_1C perfectly matches with the virulence/avirulence patterns of the lines containing Pm1e, a, and d, which suggests that these accessions might contain the Pm1 locus. The third cluster was formed by 64 accessions that are all resistant to CHE_96224, IRN_GOR5, ARG_4_2, and JPN_CHIKA, while a subset of them are also resistant to THUN12 and TUR_1C. Comparison with the Pm-tester lines resistance spectra shows that such a pattern corresponds to Pm4b and Pm2 or Pm32-containing lines and indicates that the Pm2, Pm4b, or Pm32 genes are likely to be present in the Swiss collection.
The Pm2 and Pm4b race-specific resistance genes are widely present in the Swiss collection.
Pm4 and Pm2 are key genes used in breeding programs involved in powdery mildew resistance [27, 28] and have been detected in several wheat populations globally [29, 30]. To investigate whether local wheat hexaploid landraces and old cultivars from the Swiss collection contain these genes as suggested by the phenotyping analysis described above, we tested for the presence of Pm4b and Pm2 using haplotype markers and further sequencing [27, 31]. Out of 461 accessions, 50 and 31 contained Pm2 and Pm4b, respectively, with eight accessions having both genes. Whereas most of the accessions containing Pm4b showed the expected resistance to CHE_96224, IRN_GOR5, JPN_CHIKA, THUN12, and TUR_1C [27], few accessions did not match this pattern (Additional file 1: Fig. S2). In the case of expanded resistance, such accessions might contain additional resistance genes, while the lack of resistance is most likely due to the presence of the non-functional Pm4f allele [27, 32].
On the other hand, most accessions containing the Pm2 gene had a resistance spectrum matching the expected pattern of the Pm2 near isogenic lines (NIL), being resistant against CHE_96224, IRN_GOR5, ARG_4_2, and JPN_CHIKA. The avirulence/virulence pattern of mildew isolates on a Pm2 NIL perfectly matched the presence/absence of AvrPm2 in the isolates as determined from whole genome sequences (Additional file 1: Fig. S3). There were a few wheat genotypes without the Pm2 gene but resistant to AvrPm2-containing isolates, which is possibly the result of the presence of other resistance genes. Given the two examples of Pm2 and Pm4, it is very likely that additional sources of resistance are present in the Swiss wheat collection. To discover new genes involved in powdery mildew resistance, we set out to perform GWAS analyses.
Interrogating genetic diversity in the Swiss wheat collection using DArTseq genotypingAll accessions from the Swiss wheat collection were genotyped using DArTseq. This genotyping by sequencing (GBS) method aims to reduce the proportion of repetitive sequences, keeping genome coverage more homogenous [13]. To assess this, we analyzed the distribution of the sequencing reads across the Chinese Spring IWGSC_2.1 reference genome (CS, [33]). We observe that at the population level 40% of the genes contain at least one read in their coding regions and when including ±10 kb there are 72% of the genes with at least one read in the region (Additional file 1: Fig. S4). While this does not directly reflect the robustness of locus discovery, it illustrates the genomic breadth captured across genic and intergenic regions. Additionally, the distribution of reads was similar between homologous chromosomes with 1,491,774, 1,605,237, and 1,350,862 reads mapping to the subgenomes A, B, and D, respectively (Additional file 1: Fig. S5). As in all GBS methods, DArTseq covers a small part of the genome and produced on average 1.4M reads per sample (Supplemental Table 1, sheet 3). Additionally, we observe that on average, 2.3% of the reads per accession did not map to the CS genome. AG-392 had the fewest mapped reads, with 8.8% not mapping to the CS genome.
The collection was also genotyped with the 12k Illumina Infinium 15 K wheat SNP array (TraitGenetics GmbH, Gatersleben, Germany). After filtering, 11,252 SNPs were kept (see “Methods”). In addition to the SNP array, a matrix of 10,068 SNPs was generated by mapping the DArTseq reads to the CS genome. When comparing the number of SNPs per chromosome for each matrix, the D subgenome showed the expected lower number of SNPs (Additional file 1: Fig. S6). This reduced diversity is due to a strong bottleneck in the formation of hexaploid wheat [34]. Importantly, while the SNP matrix derived from DArTseq data, containing 10,068 SNPs, tagged 2789 genes, using k-mers, ~ 85,000 genes (72%) with ± 10 kb window are tagged (Additional file 1: Fig. S4). In addition to the two SNP matrices, we generated a presence/absence matrix of 176 million unique k-mers of length 31 bp. We then used these two SNP-based matrices (DArTseq, the SNP-chip) and the k-mer matrix—to perform GWAS. Using the SNPs, we also performed a population structure analysis of the Swiss collection using ADMIXTURE. Through the different criteria presented in Additional file 1: Fig. S7, we do not detect multiple populations in our dataset.
K-mer-based association mapping outperforms GWAS based on SNP matrices.
To perform a comparative analysis of the performance of GWAS when using the different genotyping methods, we set up a pipeline allowing the use of the three matrices and the mildew resistance as phenotype. The GWAS results using the two SNP matrices showed very similar results (Additional file 1: Figs. S8 and S9). With both SNP matrices, for the Bgt isolate POL_3, no significant regions were detected. Significance when using the SNP matrix was set based on the Bonferroni threshold, with any SNP above this threshold considered significantly associated with the phenotype. We also evaluated the fit of the GWAS model to our data and generated QQ plots (Additional file 1: Fig. S10) for all the isolates using the SNPs chip dataset. In all cases, the distribution of p values fits well the theoretical distribution of the linear mixed model. Combining the GWAS results from all the other isolates, we detected 241 and 53 significantly associated SNPs from the DArTseq and the SNP-chip, respectively. They were embedded in seven genomic regions, with two regions standing out above the rest: one located at the beginning of chromosome 5D for resistance to CHE_96224 and IRN_GOR5, and one at the end of chromosome 7 A for resistance to ARG_4_2, CHE_97251, GRB_JIW2, JPN_CHIKA, KAZ_1b, and THUN12 (Fig. 3A). Those two regions are known to contain Pm genes: Pm2, located at the beginning of chromosome 5D around 43.4 Mb [35], and Pm1 and Pm60 are located at the end of chromosome 7 A [36, 37]. We observed that the corresponding regions on homoeologous chromosomes also showed significantly associated SNPs. This is most likely due to the homology of sequences between the chromosomes and/or linkage disequilibrium. Based on the phenotyping clustering as well as the comparison with Pm-tester lines, Pm1/Pm60 and Pm2 were expected to be present in the Swiss wheat collection. Surprisingly, we did not detect Pm4 using the SNP matrices.
Fig. 3
k-mer GWAS results. A Summary of the GWAS results based on CS for Pm1, Pm2, and Pm4 for all three matrices for all the isolates, as well as two regions only found using k-mers. The colors blue, brown, and purple respectively represent the SNP-Chip, the SNPs generated from the DArTseq data, and the k-mers. Filled squares represent the presence of an associated region. B UpSet plot for all k-mers significantly associated with resistance using the resistance phenotype of each of the 10 isolates. The biggest set of common significantly associated k-mers (5594) was found between the isolates ARG_4_2 and JPN_CHIKA, GRB_JIW2, CHE_97251, THUN12, and KAZ_1b. The first 14 groups are colored. The entire data set can be explored in the Shiny app at https://benjiapp.shinyapps.io/Manhattan_plot/. C Circular plot representing Manhattan plots comparing three matrices used for the GWAS of Bgt isolate CHE_96224. The inner circle in blue represents the SNP matrix generated using DArTseq, and the middle circle in orange represents the matrix from the SNP-chip. The outer circle represents the k-mer-GWAS where only k-mers significantly associated with resistance are displayed. The y-axis is the same for all three plots. D 3D dot plot of the different Manhattan plots for the region of Pm4 (red arrow on C). The color legends are as in A. The k-mer-GWAS SY Mattis represents the k-mer-GWAS using the SY Mattis genomes as a reference. The line is at the position of the Pm4 gene in the SY Mattis genome. E Proportion of k-mers mapping to all the Triticum aestivum genomes (red), some of the genomes (blue), and none of the genomes (gray). F Proportion of reads that do not map to any of the T. aestivum genomes, but map to genomes of wheat progenitors or relatives. The other 40% do not map to any (light blue) and only 0.02% map to all four genomes
To test whether the output of the GWAS analysis could be improved by using a reference-free approach, we adapted a previously published k-mer GWAS approach [21]. The GWAS using k-mers as genotype yielded 16,895 k-mers significantly associated with resistance, with an average of 5876 k-mers per isolate. k-mers significantly associated with resistance were defined as those exceeding the − log10 threshold for the 5% family-wise error rate [21]. Isolate KAZ_1b had the highest number of significant k-mers (12,806) associated with resistance, and TUR_1C, the lowest number (1819) (Fig. 3B). Similar to the SNPs, no k-mers significantly associated with resistance were detected for the POL_3 isolate (summary in Additional file 2: Table S3). Using the SNP matrices, the classical outputs are lists of significant SNPs; for k-mers, the output is a list of significant k-mers, of 31 bp in length. To position these k-mers within a genome, several steps are needed: after retrieving the reads containing the k-mers, these reads are aligned to the genome and then the k-mer p value can be linked to a genome position (see Fig. 1 for the pipeline).
k-mer GWAS identified the same resistance-associated regions as the two SNP matrices, plus additional novel associations. For example, we detected an associated region on chromosome 2A that corresponds to the location of the Pm4 gene (Fig. 3C, D). Based on the resistance pattern analysis of the phenotypic data and the haplotype analysis (Additional file 1: Fig. S2), this gene is present in the Swiss wheat collection. To better understand why such a region is only detected using k-mers, we zoomed into the Pm4 region and plotted the results of the three approaches together (Fig. 3D). This revealed that the higher resolution of the k-mer GWAS was due to the higher number of markers in the region: there are 165, 141, and 1627 markers for the DArTseq, the SNP-chip, and the k-mer-GWAS, respectively.
Using k-mer GWAS approach, we detected additional associated regions 2 A and 5D (Fig. 3A). In total, using Chinese Spring as reference, we identified 21 associated regions that do not overlap with known Pm genes (coordinates summarized in Additional file 2: Tables S8 and S9). Manhattan plots containing all the significantly associated regions for all the isolates are presented in Additional file 1: Fig. S12. These results demonstrate that k-mer-based GWAS outperforms approaches based on SNPs, and the comparative analysis highlights that the increased number of markers is mostly the reason for this improvement.
Multiple reference genomes improve the positions of k-mers significantly associated with resistance and refine genomic region definitions.
Of the 16,895 k-mers significantly associated with resistance, 68% (11,570) were mapped to the CS reference genome. In contrast, while only 2.3% of the overall reads did not map to the CS genome, a much larger proportion, i.e., 32% of the k-mers significantly associated with resistance, did not map to the CS genome. This suggests a significant enrichment of non-mapping k-mers among those identified as significantly associated with resistance, compared to the general read mapping. Such a difference is most likely caused by introgressions and/or presence/absence polymorphisms that are frequently the origin of resistance to powdery mildew [38]. If such an introgressed region is not present in CS, reads containing significantly associated k-mers would not map. To investigate the possible origin of the non-mapped k-mers, we used 10 additional Triticum aestivum genomes [22] as reference genomes. Using this set of genomes, we found that 53% (8969) of the k-mers significantly associated with resistance were mapped in all genomes (Fig. 3E). We considered a k-mer mapped when at least one of the reads containing such k-mers mapped to one or more genomes. A further 30% (5003) were mapped in some but not all of the genomes, and the remaining 17% (2923) did not map to any of the 10 Triticum aestivum genomes (Fig. 3E). Thus, by adding the 10 genomes as references, we could map 83% of the k-mers, compared to 68% when using only CS as a reference. Some of the k-mers that do not map to CS map to new regions of interest in other reference genomes. Besides, some k-mers also map to regions that have already been detected using CS, but reduce the width and increase the precision of the peak. Taking Pm4 as an example, we found that when using SY Mattis as a reference genome, the associated region perfectly overlaps with the position of the annotated Pm4 gene, which is not the case for CS (Fig. 3D). The Pm4 gene is known to originate from an introgression from tetraploid wheat [27], and blast analysis shows that the gene is present in SY Mattis and absent in CS. This explains the higher precision when using SY Mattis as a reference genome. Using the k-mer approach, we pinpointed narrower peaks, allowing us to define more precisely genomic regions harboring genetic loci of interest (Fig. 3D).
Progenitor genomes allow mapping an additional 8% of the significant k-mers.
Many introgressions derived from wild relatives in bread wheat have been described to contain resistance genes [39, 40]. Therefore, to investigate the possible origin of the 17% non-mapped reads, we selected a set of genomes representing close relatives of bread wheat as well as ancestors/progenitors of hexaploid wheat, including Aegilops tauschii, Triticum turgidum, Triticum urartu, and Triticum spelta (Fig. 1). By implementing this step, we mapped an additional 60% (1742) of the 2923 non-mapped k-mers (Fig. 3E, F). Combining all reference genomes, we could unambiguously assign a physical position to approximately 93% of the k-mers, which is 25% more of the resistance-associated k-mers compared to using only CS as a reference genome. In summary, our analysis demonstrates the advantage of using multiple reference genomes: starting from the same set of raw genotypic data, an additional 25% of all significant k-mers were mapped, resulting in novel associations and improved resolution of associated genomic regions.
k-mer GWAS allows to detect multiple known Pm genes present in the Swiss wheat collection.
To identify resistance genes acting against multiple Bgt isolates, we analyzed resistance-associated k-mers shared among multiple isolates (Fig. 3B). Due to the complexity of displaying association data from multiple isolates across different genomes, we developed a Shiny app, accessible at https://benjiapp.shinyapps.io/Manhattan_plot/. To generate a Manhattan plot, users must follow the following steps: (i) select a reference genome, (ii) choose an isolate, and (iii) specify the chromosome (s) to display. While only one genome can be visualized at a time, multiple isolates can be compared simultaneously by stacking multiple plots. For a more detailed view of an associated region, users can zoom in by specifying the coordinates of a region of interest. An annotated screenshot is shown in Additional file 1: Fig. S13.
The largest group of common resistance-associated k-mers (n = 5594) is shared among the isolates ARG_4_2, JPN_CHIKA, GRB_JIW2, CHE_97251, THUN12, and KAZ_1b. These k-mers predominantly cluster at the end of chromosome 7 A, a region known to harbor the Pm1 and Pm60 resistance genes, and is characterized by suppressed recombination [37]. This clustering aligns perfectly with the phenotype of the Pm1d/a/e tester lines, which exhibits resistance to the abovementioned isolates and susceptibility to the rest (Fig. 2B). Furthermore, k-mers from this group also tag other loci of interest, such as on chromosomes 2B and 6B. Extending this to all the reference genomes we found, for instance, that an associated region at the beginning of chromosome 3D was only detected when using Renan, Lancer, and CS as reference genomes. Out of the 34 main regions detected across the 10 reference genomes and the 10 isolates, only 15 are shared in all reference genomes. Such comparative analysis across multiple genomes highlights the limitations of using a single genome reference, as many significant regions would be missed.
The first four groups (groups 1–4) in Fig. 3B represent the largest groups of common k-mers and are formed by a similar set of isolates with minimal variation. Group 5 comprises k-mers private to KAZ_1b, while groups 6 and 8 contrast with the first four groups as they contain k-mers found significant for isolates TUR_1C, CHE_96224, and IRN_GOR5. THUN12 isolate is the only member common among all these groups. Group 7 includes significant k-mers solely from IRN_GOR5 (Fig. 3B). This pattern correlates well with the correlation matrix between the phenotypes shown in Fig. 2C.
Interestingly, we observed two distinct, non-overlapping groups of isolates sharing common k-mers. One group includes Bgt isolates GRB_JIW2, CHE_97251, and KAZ_1b, while the other group comprises Bgt isolates TURC_1C, CHE_96224, and IRN_GOR5. Comparing these data with the pattern of Pm-tester lines, we found that a combination of multiple Pm genes could explain this distribution. In particular, Pm2a and Pm4a confer resistance to TURC_1C, CHE_96224, and IRN_GOR5, while showing susceptibility to the other isolates, except for JPN_CHIKA. Conversely, various Pm1 alleles exhibited resistance to GRB_JIW2, CHE_97251, and KAZ_1b. Examining the mapping of the significantly associated k-mers from different groups revealed a clear correlation with the expected Pm genes. Groups 1–4 predominantly map to the end of chromosome 7, around the Pm1 and Pm60 region. For example, for the isolate CHE_97251, out of the 1457 significantly associated k-mers mapping to the CS genome, 888 (61%) are located at the end of Chr7A-B-D that contain the resistance genes Pm1 and Pm60. k-mers from groups 6 and 8 almost exclusively tag the Pm2 and Pm4 regions. For the isolate CHE_96224, out of the 285 significantly associated k-mers mapping to the SY Mattis genome, 250 (87%) map to chromosome 2 A in the Pm4 region. While we detected associated regions for Pm2 and Pm1/Pm60 in all the ten reference genomes, the Pm4 region is not detected in the Lancer genome.
Such grouping together with the mapping to multiple genomes shows that we can detect clear and strong signals from specific Pm genes. Zooming into the region of Pm4 and Pm2 using SY Mattis as reference genome shows that those signals are directly on top of the position of the genes (Fig. 4A and B).
Fig. 4
Identification of known Pm genes and new candidate genes for powdery mildew resistance. Manhattan plot for the Bgt isolate CHE_96224 and the chromosomes 2 A (A) and 5D (B) of the SY Mattis genome. The zoom-in of each of the regions of interest also shows the position of two of the Pm genes known to confer powdery mildew resistance as well as the LD pattern of the region. C Table summarizing the presence of the three copies of the Werner-like candidate genes across 11 assembled wheat genomes (gray part). Phenotypes of the same 11 genotypes for the 9 [10] isolates used in this study. Blue represents resistance, red susceptibility, and white is missing data. D Alignment of the genomic regions (15 Mb) on chromosome 2B containing the Werner-like exonuclease gene candidate for genomes containing the candidate gene (CS, Landmark, Norin 61, and Stanley), as well as other genomes not containing it (Renan, Mace, SY Mattis, and Lancer). E Presence/absence pattern of the associated region at the beginning of Chr3D for 11 genomes and for each of the isolates used in this study. F Alignment of the genomic region around the candidate gene at the beginning of chromosome 3D (4 to 6 Mb). The position of the GWAS peak, as well as the best gene candidates, is marked with a triangle. A longer alignment of the 12 first Mb of chromosome 3D is in Supplemental Fig. 16
New candidate Pm genes identified in the Swiss wheat collection.
To discover new potential candidate genes for mildew resistance, we focused on all regions detected having significant k-mer associations not overlapping with previously known Pm genes (Additional file 1: Fig. S12). Such comparison with known Pm genes combined with LD decay analysis allowed us to define new potential loci involved in powdery mildew resistance based on the CS genome. Defining borders of associated regions from a GWAS output can be difficult and is strongly influenced by linkage disequilibrium (LD) around the corresponding genomic region. For instance, a comparison between the Pm2 and Pm4 regions (Fig. 4A, B) shows that the LD landscape can vary significantly between different regions of the genome. Even though previous studies have calculated LD decay over entire subgenomes [41], we observe that large regions of high LD are present (Additional file 1: Fig. S11), making the half LD decay measure for our approach not suitable.
Several of the potentially novel loci we report are located on chromosomes where no Pm genes have been previously described. For all the rest, located on the same chromosome as a previously described Pm gene, we only considered those loci as novel that mapped much beyond the half-maximal LD thresholds described in Supplemental Fig. 11. As each region is a specific case and to allow users to explore the variation of LD for a region of interest, we developed a Shiny app (https://benjiapp.shinyapps.io/LD_plot/) (Additional file 1: Fig. S14) that displays the LD plot of a region of interest along with the k-mers of the region that are significantly associated with resistance. For the cases presented here, no big insertions/deletions were observed, and thus, for those regions, we extracted all protein sequences within 1 Mb around each detected peak. Nonetheless, we recommend following a case-by-case approach to define the extent of the region around a peak.
We then used BLASTp for all those genes to infer gene function. After several filtering steps (see “Methods” for details), Manhattan plots for each of the genomes combining the different isolates, as well as a summary table of the main associated regions, are presented in Additional file 1: Fig. S15. The table shows the presence of the main regions in the different genomes used as reference. As the genomic coordinates for each genome cannot be directly compared, the correspondence of the region of association between the genomes is arbitrary and some similar regions might not be the same in another genome. For in-depth analysis of candidates of choice, alignment between the genomes of the region of interest will be required.
As an example, we present a resistance-associated region located at the beginning of the short arm of chromosome 3D and was only detected when using Lancer, Renan, and CS as reference genomes (Fig. 4C). Its presence in these three genomes is not consistent with phenotypic observations: while Renan and Lancer are resistant to many of the tested powdery mildew isolates, CS is not resistant to any. To further explore this region, the 2 Mb around the most associated k-mer was extracted and aligned with all the genomes. This region is conserved between CS, Lancer, and Renan but not for the other genomes (Fig. 4D). Given that CS is not resistant, it is expected that haplotype diversity occurs in the region between Lancer/Renan and CS. Indeed, we observed such diversity within the first 500 kb of the region, which shows considerable variation between CS and Lancer, but is almost fully conserved between Lancer, Renan, and Norin 61 (Fig. 4D). While Lancer is resistant to 8 of 10 isolates, Renan is only resistant to CHE_96224, IRN_GOR5, THUN12, JPN_CHIKA, and TUR_1C, and Norin 61 is susceptible to all isolates. After extracting all the genes annotated in the region from the Lancer genome, we blasted them to all other genomes to find how conserved each of the genes were. The heatmap in Additional file 1: Fig. S17 summarizes the results of this analysis.
Each of the protein sequences has been also blasted to the NCBI database to extract possible functions. Thirteen genes are found to be NBS-LRR genes, although all of them are fully conserved between Lancer and Norin 61, including ±2 kb of the coding region. Because Norin 61 is fully susceptible such genes are likely not responsible for the resistance observed in Lancer. We found 10 genes present only in Lancer (Additional file 1: Fig. S17), out of those five are uncharacterized proteins, two are wax ester synthase like proteins, one is a fatty acyl-CoA reductase, one is a glucomannan 4-beta-mannosyltransferase, and one is a receptor like prot12. Waxes are part of the cuticle and protect different organs from biotic and well as abiotic stresses [42]. Even though such genes have not been described in resistance to powdery mildew, their presence/absence pattern between the genomes makes this gene family a solid candidate. Thus, using k-mer GWAS we detected new candidate genes and further analysis of the identified regions and the candidate genes will reveal a possible role of those genes in resistance.
k-mers allow to trace candidate genes across multiple genomes and examine their structural variation.
One intriguing region was identified when we mapped significantly associated k-mers with Bgt isolate CHE_96224 onto different wheat reference genomes using as basis the mapping to the SY Mattis genome to assign k-mers specific to Pm2 and Pm4 genes (Additional file 1: Fig. S18). Since SY Mattis carries Pm2 and Pm4, we can tag the k-mers mapping at the region of Pm4 and Pm2 and predict their presence in other genomes. We would expect them to map onto other wheat reference genomes that also contain the Pm2 and Pm4 genes, as indicated by GWAS peaks in Landmark (Pm2) and Stanley (Pm4) (Additional file 1: Fig. S15). However, k-mers that are not associated with Pm4 or Pm2 (in black) form prominent peaks on chromosomes 3 A and 3D in Julius, Fielder, and Lancer and can reveal new potential candidate genes.
These k-mers were directly located within a Werner-like exonuclease gene (TraesJUL3A03G01434660). However, both Julius and Fielder are susceptible to CHE_96224. To explain this apparent contradiction, we investigated whether the Werner-like exonuclease gene exhibits copy number variation across wheat reference genomes. This gene is conserved in homeologous groups 3 and 7 in all wheat genotypes. However, its presence/absence pattern on chromosome 2B suggests a potential role in increased susceptibility to wheat powdery mildew (Fig. 4E). Specifically, the gene is present in the genomes of CS, Landmark, Norin 61, and Stanley—all susceptible cultivars—but absent in all resistant cultivars, Renan, Mace, and SY Mattis (Fig. 4F).
Interestingly, a Werner-like exonuclease coding gene has been identified in a DAP-seq (DNA affinity purification sequencing) experiment searching for TaZF binding sites. TaZF proteins have been implicated in powdery mildew resistance by recruiting both Pm2a and AvrPm2 from the cytosol to the nucleus [25]. While future functional validation is required to confirm whether the Werner-like gene contributes to susceptibility, this case highlights how association mapping based on k-mers enables the examination of structural variation of candidate genes across different genomes.
Using progenitor genomes allows the discovery of new associated regions with powdery mildew resistanceTo find the location of the k-mers absent in all tested Triticum aestivum genomes, we mapped the reads to four progenitor genomes of wheat. The resulting Manhattan plots are represented in Additional file 1: Fig. S19. To compare with the location of the known Pm genes, we also blasted all the cloned Pm genes to the four genomes and their location is indicated in the Manhattan plot (Additional file 1: Fig. S19). In Aegilops tauschii, Triticum urartu, and Triticum spelta, we detected a region overlapping with the position of Pm2 or its homolog on chromosome 5A. Pm2 was originally described as a gene introgressed from A. tauschii into chromosome 2D [43]. For all four genomes, we detected a region at the end of chromosome 7 that tags the region of Pm1 and Pm60, originally from Triticum aestivum, as well as Triticum monocucum and Triticum urartu, respectively. For all the other regions, we used the approach based on the blast described above to annotate the gene within the 1 Mb around each peak. After filtering the blast results, we ended up with 4, 6, 2, and 15, significantly associated regions containing candidate genes in Aegilops tauschii, Triticum spelta, Triticum turgidum, and Triticum urartu, respectively. Except for the significantly associated regions on chromosomes 7, 5, and 2, overlapping with Pm1/Pm60 and Pm2 and Pm4, respectively, all the other associated regions do not overlap with previously detected regions using the 10 Triticum aestivum genotypes as reference genomes. For example, new associated regions were detected at the end of chromosome 5D and 5 A in Aegilops tauschii and Triticum urartu, respectively, or at the start of chromosome 3D, 3 A, and 3A/3B for Aegilops tauschii, Triticum urartu, and Triticum turgidum, respectively (Additional file 1: Fig. S19). Therefore, the use of wild relative genomes as reference revealed additional potential resistance genes undetected in hexaploid wheats, suggesting that resistance genes were left behind or introgressed during breeding of hexaploid wheat.
k-mer GWAS allow the discovery of potentially new candidate genes for adult-stage resistance to wheat powdery mildew.
We evaluat
Comments (0)