
Remember me


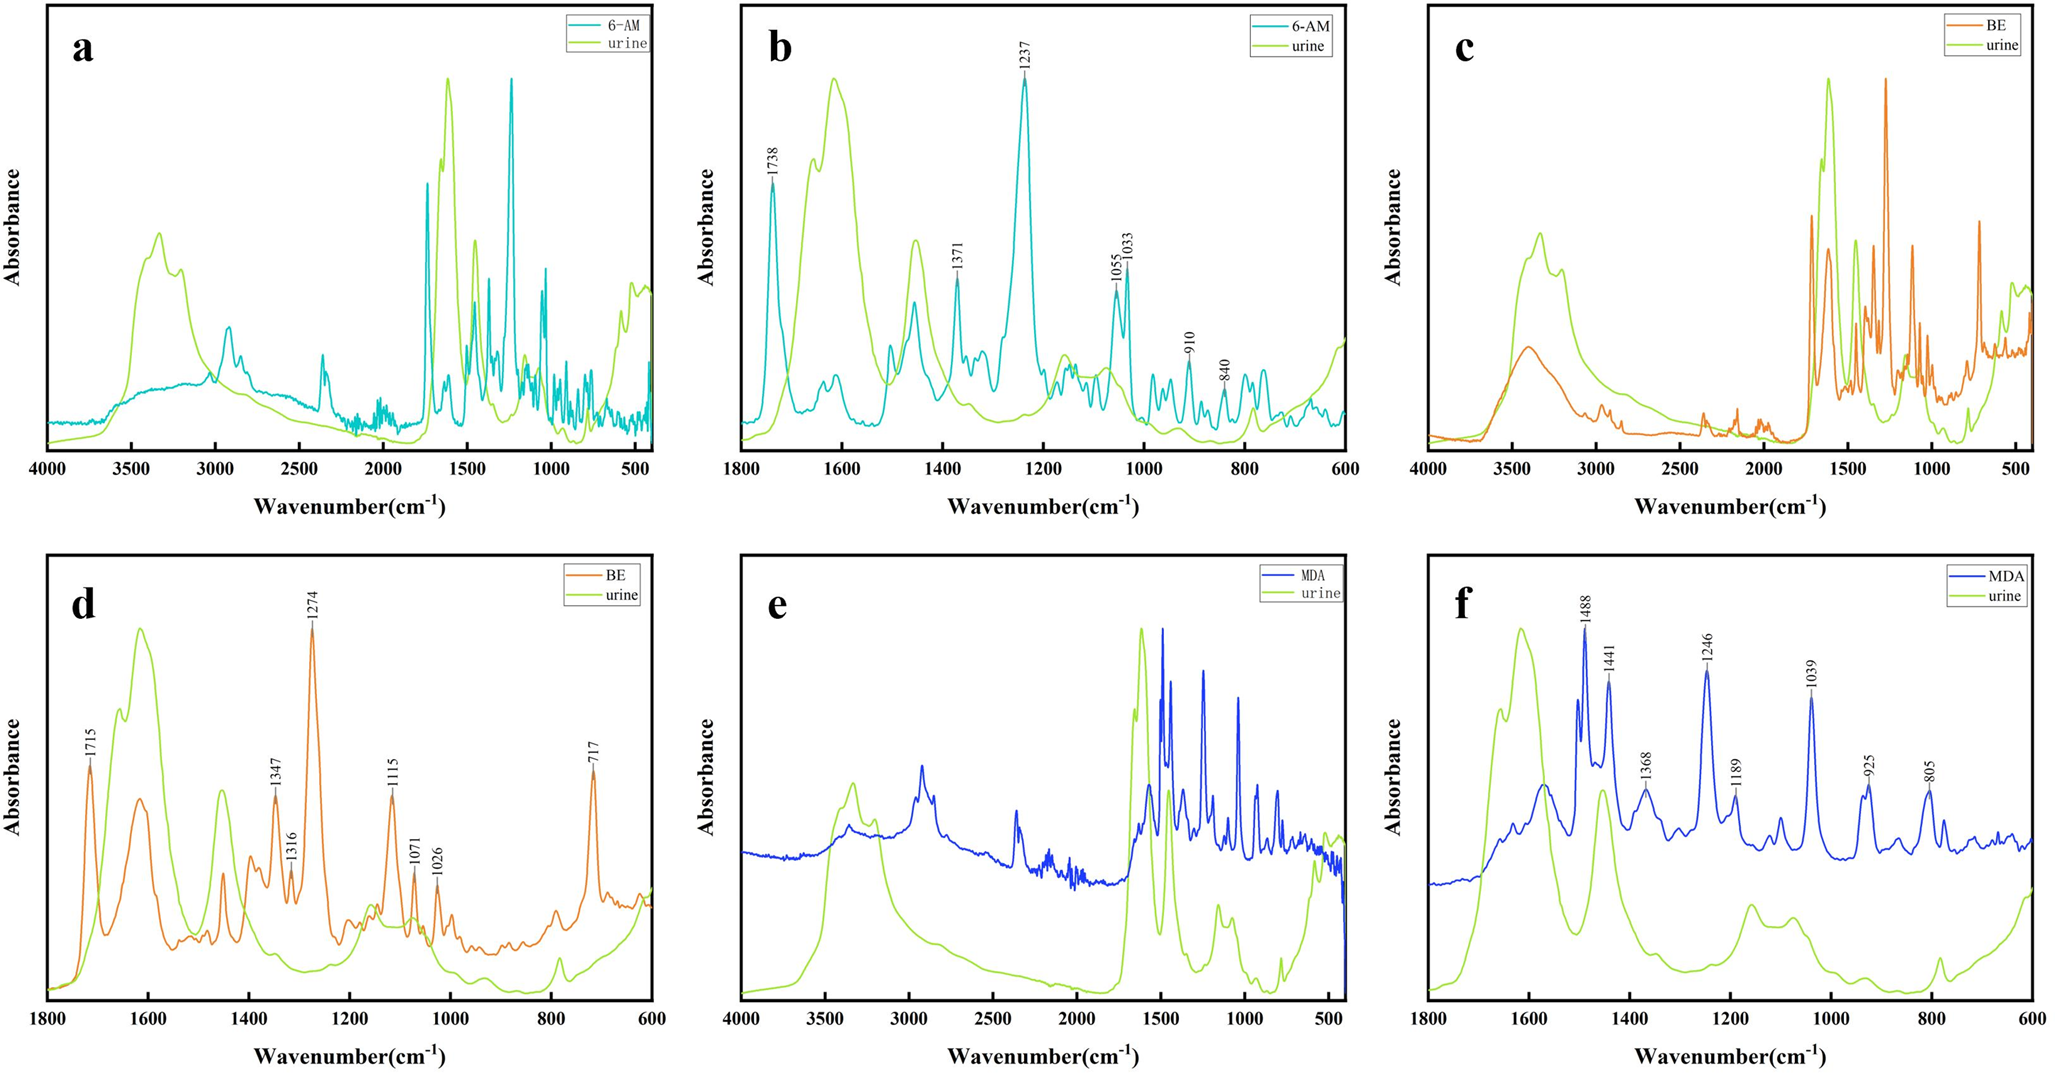
Figure 1 shows the infrared spectra of blank urine and standard samples of 6-AM, BE, and MDA, including both the full spectral region (Fig. 1a, c and e) and the fingerprint region (Fig. 1b, d and f). The main absorption peaks of standard samples of 6-AM, BE, and MDA in the fingerprint regions are marked in Fig. 1. In Fig. 1b, the main absorption peaks were at 1738 cm− 1, 1371 cm− 1, 1237 cm− 1, 1055 cm− 1, 1033 cm− 1, 910 cm− 1, and 840 cm− 1. Among them, the peak at 1738 cm− 1 was due to C = O stretching vibration, the peak at 1371 cm− 1 was the -CH3 bending vibration, the peak at 1237 cm− 1, 1055 cm− 1 and 1033 cm− 1 were the C-O stretching vibration, the peak at 910 cm− 1 and 840 cm− 1 were due to C-H out-of-plane bending vibration [25, 26]. In Fig. 1d, the main absorption peaks were at 1715 cm− 1, 1347 cm− 1, 1316 cm− 1, 1274 cm− 1, 1115 cm− 1, 1071 cm− 1, 1026 cm− 1, and 717 cm− 1. Among them, the peak at 1715 cm− 1 was due to C = O stretching vibration, the peak at 1347 cm− 1 and 1316 cm− 1 were the -CH3 bending vibration, the peak at 1274 cm− 1 was due to C-N stretching vibration, the peak at 1115 cm− 1, 1071 cm− 1 and 1026 cm− 1 were due to C-O stretching vibration, and the peak at 717 cm− 1 was the C-H out-of-plane bending vibration [27,28,29]. In Fig. 1f, the main absorption peaks were observed around 1488 cm− 1, 1441 cm− 1, 1368 cm− 1, 1246 cm− 1, 1189 cm− 1, 1039 cm− 1, 925 cm− 1, and 805 cm− 1. Among them, the peak at 1488 cm− 1 and 1441 cm− 1 were due to C = C stretching vibration, the peak at 1368 was -CH3 bending vibration, the peak at 1246 cm− 1, 1189 cm− 1 and 1039 cm− 1 were attributed to C-O bending vibration, the peak at 925 cm− 1 and 805 cm− 1 were due to C-H out-of-plane bending vibration [30]. The characteristic absorption peaks and their corresponding attributions for 6-AM, BE, and MDA are summarized in Supplementary Table S2.
Fig. 1
Infrared spectra of blank urine and standard samples of 6-AM, BE, and MDA: (a-b) Comparison of ATR-FTIR spectra of the standard of 6-AM and blank urine. (c-d) Comparison of ATR-FTIR spectra of the standard of BE and blank urine. (e-f) Comparison of ATR-FTIR spectra of the standard of MDA and blank urine
Method validation of average ATR‑FTIR spectra for urine samples with added standardsThe detection limits of the three metabolites were evaluated via infrared spectroscopy. Figure 2 illustrates the minimum detectable concentrations of 6-AM, BE, and MDA in spiked urine samples using this approach. The gray-shaded regions highlight metabolite-specific absorption features discernible at these concentrations. Detection thresholds were established by spectral comparison between spiked urine and blank controls. The lowest concentration at which characteristic absorptions remained discernible was 0.02 mg/mL.
Fig. 2
Infrared spectra of blank urine and urine with added standards of 6-AM, BE, and MDA: (a) Comparison of infrared spectra of blank urine (green) and urine added with 6-AM (0.02 mg/mL; turquoise). (b) Comparison of infrared spectra of blank urine (green) and urine added with BE (0.02 mg/mL; orange). (c) Comparison of infrared spectra of blank urine (green) and urine added with MDA (0.02 mg/mL; blue)
Compared to the blank urine sample, only one characteristic absorption peak of 6-AM is observed at 1200 cm− 1 to 1300 cm− 1, consistent with the characteristic peak at 1237 cm− 1 mentioned above (Fig. 2a). The characteristic absorption peaks found in BE at 1365–1200 cm− 1 and 740 − 700 cm− 1 correspond to the characteristic peaks at 1316 cm− 1, 1274 cm− 1and 717 cm− 1 mentioned above (Fig. 2b). MDA exhibited characteristic peaks not present in urine at 1520–1475 cm− 1, 1280–1220 cm− 1, and 1060–1020 cm− 1, which correspond to the characteristic peaks mentioned above: 1488 cm− 1, 1246 cm− 1, and 1039 cm− 1 (Fig. 2c).
Identification of mixed complex metabolites in urine by chemometricsComplex metabolites identification model by PCAWe explored the feasibility of ATR-FTIR coupled with chemometrics for urinary drug metabolite detection using PCA on spiked urine samples (Group A, B, M). However, neither full spectral analysis (4000–400 cm⁻¹) nor fingerprint region analysis (1800–600 cm⁻¹) achieved satisfactory class separation. While score plots (Fig. S3a, S3c) suggested general clustering by group, distinct segregation was lacking. Loading plot (Fig. S3) showed the result of PC-1 loading. The loading plot of PC-1 using spectral fingerprint regions (Fig. S3b) accounted for 44.5% of the variation in this model, while the loading plot of PC-1 using full spectral regions (Fig. S3d) accounted for 29.1%.
Complex metabolites identification model by PLS-DAGiven PCA’s limited classification performance, a supervised PLS-DA approach was adopted. Models were trained on 2/3 of samples (10 per metabolite) and validated on the remaining 1/3 (5 per metabolite).
PLS-DA was used as a supervised method to detect and identify different metabolites in urine samples with added standards. The spectral fingerprint regions (Fig. 3a and c) and full spectral regions (Fig. 3d and f) of the urine samples with added standards were selected for establishing the classification model. Using spectral fingerprint regions, seven PCs were chosen to build a PLS-DA model (Table S5; Fig. S4a). Group B (B) could be effectively distinguished from group A (A) and group M (M). However, group M could not be completely distinguished from Group A in the calibration set. The loading plot of PC-1 (Fig. 3b) corresponds to 26.5% of the variation in this model. The permutation test (200 times) was performed as internal validation of the model (Fig. S4b). External validation of the model was performed in the validation set (Fig. 3c). ROC analysis (Fig. S5) was performed to evaluate the model, suggesting that this model is accurate and stable. The full spectral regions of urine were also selected for conducting the PLS-DA model (Fig. 3d and f). Eight PCs were opted for modeling after variable optimization (Table S6; Fig. S4c). In the model, group A, group M, and group B were broadly distinguished in the calibration set, especially group A. The loading plot of PC-1 (Fig. 3b) corresponds to 23.1% of the variation in this model. Internal validation of the model was conducted using a permutation test (200 iterations) (Fig. S4d), and external validation was performed on the validation set (Fig. 3f). External validation in an independent set also showed good clustering performance (Fig. S8a).
Fig. 3
PLS-DA score plots and loading plots: (a) PLS-DA model score plot using fingerprint regions in the calibration set. (b) PC-1 loading plot of the PLS-DA model using fingerprint regions. (c) PLS-DA model score plot using fingerprint regions in the validation set. (d) PLS-DA model score plot using full spectral regions in the calibration set. (e) PC-1 loading plot of the PLS-DA model using full spectral regions. (f) PLS-DA model score plot using full spectral regions in the validation set
Complex metabolites identification model by OPLS-DAFurthermore, OPLS-DA was used to build classification models for identification of additives in the urine. Spectral fingerprint regions of urine were selected for the first time (Fig. 4a and c). Two PCs were chosen to build the OPLS-DA model after variable optimization (Table S7; Fig. S6a). In the calibration set, group A, group M and group B could be distinguished completely and efficiently (Fig. 4a). Figure 4b shows the PC-1 loading plot of the model. Internal validation was conducted using a permutation test (200 iterations) (Fig. S6b), and external validation was performed on the validation set (Fig. 4c). ROC analysis was performed to evaluate the OPLS-DA model suggesting that this model is stable and accurate (Fig. S7). The full spectral regions were also selected for classification modeling (Fig. 4d and f). Two PCs were the optimal choice for modeling after variable optimization (Table S8; Fig. S6c). Internal validation was conducted using a permutation test (200 iterations) (Fig. S6d). In the calibration set, groups A, M, and B were also distinguished completely and efficiently (Fig. 4d). Figure 4e presents the PC-1 loading plot of the model. External validation of the model was also conducted on the validation set (Fig. 4f). External validation in an independent set also showed good clustering performance (Fig. S8b).
Fig. 4
OPLS-DA score plots and loading plots: (a) OPLS-DA model score plot using fingerprint regions in the calibration set. (b) Loading plot of the OPLS-DA model using fingerprint regions. (c) OPLS-DA model score plot using fingerprint regions in the validation set. (d) OPLS-DA model score plot using full spectral regions in the calibration set. (e) Loading plot of the OPLS-DA model using full spectral regions. (f) OPLS-DA model score plot using full spectral regions in the validation set
Comments (0)