
Remember me


The model estimated the cost-effectiveness of avelumab plus BSC compared with BSC alone. Prior to the introduction of avelumab, BSC after 1L platinum-based chemotherapy was considered standard clinical practice in the Netherlands. The model evaluated patients with locally advanced or metastatic UC who have not progressed after four to six cycles of 1L platinum-based chemotherapy. This population is consistent with the patients enrolled in the JAVELIN Bladder 100 trial [6]. Patient baseline characteristics in the model such as age, sex, body weight, body surface area, and glomerular filtration rate were obtained from the JAVELIN Bladder 100 trial [6].
Model FrameworkA survival partition model in Microsoft Excel (version 2502) was developed with three primary health states: progression free, post progression (PP), and death. Extrapolated PFS and OS curves derived from the JAVELIN Bladder 100 trial [6] were used to calculate the proportion of patients in each health state over time; the model did not require explicit transition probabilities between health states.
The model estimates the probability of being in each of the three health states according to a 7-day cycle. PFS curve estimates provided the probability of a patient being in the progression-free health state, and the estimates from the OS distribution represented the patient’s likelihood of survival at each time point. The difference between the OS and PFS curves yielded the probability of the patient being in the post-progression health state. See Online Resource 1 for an overview of the model structure. A lifetime time horizon of 20 years was set and discount rates of 4% for costs and 1.5% for effects were applied, which aligned with Dutch guidelines [14].
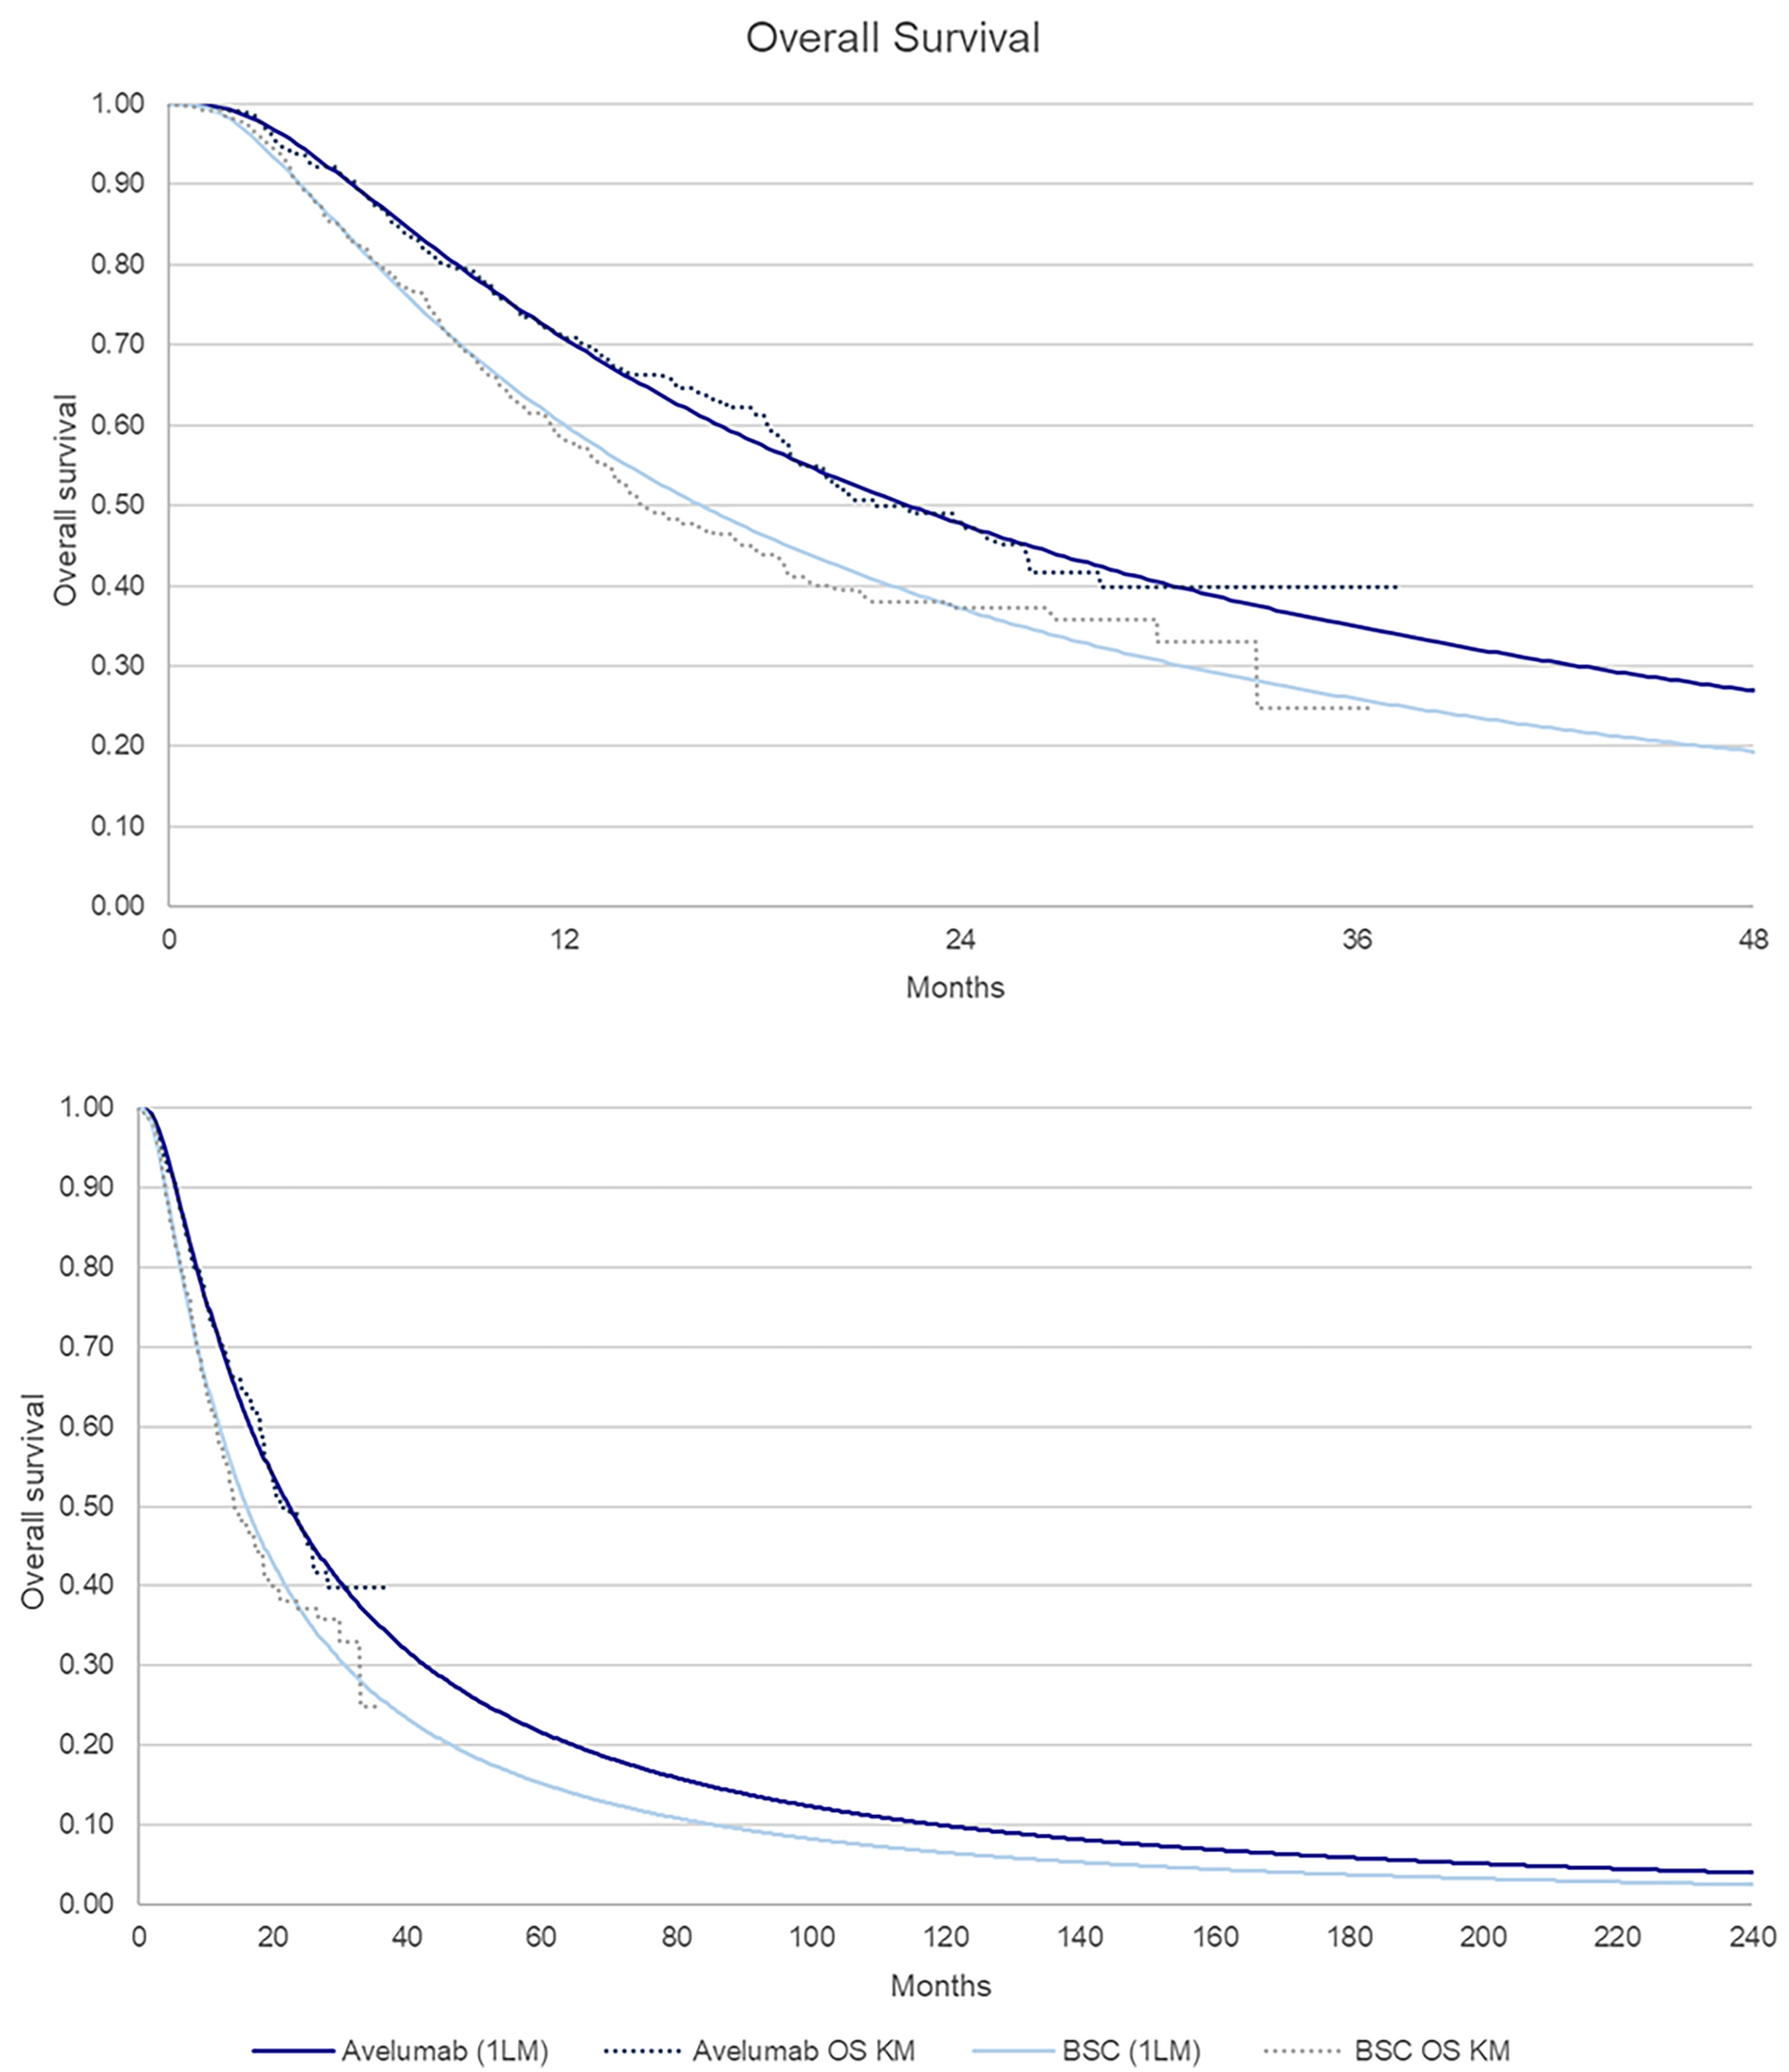
Clinical InputsSurvival extrapolations were fit to the OS and PFS (per blinded independent central review) Kaplan–Meier (KM) data from the JAVELIN Bladder 100 trial to determine lifelong OS and PFS probabilities [6]. The extrapolation was conducted according to National Institute for Health and Care Excellence (NICE) guidelines [15, 16]. Individual fits with the log-normal distribution were applied for OS. For PFS, a piecewise model was applied with a split at 8 weeks. The Gompertz distribution was chosen for both arms for the 0- to 8-week period and the log-normal distribution was selected for both arms for the period > 8 weeks. The OS and PFS extrapolations are presented in Figs. 1 and 2.
Fig. 1 Fig. 2
Progression-free survival
Other clinical inputs such as health-state utilities (mapped to the Dutch setting [17], see Table 1), treatment duration, and incidence of grade ≥ 3 adverse events were also derived from JAVELIN Bladder 100 data. Treatment duration was modelled through extrapolation of the time to treatment discontinuation endpoint in the JAVELIN Bladder 100 trial [6]. Avelumab treatment costs stopped at 2 years, in line with Dutch clinical practice for immunotherapies based on clinical expert input [18].
Table 1 Health-state utilitiesCost InputsA Dutch societal perspective was selected, and therefore both direct and indirect costs were considered in the cost-effectiveness analysis [14]. The modelled inputs included direct costs associated with drug acquisition, drug administration, healthcare resource use, subsequent treatments, end-of-life care, adverse events, and informal care. Additional healthcare costs in life years (LY) due to unrelated diseases were considered in a scenario analysis using the Practical Application to Include Future Disease Costs tool [19]. Productivity losses were not considered in the analysis since the median age of patients in the JAVELIN Bladder 100 trial (avelumab plus BSC, 68 years; BSC alone, 69 years) [6] was above the Dutch retirement age. Table 2 gives an overview of the cost inputs in the cost-effectiveness model and Table 3 presents the subsequent treatment costs per treatment arm based on the distribution in the JAVELIN Bladder 100 trial. A higher proportion of patients in the BSC arm received checkpoint inhibitors (mostly pembrolizumab), leading to higher costs.
Table 3 Subsequent therapy costsModel OutputsThe time in each health state was estimated on the basis of the OS and PFS extrapolations from the JAVELIN Bladder 100 trial [6]. Both costs and utilities were assigned to each health state. LYs, QALYs, and total costs per treatment arm were estimated for both the avelumab plus BSC and BSC alone arms. The incremental costs and QALYs were then used to estimate the incremental cost-effectiveness ratio (ICER).
Several scenario analyses, univariate sensitivity analyses, and a probabilistic sensitivity analysis were conducted to test the robustness of the model and address any uncertainty in the estimates. The probabilistic analysis was performed with 5000 iterations.
Comments (0)