
Remember me
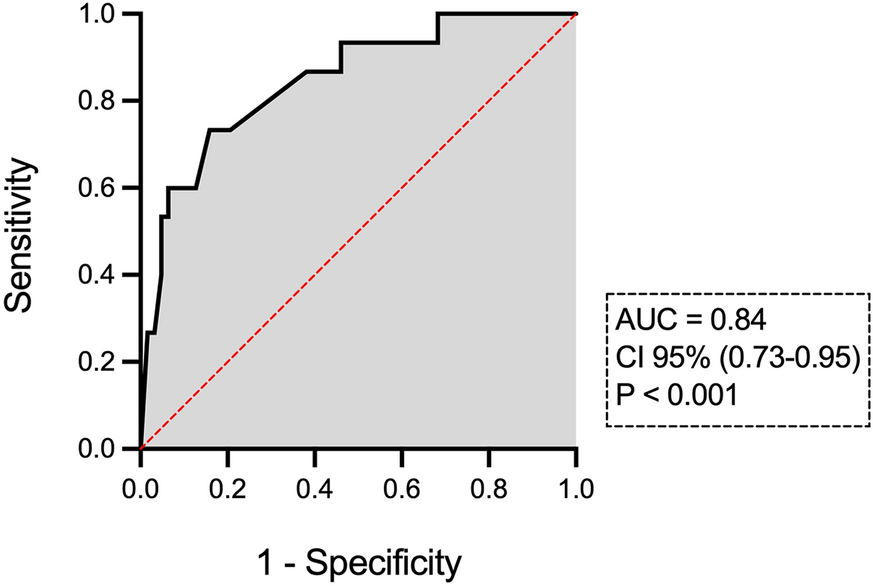


Table 1 summarizes the characteristics of the total cohort, with 84 patients having normal upfront thyroid function tests. The median age of the cohort was 55 years, ranging from 26 to 86 years. The distribution of sex showed 54.7% male and 45.3% female. The histopathology included SCC (57.1%), mucoepidermoid carcinoma (9.5%), adenoid cystic carcinoma (9.5%), and other types. The common primary site distribution consisted of oral cavity (29.7%), larynx (26.1%), parotid (25.0%), and nasopharynx (8.3%). Table 1 also details tumor (T) and node (N) classifications, with the majority having no metastasis. The mean thyroid volume was 17.8 cc, ranging from 5.0 to 83.2 cc. The prescribed radiation doses varied, with the most common being 68–70 Gy (36.9%). Different radiotherapy techniques and chemotherapy regimens are also shown.
Table 1 Patient characteristicsA descriptive analysis of thyroid dose-volume metrics for the total eligible cohort and patients with normal thyroid function tests is demonstrated in Supplementary Table 1. For the total cohort, the mean thyroid volumes receiving specific doses (V5, V10, V15, V30, and V60 Gy) were 14.2 cc (77.7%), 13.2 cc (75.06%), 12.6 cc (71.6%), 11.4 cc (63.9%), and 3.5 cc (22.0%), respectively. The ranges vary for each dose volume metric, with corresponding 95% confidence intervals (95% CI) shown in Supplementary Table 1. For patients with normal upfront thyroid function tests, similar metrics were found, with slightly higher mean volumes receiving the specified doses.
Incidence of HypothyroidismIn total, 17 patients (20.2%) developed hypothyroidism after radiation therapy. A total of seven patients with nasopharyngeal carcinoma were enrolled, of whom the pituitary region was in the radiation field. The average radiation dose to the pituitary gland varied from 48.2 to 73.1 Gy. However, none of the patients examined in this study experienced pituitary hypothyroidism. The onset of PRH occurred at the 3rd month in ten patients (58.8%), at the 6th month in six patients (35.2%), and at the 12th month in one patient (5.9%). In total, eight patients (47.1%) had hypothyroidism at the last follow-up (i.e., 12th month postradiation).
Predictive Factors of Postradiation HypothyroidismThe association between patient, tumor, and treatment factors and the occurrence of EO-PRH was evaluated (Table 2). The mean age for patients with normal thyroid function was 55.6 years (95% CI 52.2–59 years), similar to those who had hypothyroidism. Primary disease histopathology showed a notable association with EO-PRH, with a statistically significant odds ratio (OR) of 4.52 (95% CI 1.27–15.67, p = 0.01). This indicates that patients with SCC are more likely to develop EO-PRH than those with other histopathology subtypes. Additionally, the primary site of the tumor shows a trend toward significance (p = 0.08), suggesting a potential association with EO-PRH. Age, sex, primary staging, thyroid volume, radiotherapy technique, and chemotherapy do not show statistically significant associations with EO-PRH in this analysis.
Table 2 The association between patient/tumor factors and hypothyroidism following radiationPrior to assessing the predictive significance of dosimetric parameters, we conducted a comparison between the hypothyroid and euthyroid groups regarding dose-volume parameters. The results are presented in Table 3. Of all the parameters analyzed, the difference between the two groups in terms of V30 and VS30 values approached statistical significance (p = 0.07 and 0.05, respectively). These findings hint at a possible link between V30 and VS30 values and EO-PRH.
Table 3 Comparison between hypothyroid and euthyroid groups in terms of dosimetric parametersThen, we evaluated whether any dose-volume parameter of the thyroid is associated with EO-PRH. Table 4 outlines the results of the corresponding binomial logistic regression analysis. The β1 values for V5–V60 ranged from −0.005 to 0.02, with the corresponding OR equal to 1.02, indicating a minimal impact on the likelihood of EO-PRH. The β1 values for VS5–60 ranged from −0.15 to −0.03, with the corresponding OR ranging between 0.84 and 0.96, indicating a minimal-to-moderate protective impact on the likelihood of EO-PRH. The p-values for the regression models varied, with V30 showing statistical significance (p = 0.03). Likelihood ratio tests revealed significant log values for V15 and V30 as well as VS5,10,15,30, suggesting their potential as predictors of EO-PRH. Cox–Snell’s R-squared values ranged from 0.002 to 0.07, indicating a modest fit of the model to the data. The AUC-ROC values ranged from 0.54 to 0.70, with V15,30 and VS10,15,30 demonstrating a better ability to predict EO-PRH (p < 0.05).
Table 4 Predictive value of thyroid dose-volume parameters for early onset postradiation hypothyroidismOn the basis of regression results, V30 may serve as a significant predictor of hypothyroidism following neck radiotherapy (p = 0.03). The ROC analysis identified an optimal V30 threshold of 74.6% for predicting hypothyroidism on the basis of Youden’s index. At this cutoff, the sensitivity was 82.3%, the specificity was 49.2%, and the AUC-ROC was 0.62, indicating a moderate ability to predict EO-PRH. In patients with V30 ≤ 74.6%, the 1-year incidence of hypothyroidism was 8.3% (3/36); in patients with V30 > 74.6%, this rate was 29.1% (14/48).
On univariable analysis, cancer histopathology, primary tumor site, V15,30, and VS15,30 showed significant differences between two groups of patients with normal or impaired thyroid function following radiation (p < 0.10). These factors were thus included in the further multivariable analysis to find the independent predictive factors of EO-PRH. Chemotherapy/targeted therapy was not significantly associated with EO-PRH in univariable analysis (OR 0.40, 95% CI 0.13–1.27, p = 0.17) and was therefore not included in the multivariable model. A p-value threshold of < 0.10 was applied in the univariable analysis to restrict the number of predictors included in the multivariable model. This threshold was chosen to mitigate the risk of overfitting, considering that the number of events in our cohort was 17 out of 84 cases. Maintaining a sufficient events-per-variable (EPV) ratio was crucial to ensuring the model’s reliability. The multivariable logistic regression analysis identified the primary cancer site as a significant predictive factor for EO-PRH (oral cavity versus larynx: OR 9.09, 95% CI 1.59–100, p = 0.01). Notably, the variable V30 of the thyroid exhibited a wide confidence interval (OR 1.11, 95% CI 1.006–1.35) despite an insignificant p-value (p = 0.16). The Hosmer–Lemeshow test (p = 0.68) indicated an adequate model fit. The model demonstrated strong predictive accuracy, with an AUC of 0.8476 (95% CI: 0.7385–0.9567, p < 0.0001) in the ROC analysis. The model achieved 85.9% classification accuracy, with a negative predictive value (88.2%) and a positive predictive value (70.0%). The final model was compared against an intercept-only model, with the likelihood ratio test (G2 = 21.47, p = 0.0031) demonstrating a significant improvement in model performance. Table 5 summarizes the multivariable analysis results.
Table 5 Multivariable analysis of predictors of early onset postradiation hypothyroidismPredictive Model of postradiation HypothyroidismThe multiple logistic regression analysis revealed that the model, including histopathology type, tumor site, V15,30, and VS15,30 could significantly predict EO-PRH. The log-likelihood ratio (G-squared) equal to 21.4 (p = 0.003) suggests that the selected model is preferable over the intercept-only model. The AUC-ROC was 0.84 (95% CI 0.73–0.95), indicating good discrimination (p < 0.001). The AUC-ROC curve for this model is depicted in Fig. 1.
Fig. 1
The receiver operating characteristic curve of the predictive model for postradiation hypothyroidism
Association Between Dose-Volume Parameters and Hypothyroidism Over TimeThe Cox proportional hazards regression analysis was conducted to examine the association between different dose-volume parameters of the thyroid (V5–60 and VS5–60) and the time to the occurrence of EO-PRH (Supplementary Table 2). The analysis revealed that higher values of V60 are associated with a slightly higher hazard of time to developing hypothyroidism, as indicated by its positive associations and statistically significant results (hazard ratio [HR] 1.03, 95% CI 1.01–1.05, p = 0.009). The contrast condition is justified for the VS60 (HR 0.91, 95% CI 0.83–0.99, p = 0.04).
Comments (0)