Biological material
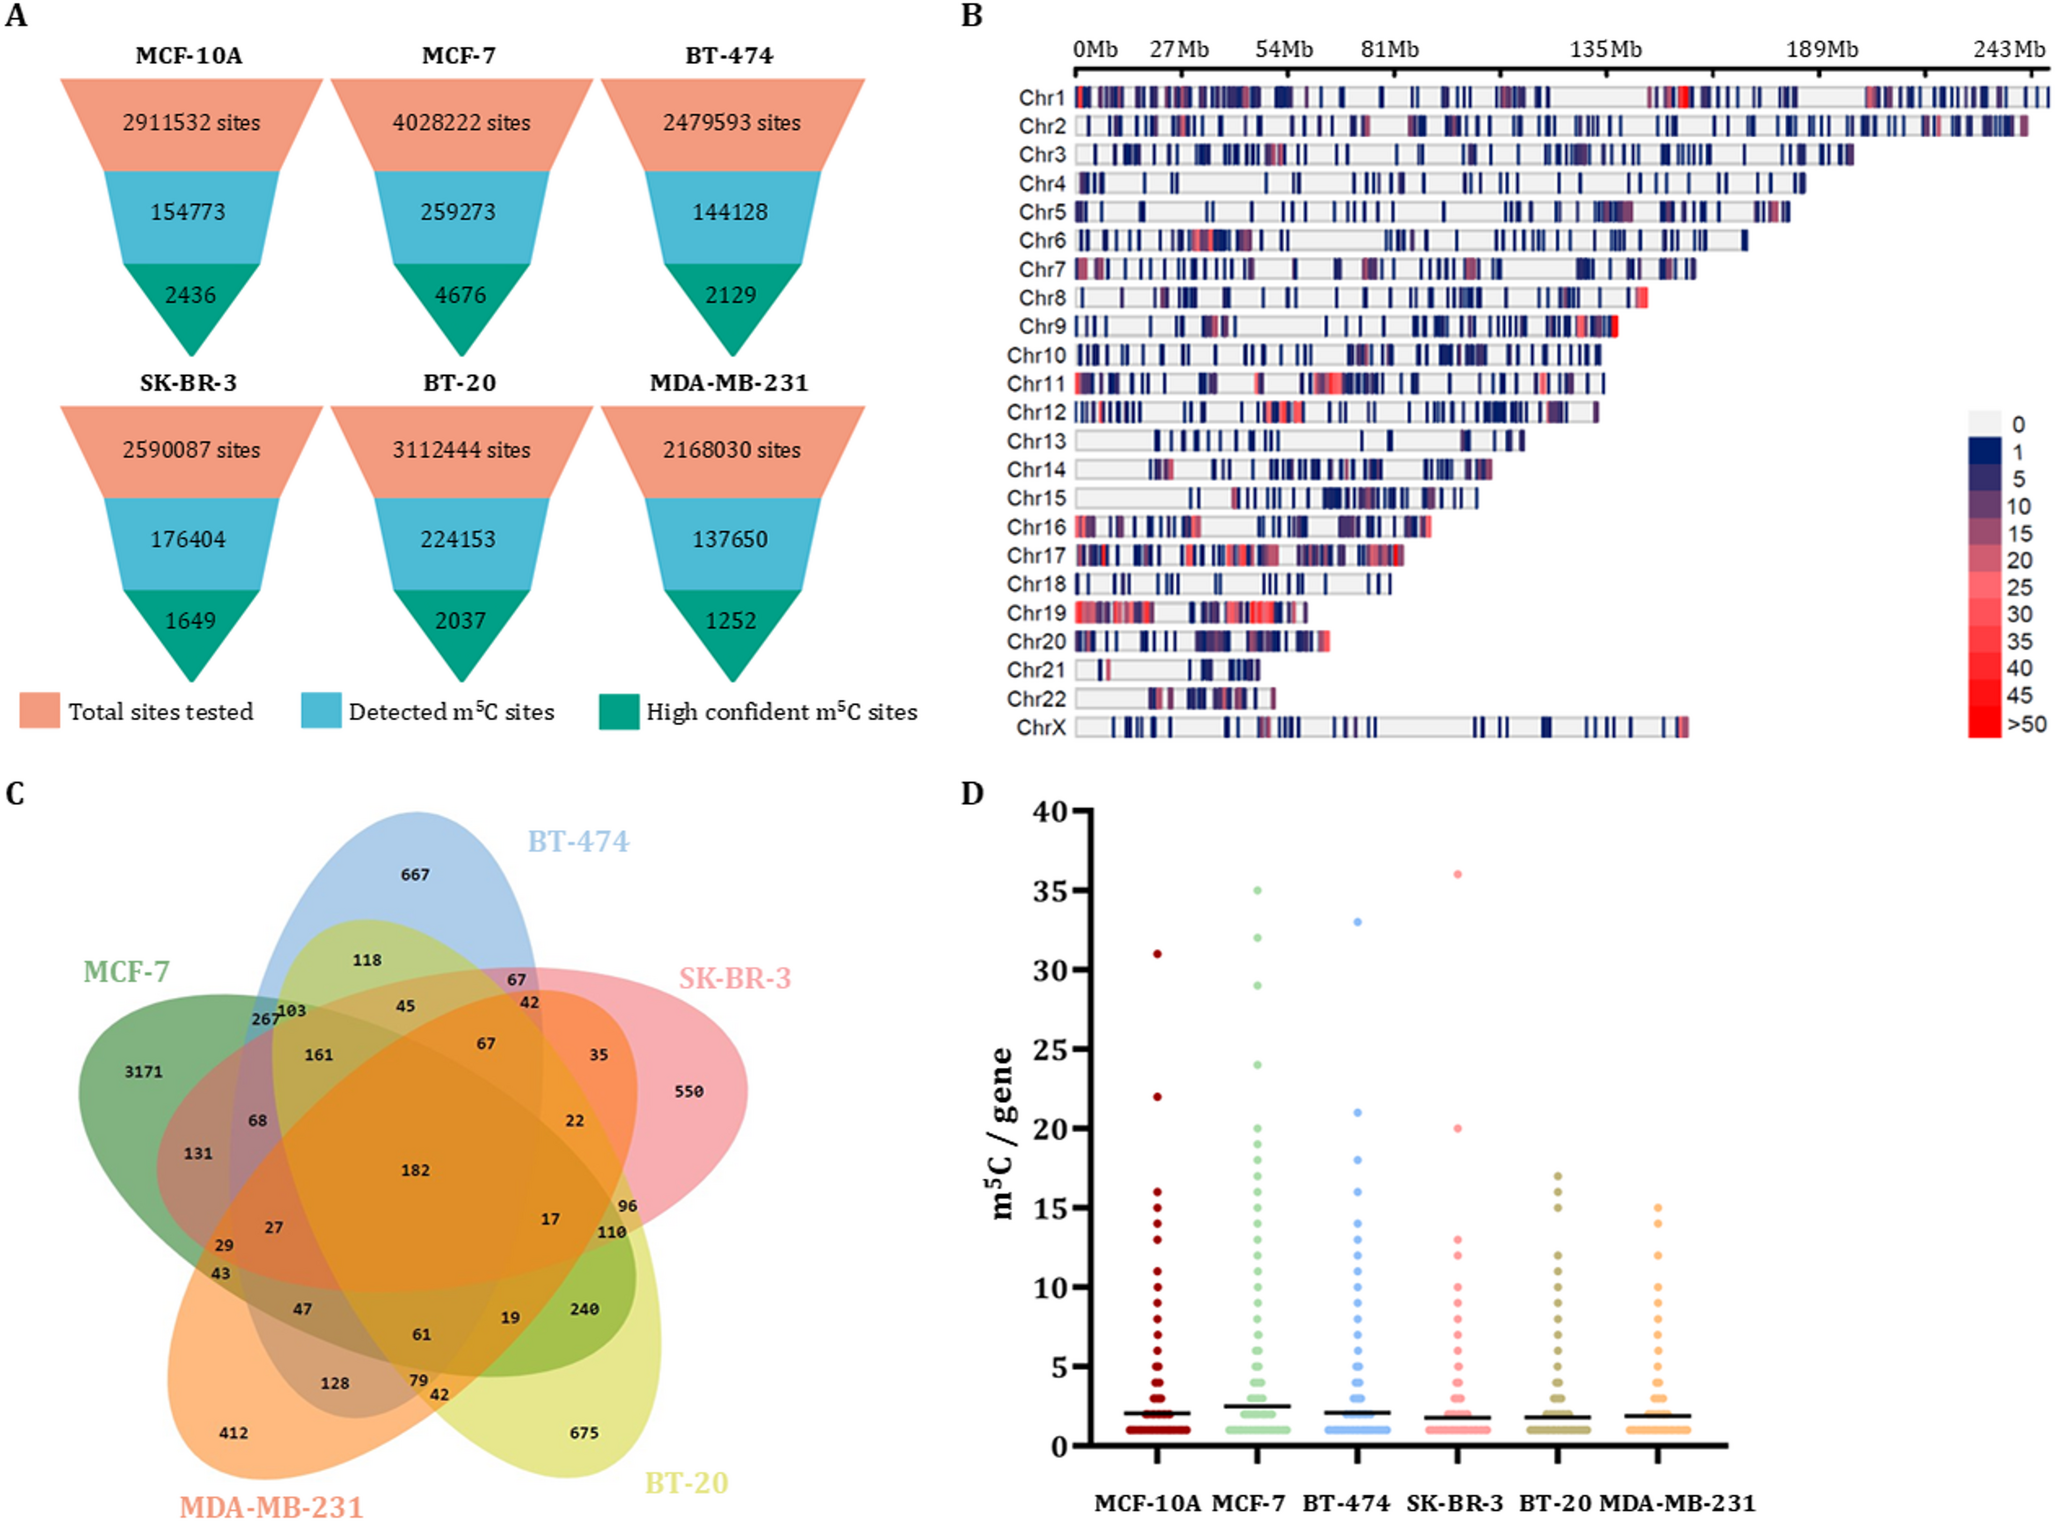
To investigate the human m5C methylome of breast cancer, we used MCF-7 (Luminal A), BT-474 (Luminal B), SK-BR-3 (HER2+), BT-20 and MDA-MB-231 (Basal-like TNBC) cell lines, which represent the major molecular subtypes of breast cancer. Additionally, the breast epithelial cell line MCF-10A was utilized as a non-cancerous reference cell line, to compare the findings derived from different breast cancer molecular subtypes. All cell lines were cultured based on the handling instructions of American Type Culture Collection (ATCC).
Total RNA extraction and mRNA selection
Total RNA isolation from each cell line was performed using the TRIzol Reagent (Ambion™, Thermo Fisher Scientific Inc.). All RNAs were appropriately diluted in the RNA Storage Solution (Ambion™) and quantified using the Qubit® RNA HS Assay Kit (Invitrogen™, Thermo Fisher Scientific Inc.). Subsequently, the positive selection of the polyA + RNAs was accomplished with the Magnosphere™ UltraPure mRNA Purification Kit (Takara Bio Inc.), according to the guidelines of the manufacturer. Concentration and quality assessment was performed with capillary electrophoresis using the Agilent 2100 Bioanalyzer and an RNA 6000 Pico kit (Agilent Technologies, Foster City, CA, USA).
Golden gate cloning and bacterial transformation
An all-in-one plasmid for CRISPR/Cas9 genome editing was obtained from Addgene (plasmid #62988). This plasmid encodes the Cas9 protein from S. pyogenes, includes the pac gene for puromycin resistance, and contains one cloning site for a sgRNA. Prior to ligation, the gRNA overhangs were phosphorylated using T4 polynucleotide kinase (New England BioLabs). To develop high-efficient CRISPR/Cas9 knockout of the NSUN2 gene, we designed a gRNA targeting its coding sequence. The designed gRNA sequence targeting NSUN2 (5’– GCTGTTCGAGCACTACTACC − 3’) was subjected to BLAST sequence analysis to detect any significant similarities with other mRNAs in the reference human genome (GRCh38.p14). The designed gRNA was then inserted into the plasmid template using Golden Gate cloning. For the ligation process, 400 U of T4 DNA ligase (Thermo Fisher Scientific, Waltham, MA, USA) were used. The ligation reaction was treated with Exonuclease V (RecBCD, New England BioLabs) at 37 °C for 30 min to eliminate any remaining linearized DNA and the reaction was heat inactivated at 70 °C for 30 min. Finally, the treated ligation product was purified using the NucleoSpin® Plasmid kit (Macherey-Nagel GmbH & Co. KG, Duren, Germany). Bacterial transformation with the ligated plasmids was conducted using NZY5a competent cells (NZYTech, Lisbon, Portugal) according to the manufacturer’s protocol. The successful insertion of gRNA into the plasmid vector was validated with Sanger sequencing.
CRISPR/Cas9 genome editing
To generate NSUN2 knockout MCF-7 cells (NSUN2−), CRISPR/Cas9 genome engineering was carried out in a six-well cell culture plate. The day before transfection, the cells were 80–90% confluent in a T-75 flask. A total population of 3 × 10⁵ cells were seeded 18–24 h prior to transfection in complete medium per well. The reaction included 4.0 µl Lipofectamine 3000 (Invitrogen, Thermo Fisher Scientific Inc.), Opti-MEM™ I Reduced Serum Medium (Gibco/Life Technologies), 2.5 µg of plasmid DNA and 5.0 µl of P3000 reagent. At 24 h following transfection of the construct, cells were treated with 2 µg/ml puromycin for the positive selection of the successfully modified cells. The transfected cells were harvested, and total RNA, genomic DNA (gDNA), and protein lysates were isolated for downstream analysis.
Targeted DNA-seq
Evaluation of the NSUN2 knockout efficiency was performed by targeted DNA sequencing using Ion Torrent™ S5 platform. For this purpose, two gene-specific primers were utilized (F: 5’– GTAGACGTCTCTTTCCTTCCTCA − 3’ and R: 5’– CTTCCTGAATCCAAACCGCTGA − 3’), designed to generate an amplicon of 312 bp, which contained the gRNA target site. Template preparation, enrichment and chip loading were carried out on an Ion Chef™ instrument, following the instructions of the manufacturer. Sequencing reads were aligned to the GRCh38 reference genome, and Integrative Genomics Viewer (IGV) was used to visualize insertions and deletions (indels) within the region of interest.
Western blotting
Western blot was performed to assess the loss of NSUN2 protein in the KO cells (Supplementary Data). Cells were lysed using 1X RIPA buffer and protein concentrations in the lysates were quantified using the Bradford reagent, measuring absorbance at 595 nm. Proteins were separated by electrophoresis on 10% sodium dodecyl sulfate-polyacrylamide gels (SDS-PAGE) alongside a pre-stained protein marker to monitor migration. Following electrophoresis, proteins were transferred onto a nitrocellulose membrane, as confirmed by staining with Ponceau S solution. The membrane was blocked with a 5% non-fat milk solution to prevent non-specific binding. Subsequently, the membrane was incubated overnight at 4 °C with the primary NSUN2 Rabbit antibody mAb (44056, Cell Signaling) which has been diluted in the blocking solution according to manufacturer’s instructions. β-Actin antibody (#4967, Cell Signaling) was used as an internal loading control. After primary antibody incubation, the nitrocellulose membrane was incubated with the secondary antibody. For protein detection, the membrane was treated with an alkaline phosphatase solution containing 5-bromo-4-chloro-3-indolyl phosphate (BCIP) and nitro blue tetrazolium (NBT) substrates. Following sufficient incubation in the dark, protein bands were visualized, and results were documented.
Nanopore direct RNA sequencing
A diverse panel of human breast cell lines was sequenced to capture the variability of m5C epitranscriptome in all major molecular subtypes of breast cancer (MCF-7 and BT-474 for luminal breast cancer, SK-BR-3 for HER2 + breast cancer, BT-20 and MDA-MB-231 for TNBC) as well as the non-malignant MCF-10A breast cells. For the RNA library construction, an initial amount of 500 ng mRNA sample was used from each breast cancer cell line. Sequencing libraries were prepared using the Direct RNA sequencing kit (SQK-RNA002, Oxford Nanopore Technologies Inc., ONT), following the manufacturer’s instructions. Briefly, the RT Adapter (RTA) was annealed and ligated to the 3’ poly(A) tails of mRNAs by incubating each sample at room temperature for 10 min with T4 DNA ligase (New England Biolabs Inc., Ipswich, MA, USA). Reverse transcription was then performed in a 40 µl reaction volume using a hot-lid Veriti 96-Well Fast Thermal Cycler (Applied Biosystems™). Accordingly, 1.8X Agencourt RNAClean XP beads (Beckman Coulter Inc.) were used for the purification of the synthesized cDNA sample. The RNA Adapter (RMX) was subsequently ligated to the cDNAs by incubating at room temperature for 10 min with T4 DNA ligase in a 40 µl reaction volume, followed by a second purification step with 0.4X Agencourt RNAClean XP beads. The final libraries were loaded onto a FLO-MIN106D flow cell with R9.4.1 chemistry and the nanopore sequencing was conducted on a MinION Mk1C sequencer (Oxford Nanopore Technologies Ltd, ONT). To ensure reproducibility, two sequencing runs were performed for each cell line.
Post-processing of nanopore raw signals
To ensure consistency and avoid the introduction of potential biases during the analysis of the generated results, all sequencing datasets were processed uniformly using identical bioinformatic pipelines, including algorithm versions and parameters. Nanopore sequencing data were initially basecalled using Guppy v.6.2.1 utilizing the RNA model rna_r9.4.1_70bps_hac and applying a default read Q-score filtering threshold of 7. Only reads that passed the quality filtering were subsequently analyzed. Interactive quality assessment of the nanopore reads, including estimation of median read length, total read count, median quality score and quality scores over run time was performed with NanoPlot (De Coster and Rademakers 2023). Basecalled sequences were mapped to the reference human transcriptome (NCBI RefSeq assembly: GCF_000001405.40) using minimap2 v. 2.22 (Li 2018) and IsoQuant (Prjibelski et al. 2023) was employed for expression analysis and transcript quantification. Indexing and alignment of nanopore events to reference k-mers was carried out using nanopolish v. 0.14.
m5C stoichiometry analysis and mRNA expression
The aligned nanopore reads were analyzed using CHEUI, a two-stage neural network software designed to detect and quantify m5C sites in nanopore RNA sequencing datasets (Acera Mateos et al. 2024). The minimum coverage of eight sequencing reads was applied for any site to be considered as m5C. Differential methylation levels between breast cancer cell lines and the non-cancerous MCF-10 A cell line were assessed using a Wilcoxon rank-sum test facilitated by CHEUI-diff module, using the default parameters. Each identified m5C site was assigned a prediction probability score ranging from 0 to 1. It is important to note that all detected m5C sites demonstrated consistent stoichiometry and modification probability across replicates. It should be mentioned that a probability cutoff of 0.9999 for CHEUI-solo Model 2 corresponds to a false discovery rate (FDR) equal to 0.000384 for m5C, as determined by a permutation test (Acera Mateos et al. 2024). Hence, among the detected sites in our study, only those exhibiting prediction probability > 0.9999 were considered highly confident m5C. Exploiting the ability of CHEUI to provide the 9-mer (m5C-centered) of each detected m5C, besides the overall m5C epitranscriptomic analysis, we also implemented motif-specific analysis of m5C sites in both WT and KO conditions.
To investigate the global impact of m5C methylation on mRNA abundance, we analyzed the correlation between differential methylation levels (WT vs. KO) and differential expression of transcripts. Transcript abundance was assessed with the Transcripts Per Million (TPM) method. Then, methylation stoichiometry was stratified into five intervals (0.0–0.2, 0.2–0.4, 0.4–0.6, 0.6–0.8, and 0.8–1.0), representing incremental methylation levels. TPM distributions across these stoichiometric ranges were visualized using split-violin plots to assess the relationship between m5C methylation intensity and mRNA expression.
Differential methylation, co-methylation and functional enrichment analysis
Differential methylation of mRNA m5C sites between the non-cancerous breast cell line (MCF-10 A) and various breast cancer cell lines (SK-BR-3, MCF-7, MDA-MB-231, BT-474, BT-20) was assessed using the CHEUI algorithm (Acera Mateos et al. 2024). Specifically, we determined the absolute number of raw sequencing reads associated with differentially modified m5C sites based on CHEUI m5C stoichiometry and coverage and calculated the log2-transformed fold change (log2FC) of m5C methylation for each site between non-cancerous and cancerous conditions. Sites with significant hypo- or hypermethylation were identified using cutoffs of|log2FC|≥1.0 and an adjusted p-value of p < 0.001. Differential methylation of m5C sites was evaluated for each cancerous cell line compared to non-cancerous breast cells MCF-10A using volcano plots generated in R with the ggplot2 package. Next, we estimated the concordance of m5C mRNA methylation between breast cancer cell lines by calculating Pearson’s correlation coefficient and constructing a pairwise scatterplot using ggplot2. The top 20 significant hypo- and the top 20 hypermethylated m5C sites from each breast cancer cell line were extracted from the correlation analysis. Genes corresponding to all significantly hypo- and hypermethylated m5C sites were then used for functional analysis of human genes with significantly modified m5C sites in breast cancer, utilizing ShinyGO v.0.80 with default settings (0.05 FDR-adjusted p-value as threshold) (Ge et al. 2020).
Expression analysis of NSUN2 targets
To evaluate the expression of NSUN2 target genes (FBL, DNMT2, YBX1, TRMT112, TP53, ALYREF, IGF2BP1, LIN28A, NOP2) in WT and KO cells, SYBR Green-based quantitative PCR (qPCR) assays were performed using gene-specific primers (Supplementary Table S1). Total RNA (5 µg) was extracted from WT and KO cells and used as template for reverse transcription (RT). A 12 µl reaction mixture was prepared, consisting of 10 µl total RNA, 1 µl oligo-dT (10 µM) and 1 µl of dNTP mix (10 mM each). The mixture was incubated at 65 °C for 5 min in a Veriti™ 96-Well Fast Thermal Cycler (Applied Biosystems™), followed by cooling on ice for 2 min. The final reaction volume was adjusted to 20 µl by adding 2 µl of nuclease-free H2O, 4 µl of 5X First-Strand Buffer, 1 µl of DTT (100 mM), 10U of RNaseOUT inhibitor (Invitrogen™, Thermo Fisher Scientific Inc.) and 100U of SuperScript™ III (Invitrogen™, Thermo Fisher Scientific Inc.). RT was performed at 50 °C for 60 min, followed by enzyme inactivation at 70 °C for 15 min. The generated cDNA was diluted 1:10 in nuclease-free H2O and was used as the template for qPCR. qPCR was conducted using the QuantStudio™ 5 Real-Time PCR System (Applied Biosystems™) in 10 µl reaction volumes, containing 5 µl 2X Kapa SYBR® Fast qPCR Master Mix (Kapa Biosystems, Inc., Woburn, MA, USA), 2 µM of each primer, 2 µl of nuclease-free H2O as well as 1 µl of diluted cDNA template. The thermal cycling protocol included an initial denaturation at 95 °C for 3 min, followed by 40 cycles of 95 °C for 3 s and 60 °C for 30 s. Fold changes (FC) in target gene expression between two conditions were assessed using the 2−ΔΔCt method, with human GAPDH mRNA serving as the internal reference control gene. Melt-curve analysis confirmed primer specificity.
mRNA stability assay
Both WT and KO cells were plated in 24-well plates and treated with actinomycin D (Gibco™, Thermo Fisher Scientific Inc.) at a concentration of 5 µg/ml for 0, 3, 6, and 9 h to inhibit transcription. After treatment, cells were collected, and total RNA was isolated. RNA was reverse transcribed using SuperScript™ III Reverse Transcriptase in 20 µl reaction volumes as described previously. First-strand cDNA was used as a template for qPCR with gene-specific primers targeting mRNAs containing m5C sites (Supplementary Table S2). GAPDH was used as internal reference control to normalize expression obtained by qPCR. Relative expression for mRNA targets was calculated using the 2−ΔΔCt method, and results were expressed in relative quantification (RQ) units. Finally, the proportion of remaining mRNA in each time point relative to time 0 was calculated.


Comments (0)