
Remember me
The ATD-GC/MS method has previously been shown to release the investigated textile chemicals in polyester close to 100% at a desorption temperature of 175 °C. A good performance in terms of detection limits and reproducibility was obtained for both pure polyester and polyester mixed with other synthetic fibers [19]. Cotton and cotton blends, on the other hand, are different regarding physical and chemical properties, as mentioned in the Introduction. This would most likely have an influence on the thermal desorption efficiency and could affect the performance of the method.
Throughout the present study, ATD-GC/MS analysis of polyester was used as a benchmark, due to 100% desorption of spiked analyte amounts and thus defining a 100% response for all compounds at a desorption temperature of 175 °C, as shown in Table S5. All analyses included n-eicosane-d42 since this compound was shown to be fully desorbed and exhibit the same response irrespective of textile composition, and the relative responses (analyte/n-eicosane-d42) were thus used to compare the different materials.
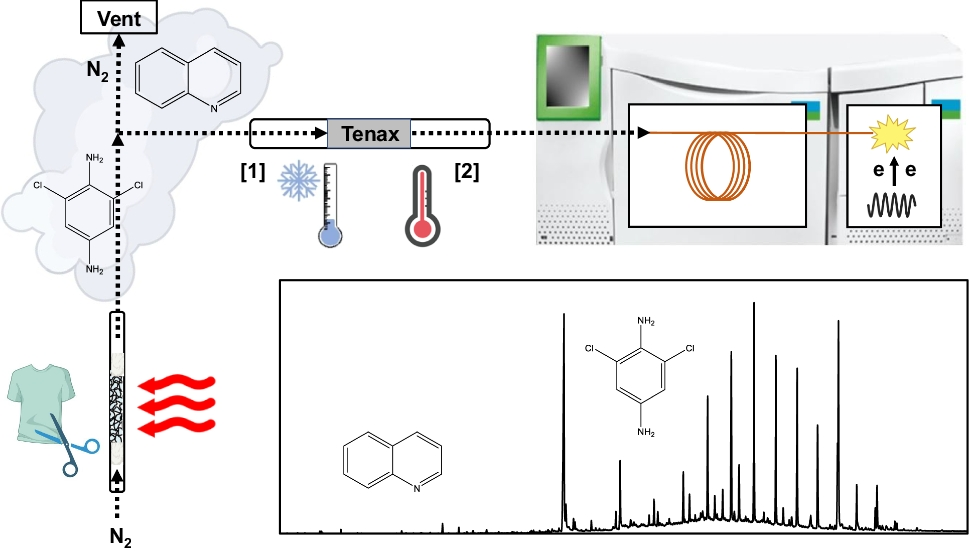
All MS analyses were performed in full scan mode since one of the aims of the ATD-GC/MS method is to enable both non-target screening and quantitative target analysis within the same run.
Examination of parameters affecting the ATD-GC/MS analysisThe cotton materialWhen performing solvent extraction of the investigated compounds spiked on Cotton-1, a material made of 100% cotton, a recovery level below 30% was obtained for most of the compounds, although with a high repeatability. The low recoveries are in strong contrast to the polyester material, which gave a yield close to 100% for almost all of these compounds. A similar behavior was also observed when using the ATD-GC/MS. A majority of the spiked analytes, especially the nitrogen-containing, exhibited a considerably lower ATD-GC/MS response when compared to the polyester material. In Fig. 2, this is exemplified by quinoline and 2,6-dichloro-1,4-phenylenediamine. The yield is high, around 100% when spiked to polyester, the upper curve, and lowest for Cotton-1.
Fig. 2
Detector response in the ATD-GC/MS for quinoline and 2,6-dichloro-1,4-phenylenediamine spiked with different amounts added to 20 mg of polyester and cotton (Cotton-1), respectively. ● = polyester, ■ = cotton
In Fig. 3, the yields are shown for the used internal standards, displayed to represent the different investigated analyte classes on both Cotton-1 and another material of 100% cotton fibers, Cotton-2. As shown in the figure, the desorption behavior of the compounds shows large differences between the materials.
Fig. 3
Desorption yields (%) from two cotton matrices for the internal standards representing the different investigated chemical classes of compounds. The compounds are presented in GC retention order. Gray = Cotton-1, red = Cotton-2 (n = 3)
There are also large differences between the various compounds when desorbed from the same cotton material, exemplified by Cotton-2 for which the desorption yield for 3-nitroaniline-d4 is less than 10%, while it is around 100% for bis(2-ethylhexyl) phthalate-d4. The compounds in the figure are presented in GC retention order, which means roughly from higher to lower volatility, and there is a clear distinction between quinoline and bis(2-ethylhexyl) phthalate with vapor pressures of 0.06 and 1.4∙10−7 mm Hg at 25 °C, respectively (data from PubChem). Still, in spite of the considerably lower volatility of bis(2-ethylhexyl) phthalate, this substance is almost completely desorbed from both cotton materials. This shows that the differences in vapor pressure are not the main reason for these large variations in thermal desorption.
As shown in Fig. 3, Cotton-2 demonstrated the lowest desorption efficiency for all analytes, with the lowest yields for 2-methylbenzothiazole and the nitrogen-containing compounds, here compared to the two isotope-labelled phthalate compounds and benzophenone. The lower yields of the nitrogen-containing compounds indicate a stronger adsorption of these substances to the material via hydrogen bonding and/or polar-polar interactions with the hydroxyl groups on the cellulose surface. This further explains the weaker interaction for more lipophilic compounds, such as bis(2-ethylhexyl) phthalate. These variations in adsorption strength lead to different compound-dependent desorption yields in the ATD. The different desorption efficiencies between the materials may also depend on the physical structure of the cotton fabric, exposing varying amounts of accessible hydroxyl groups on the fiber surfaces. Further, the diffusivity of the cotton materials could also play a role in the thermal desorption. For instance, a less compact material could result in faster diffusion, requiring less time for a complete desorption. The desorption yields for all investigated compounds are presented in Figs. S1–6 in Electronic Supplementary Material.
The influence of the cotton material on the ATD desorption yield was further investigated for eight additional textiles, S1–S8 (Table 1). Four textiles, S1–S4, were made of 100% cotton, while S5–S8 were of mixed fabrics containing cotton with various compositions of synthetic fibers. In Fig. 4, the results for some analytes frequently detected as native compounds in everyday garments are shown. The compounds are presented in the diagram in GC retention order.
Fig. 4
Desorbed amount (%) for selected textile chemicals spiked on eight textile matrices, S1–S8. Samples are from left to right (blue to brown bar) S1 to S8, where S1–S4 contained 100% cotton, S5–S6 95% cotton, S7 75% cotton, and S8 38% cotton. The red dashed line shows 100% yield. The compounds are presented in GC retention order (n = 3)
As for the 100% cotton materials investigated above, these eight garments also showed large differences in the desorption yield. The lowest values were generally found for 95–100% cotton textile materials, with the response for 1,3-dinitrobenzene in textile S3 (100% cotton, gray bar) as low as 12%. The 38% cotton blend, on the other hand, demonstrated generally higher and less varying yields, ranging from 72% to higher. The general conclusion to be drawn is that there are large differences between cotton materials, which must be considered when developing an analytical method based on thermal desorption. The yields for the remaining target compounds are presented in Figs. S7–12.
The ATD desorption time and temperatureThe ATD desorption time and temperature parameters were investigated for the effect on the desorption yield of spiked analytes, exemplified by the internal standard compounds spiked on Cotton-1 (Table 4). Repeating the 10-min ATD desorption cycle at 175 °C twice resulted in a total desorption time of 30 min at 175 °C. As can be seen in the table, an increased desorption time, including cycles 2 and 3, only resulted in a minor increase of at most 3–4% of the total extracted amount.
Table 4 The percentage extracted from spiked Cotton-1 at each 10-min desorption at 175 °C (n = 3) followed by 220 °C (n = 3)After these three initial desorption cycles at 175 °C, the desorption temperature was elevated to 220 °C, and three consecutive desorption cycles, cycles 4 to 6, were performed on the same sample. A slight increase in the desorbed amount was observed only for quinoline and 2-methylbenzothiazole, indicating a stronger adsorption of these compounds to the cotton. By increasing the desorption temperature further to 260 °C and 280 °C, the yield from the cotton matrix could be increased for four of the compounds. However, these elevated temperatures cannot be used. Despite a slightly more efficient desorption at these elevated temperatures, the ATD desorption temperature was kept at 175 °C in order to avoid thermal decomposition of any present azo dyes into arylamines, an effect that we have observed earlier [19]. Data on all compounds are given in Tables S6 and S7.
Wettability of cotton materialsSince both Cotton-1 and Cotton-2 are composed of 100% cellulose and should possess similar surface chemistry, their differences in desorption yields could instead be attributed to physical properties, such as variations in their fabric structure. Microscope images of Cotton-1 and Cotton-2 showed distinct fabric patterns. Cotton-1 is knitted, while Cotton-2 is woven. This implies that they have different thread densities and hence different pore sizes (Fig. 5). This is consistent with their calculated bulk densities (Cotton-1: 252 ± 16 kg/m3, Cotton-2: 429 ± 10 kg/m3), indicating that Cotton-1 has a larger pore size.
Fig. 5
Optical and electronic microscope images of Cotton-1 (left) and Cotton-2 (right). Scale bar: 500 µm
The sorption velocities of liquids with different polarities were measured using a tensiometer. The results are summarized in Table 5.
Table 5 Sorption velocities, C values, and water contact angle for Cotton-1 and Cotton-2For liquids with low polarity and surface tension, such as hexane and ethanol, the sorption velocities were higher and less homogeneous in Cotton-1 than in Cotton-2. This is consistent with their porosities (Cotton-1: 84 ± 1%, Cotton-2: 73 ± 1%). The denser structure of Cotton-2 resulted in a narrower void size distribution, leading to slower and more uniform spreading within the fabric. In contrast, water, a liquid with high polarity and surface tension, did not spontaneously wet Cotton-1, as no sorption of water was detected with the tensiometer, implying a contact angle higher than 90°. This indicates a lower hydrophilicity of Cotton-1 vs Cotton-2. The higher apparent contact angle in Cotton-1 is likely due to water interacting more with air trapped in the pores rather than the fabric itself.
A similar sorption behavior was shown for acetonitrile, resulting in a faster sorption velocity for Cotton-2 than Cotton-1 (Table 5). Although acetonitrile has a lower surface tension than water, both liquids have similar polar to dispersive surface tension ratios (Table 3). This similarity in polarity likely explains why both liquids exhibit comparable wettability trends on the cotton fabrics.
These differences in wettability and sorption behavior may explain the variations in thermal desorption efficiency of spiked analytes between the two fabrics. As acetonitrile penetrates deeper into Cotton-2, it interacts more extensively with its cotton fibers than in Cotton-1, where air pockets might inhibit these interactions. Consequently, the desorption of the analytes is more challenging in Cotton-2 due to stronger interactions with the cotton fibers. The same principle probably applies to many native chemicals introduced into the cotton fibers, especially at the dyeing stage of textile production. The results for Cotton-1 and Cotton-2 align with the other investigated cotton textiles. S4 was the fabric with the highest voids and the highest desorption yields among the spiked textiles of 100% cotton (Fig. 4, Figs. S7–12). Optical and electronic microscope images are to be found in Fig. S13.
Quantification methodsIn the “Examination of parameters affecting the ATD-GC/MS analysis” section, the ATD desorption yield from cotton materials was shown to be strongly dependent on the cotton itself, which can have a strong influence on the accuracy of the quantification. It points out the necessity of a quantification method that can compensate for these effects. The quantification with ATD-GC/MS can be performed using two different strategies: (1) using relative response factors (analyte/IS) calculated from the analysis of a spiked cotton material similar to the sample material, an “External Standard Textile Matrix,” analyzed in a desorption tube separate from the sample, and (2) using only the absolute response factor from internal standard (IS) compounds spiked to the sample, and assuming a response similar to that of the analyte. From this point, the terms “Relative Response Method” and “IS Response Method” are used in the following discussions to refer to quantification using methods 1 and 2, respectively.
The “Relative Response Method”The “Relative Response Method” was applied by using Cotton-1 as the “External Standard Textile Matrix,” spiked with the standard references and the IS compounds. This was analyzed with the ATD-GC/MS in separate desorption tubes, and the results were used to calculate response factors for the individual analytes towards an appropriately chosen IS component. The reference and the IS compounds were also added to each sample, S1–S8, and the relative response factors were used for the quantification. The results from this “Relative Response Method” are presented in Fig. 6, showing a selected number of compounds frequently occurring in textile garments.
Fig. 6
Method accuracy for selected textile chemicals in different matrices calculated using the “Relative Response Method” with Cotton-1 as the “External Standard Textile Matrix.” The red dashed line shows 100% method accuracy. Samples, the colored bars from left to right: S1 to S8. S1–S4: 100% cotton, S5–S6: 95% cotton, S7: 75% cotton, and S8: 38% cotton (n = 3)
The “Relative Response Method” demonstrated a good accuracy for most compounds, in most cases around 100%. However, of the selected compounds in the figure, 4-chloroaniline was overestimated with as much as 50 to 75% in samples S1–S3 and S5–S8. The IS used for quantification of this analyte was 3-nitroaniline-d₄. A chemically more similar labelled IS as well as more closely eluting would probably improve the accuracy.
Cotton-2 (also 100% cotton) and 100% polyester, both spiked with reference and IS compounds, were also tested as the “External Standard Textile Matrix” with the “Relative Response Method,” for quantitative analysis of sample S1. In the case of Cotton-2, the influence of the cotton material was revealed. There were now large deviations in the quantifications of the compounds in sample S1 compared to using Cotton-1 as the “External Standard Textile Matrix,” with a strongly decreased accuracy. As an example, there was a decrease in the determined amount of 3,5-dinitrobromobenzene by 60% and for bis(2-ethylhexyl) phthalate by 75% (Fig. 7). The use of the 100% polyester textile as the “External Standard Textile Matrix” was not an option either. In this case, the calculated values were between 25 and 240% of the correct amount. This shows a severe drawback with the “Relative Response Method,” the accuracy depends strongly on finding an “External Standard Textile Matrix,” sufficiently similar to the cotton sample matrix to be analyzed. This would make the method very laborious since each sample has to be classified by ATD-GC/MS analysis. Then, a suitable “External Standard Textile Matrix” must be selected in order to obtain the correct relative response factors for the calculations. Results for the remaining analytes are presented in Figs. S14–19.
Fig. 7
Method accuracy for selected textile chemicals in sample S1 (100% cotton) quantified using the “Relative Response Method” using relative responses analyte/IS from spiked external standard materials (100% polyester, Cotton-1, and Cotton-2). The red dashed line illustrates 100% method accuracy (n = 3)
The “IS Response Method”The quantification calculations in the “IS Response Method” utilize the absolute response factor of the internal standard compound, chemically similar to and closest eluting to the analyte in the chromatogram. Figure 8 shows the quantification results for the same spiked samples and the same selected analytes as for the “Relative Response Method” above. The results are mostly between 75 and 100% of the correct value, i.e., the spiked amount. There was an overestimation between 20 and 70% of the amount of quinoline despite using the corresponding deuterium-labelled IS, quinoline-d7. The reason for this was interference from the m/z 129 ion from nonanoic acid, which was present in various amounts in all eight samples. In two samples, S4 and S8, 6-chloro-2,4-dinitroaniline showed an accuracy of only around 40% to 50%, respectively. The quantification of this compound used the response for 4-nitroaniline-15N2 for the calculations. It is likely that a more similar IS compound, however, not available for the present study, would improve the accuracy. The results demonstrate that the absolute response factors from the used IS corrected the differences in thermal desorption efficiencies. To substantially increase the overall accuracy of this “IS Response Method,” a well-composed mix of IS components should be used. The ideal solution would be to use isotope-labelled internal standards for all analytes. Results for the remaining compounds are found in Figs. S20–25.
Fig. 8
Method accuracy for selected textile chemicals in different textile matrices calculated using the “IS Response Method” (n = 3). Samples from left to right: S1 to S8. Samples from left to right: S1 to S8. S1–S4: 100% cotton, S5–S6: 95% cotton, S7: 75% cotton, and S8: 38% cotton. The red dashed line illustrates 100% accuracy
In summary, when comparing the results for the “Relative Response Method” with the “IS Response Method,” the latter method gives comparably good quantification results while correcting for the different cotton matrices of the samples. Conversely, the former method strongly depends on finding a suitable “External Standard Textile Matrix” to calculate accurate relative response factors. This means substantially more work is needed to identify the character of the cotton sample, find a suitable standard textile, and include several runs with this external standard in an analysis series. In the “IS Response Method,” good statistics for the absolute response factors are obtained, requiring only the results from the samples. n-Eicosane-d42 should be added to each sample as a volumetric standard to control the system’s repeatability.
ATD-GC/MS for cotton analysisATD-GC/MS analysis of textile samples—comparison with solvent extractionTo further evaluate the two quantification strategies applied for the online ATD-GC/MS method, they were compared with solvent extraction combined with offline GC/MS analysis (SE-GC/MS). Four cotton textiles were selected for analysis, Textile-1 to Textile-4 (Table 2). These samples were selected since they contain several compounds frequently found in textiles. All quantitative data are presented in Table S8. In Electronic Supplementary Material, ATD-GC/MS chromatograms of a standard solution on 100% cotton and polyester, respectively, are illustrated in Figs. S26a and b.
In Fig. 9a, the 10log concentrations obtained for the four samples analyzed with online ATD-GC/MS using the “Relative Response Method” for quantification, with Cotton-1 as the “External Standard Textile Matrix,” is plotted against the corresponding results obtained by SE-GC/MS. In Fig. 9b, the same kind of plot is shown but for the “IS Response Method.” As can be seen, both quantification methods for the ATD-GC/MS analysis agree rather well with the corresponding SE-GC/MS analysis. As expected from the results described above, the “Relative Response Method” gave a somewhat higher agreement with the SE-GC/MS method (Slope = 0.99) compared to the “IS Response Method” (Slope = 0.97, Fig. 9b). In both cases, the R2 values were similar.
Fig. 9
a Determined concentrations using SE-GC/MS analysis (x-axis) vs ATD-GC/MS (y-axis) using the “Relative Response Method” (Slope = 0.99, R2 = 0.86, RMSE = 28%, upper diagram). b Determined concentrations using SE-GC/MS analysis (x-axis) and ATD-GC/MS (y-axis) using the “IS Response Method” (Slope = 0.97, R2 = 0.90, RMSE = 24%, lower diagram)
Altogether, the results suggest that using the “IS Response Method” would give sufficient accuracy and precision for samples independent of the investigated cotton fabric. This method would most likely be the best option for large-scale quantitative screenings due to (1) the relatively small differences in method accuracy compared to the use of the “Relative Response Method” on a well-defined matrix and (2) a more straightforward workflow with no need for choosing and evaluating a representative “External Standard Textile Matrix,” and (3) eliminating the need for several external calibrations in between sample runs. Labelled and closely eluting IS compounds are recommended to obtain the maximum accuracy for the “IS Response Method.”
Linearity and detection limitsThe responses for all the tested compounds were found to be linear within the investigated range, i.e., approximately 1 to 100 μg/g textile, with analytes spiked on a 20 mg textile matrix. The correlation coefficients (R2) for cotton for all calibration curves were 0.92 to 0.99. The exception was bis(2-ethylhexyl) phthalate (R2 = 0.85). The deviation for this analyte was found to be due to contamination from the laboratory environment (Table S9).
The instrumental LODs, tested by spiking with amounts close to the detection limits on a textile free from the investigated chemicals, were in the range of 0.1–8 ng for polyester and 0.1–40 ng for cotton. The latter is due to cotton’s lower thermal desorption efficiency compared to polyester. The MDL values for the ATD-GC/MS method using around 20 mg of textile were, for most investigated compounds, well below one µg/g textile. Several of the investigated target analytes were arylamines, for which the MDL was less than 0.030 µg/g textile. The EU REACH regulation allows a maximum level of 30 µg/g textile for individual arylamines, a value more than 100 times higher than the MDL achieved with ATD-GC/MS. Information for the individual analytes is found in Table S10.
Comments (0)