
Remember me
In this section, the different phases of the physicochemical curing reaction are analyzed separately. Three different reaction phases, which take place in different temperature ranges, can be identified. These phases are (i) free solvent evaporation, (ii) polymerization, and (iii) final drying and curing phase. Although the phases show some temporal overlap in the temperature range from 30 °C to 250 °C, they can be separated by analyzing the curve of weight loss over sample temperature as determined by TGA measurements shown in Fig. 3.
Fig. 3
a TGA-measurement data. The top graph shows the mass loss normalized to the total weight loss in the temperature range from 30 °C to 250 °C for two different samples. The two graphs on the bottom show a closer view on the borders between the different process phases. The tangents used to determine the border temperatures are shown as dotted lines in the same color. b DSC data. The top graph shows the power required to heat the sample versus temperature. The bottom graph shows a closer look at the polymerization phase, where also the determined baseline is shown as a dotted line and the resin curing degree is plotted as dashed line in the respective color
In the top graph in Fig. 3a, the sample weight loss is shown as a function of temperature. The weight loss has been normalized to the total weight loss that happens over the whole temperature range to compensate for slightly different sample sizes and weights. In the two shown curves, acquired from the measurements of two individual samples, two distinct changes of the slope can be identified as indicated by the two dashed, vertical lines. The bottom graphs provide a detailed view of the specific segment of the temperature curves in the vicinity of these two characteristic temperatures. The bottom graphs show that both curves have their maximum slope change at very similar temperatures. The mean value of these determined temperatures was chosen as phase transition temperatures, with their standard deviation serving as a means for error estimation. This results in Ton = 95 ± 1 °C and Toff = 147 ± 1 °C, as temperature borders between the process phases. These temperatures are also used as the onset and offset temperatures for the exothermal condensation reaction of the resin used in the evaluation of the DSC data shown in the top graph in Fig. 3b. The DSC curve shows the power required to heat the sample versus the sample temperature and resembles previously reported DSC curves for phenol-resin-impregnated kraft paper [21]. The dotted line shown in the same graph shows the Bézier curve that indicates the baseline during the exothermic polymerization reaction. The bottom graph gives a closer look at the temperature region between Ton and Toff. Therein it can be seen that at these temperatures, the DSC curve starts to significantly deviate from the baseline. The dotted line in the same graph shows the integrated area between the baseline and the DSC curve, normalized to the cumulated heat flow calculated using Eq. (1). This value gives the curing degree of the resin sample and shows similar behavior for both samples, that are in good agreement with previously reported curves for similar resin mixtures [22, 23]. The enthalpy \(\Delta H\) normalized to the sample weight released by the exothermal reaction during the polymerization process is given by the area between the dotted baseline and measured DSC curve. As indicated in the figure, \(\Delta H\) amounts to approximately −60 J/g for both samples.
Phase (i)—free solvent evaporationIn the initial phase taking place temperatures below Ton, the required power for heating continuously increases until it reaches a maximum at approximately 85 °C. Such behavior is typical for heating processes where evaporation with increasing temperature is the dominant heat loss mechanism [24]. This is supported by the fact that the temperature of peak required heating power nicely coincides with the temperature of maximum evaporation of water and methanol as evident by the FTIR-EGA data shown in Fig. 4. Shortly afterwards, the required heating power drops, as the evaporation of these free solvents decreases.
Fig. 4
Left—estimation of the gas evaporation from the sample as a function of temperature as determined by CLS regression. The different gases are given in the legend in the respective graph (top and bottom). Right—measured spectrum (black) and pure gas spectra calculated via CLS for Ton and Toff on the top and bottom, respectively
The NIR absorption spectra recorded from the sample surface in phase (i) are shown in Fig. 5a. Figure 5b shows the first principal component (PC1), that describes almost 95% of the change in the spectra in this first reaction phase, and the inset shows the scores on PC1 as a function of temperature. The spectra in Fig. 5a clearly exhibit a decrease in absorption around 1930 nm. This is also reflected by the high loadings on PC1 at the same wavelength and the continuously decreasing PC1 scores with increasing temperature. This absorption band is attributed to the H–O-H bending and O–H stretching combination mode [25]. Therefore, the reduction in absorption at this wavelength is strong evidence for the evaporation of excess water from the sample, which is also supported by the FTIR-EGA data. Furthermore, significant changes in the NIR absorption spectrum are observed in the wavelength region between 1400 and 1700 nm. An increase in absorption is clearly seen at 1440 nm, which is attributed to the first overtone of O–H stretching, related to hydroxyl groups [26] and is again reflected in PC1, which shows pronounced negative loadings at this wavelength. This increase can be interpreted as an increase in concentration of methylphenols in the sample as excess water and methanol are evaporated, resulting in a more pronounced absorption at this wavelength. This effect might be partly superimposed with the shift of the water absorption band around 1450 nm towards shorter wavelengths in the observed temperature range [27], which, together with the strong water desorption, also contributes to the decrease of the absorption signal between 1500 and 1700 nm. However, the latter effect is mostly contributed to evaporation of methanol from the sample [28], which makes up approximately 10% of the original sample mass. This is also clearly indicated by the FTIR-EGA measurements in this reaction phase. Interestingly, the shape of the decrease in PC1 scores as a function of temperature mimics the decrease in sample mass in the phase as shown in Fig. 3a, further supporting the assumption that in this reaction phase, sample changes are predominantly caused by evaporation of volatile compounds.
Fig. 5
a NIR spectra recorded during phase (i) of the process, color-coded from blue (30 °C) to red (95 °C). b Loadings on the first principal component (PC1), describing almost 95% of the spectral variation in this phase. The inset shows the scores on PC1 as a function of temperature for this process phase
As already mentioned, FTIR-EGA data acquired in phase (i) clearly shows evaporation of water and methanol from the sample. Furthermore, the FTIR-EGA data indicates that formaldehyde, phenol, and formic acid release rates increase as the temperature rises, especially above a temperature of approximately 60 °C. As described in the “Paper-based phenolic laminates” section, the initial PF resin mixture is heated to approximately 60–90 °C for 1–2 h with a subsequent vacuum distillation to remove volatile compounds. As formaldehyde has a boiling point of approximately −19 °C, it would be expected that free formaldehyde in the mixture is completely removed already in this production step. The fact that it is clearly detected in the FTIR-EGA data can be attributed to steric hindrance causing residual formaldehyde in the sample mixture after this initial process step. As the temperature is increased, molecular mobility increases, which can eventually lead to the observed evaporation of formaldehyde from the sample. Another hint towards steric hindrance is the evaporation of phenol, as it would be expected due to the abundance of formaldehyde in the initial mixture that all phenol molecules react with formaldehyde to form methylolphenols. The formic acid is intentionally added to the resin in the production process by the manufacturer. It is not directly involved in the ongoing chemical reaction and therefore also eventually evaporated from the sample as the temperature is increased.
Phase (ii)—polymerizationIn phase (ii), taking place at temperatures between approximately 95 °C and 147 °C, the exothermic condensation reaction of the resin starts, as clearly evident by the DSC measurements. The area between the baseline and the DSC curve in this reaction phase gives an estimation of the heat released by the ongoing condensation reaction, which is around − 60 J/g for both samples.
The NIR absorption spectra recorded during this phase are dominated by a decrease in absorption in the wavelength range between 1450 and 1800 nm, as well as a reduction in absorption above 1950 nm; both changes have already been reported previously [29, 30]. The latter change in the spectra can be attributed to the combination of O–H stretching and deformation modes in the methylol group, which is strong evidence for the ongoing polycondensation reaction. Absorption in the wavelength range between 1450 and 1800 nm can be attributed to C–OH, CHx, and aromatic C-H bonds [31], the observed reduction in absorption in this range is interpreted as methylene bridges being formed between the aromatic rings, as well as the evaporation of phenol and formaldehyde from the sample, as seen in the FTIR-EGA spectra in this reaction phase.
No considerable change in the water absorption band around 1930 nm can be seen in the NIR spectra recorded from the sample surface, as opposed to the spectra acquired in phase (i). This indicates that the water being released by the ongoing condensation reaction is immediately evaporated instead of accumulating in the sample due to the elevated temperatures above the boiling point of water.
As in phase (i), the scores on PC1, which describes over 98% of the total spectral variance, plotted as a function of temperature (inset in Fig. 6a), nicely resemble the weight loss curve in this reaction phase, as shown in Fig. 3a.
Fig. 6
a NIR spectra recorded during phase (ii) of the process, color-coded from blue (95 °C) to red (147 °C). b Loadings on the first principal component (PC1), describing over 98% of the spectral variation in this phase. The inset shows the scores on PC1 as a function of temperature for this process phase
The FTIR-EGA data recorded in phase (ii) indicate that considerable amounts of water are still being released from the sample, explained by the ongoing condensation reaction. As the condensation reaction ends at approximately 147 °C, the amount of water released from the sample decreases significantly, as no more water is produced as a by-product of the resin polymerization process. The evaporation of formaldehyde, phenol, and formic acid all increase in this reaction phase, eventually each reaching their maximum at approximately 128 °C, 133 °C, and 140 °C, respectively. As already briefly discussed above, the delayed evaporation of these substances might be caused by steric hindrance and might be hinting towards a glass transition in the resin happening in this temperature range. Unfortunately, the standard DSC measurements cannot detect the glass transition, since it is superimposed by the much stronger effect of the ongoing exothermal condensation reaction. Additionally, since the glass temperature is strongly dependent on the curation degree of the resin, which continuously changes in this phase, it might not be feasible to define a glass transition temperature in this case.
Phase (iii)—final drying and curingAt temperatures above approximately 147 °C, the exothermic condensation reaction is mostly completed, as the DSC curve again closely follows the baseline, as evident from the top graph in Fig. 3b. The amount of heat required to increase the sample temperature shows a continuous slight decrease in this temperature range, as also the amount of water evaporated from the sample decreases, as visible in the FTIR-EGA data (Fig. 4). The NIR spectra, however, still exhibit a slight decrease in the absorption above 1950 nm, which might hint towards still ongoing polymerization, albeit at a strongly decreased rate (Fig. 7). Due to this slow reaction rate, this reaction might not be evident from the DSC data.
Fig. 7
a NIR spectra recorded during phase (iii) of the process, color-coded from blue (147 °C) to red (250 °C). b Loadings on the first principal component (PC1), describing approximately 91% of the spectral variation in this phase. The inset shows the scores on PC1 as a function of temperature for this process phase
A strong increase in absorbance around 1430 nm and decrease around 1550 nm is also clearly visible in the NIR spectra, which are similar to the changes observed in phase (i). The FTIR-EGA data recorded in this phase show that the water evaporation from the sample decreases, as no more water is produced after the condensation reaction is finished. The small amounts of water that are still detected indicate further drying of the sample. Furthermore, a sharp decrease in the evaporation of phenol, formaldehyde, and formic acid is visible. The reason for this is on the one hand that the concentration of these substances in the sample is exhausted and on the other hand that the polymerized resin causes steric hindrance, prohibiting further evaporation, at least at rates that can clearly be measured with this technique. Significant evaporation of both CO2 and at higher temperatures also CO is evident from the MIR-spectral data, hinting towards thermal degradation of the cured resin. This together with the continued evaporation of water from the sample explains the continued weight loss detected in the TGA data and agrees with literature, where evaporation of CO2 and CO from cured resins have been reported starting at approximately 150 °C and 200 °C, respectively, both in air and N2 atmosphere [32].
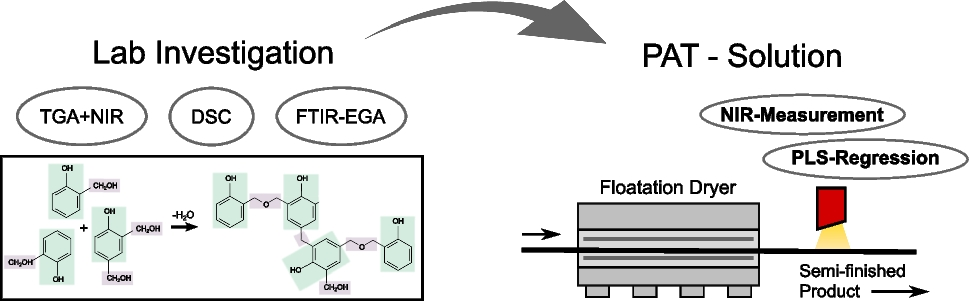
Inline NIR measurementsFrom the laboratory measurements discussed in previous sections, it was concluded that NIR spectroscopy should be a useful tool for the real-time quality control at the production line of the semi-finished phenolic resin laminate. NIR spectroscopy combined with chemometric data analysis techniques has already been widely applied to monitor and control biological [33,34,35,36] as well as chemical reactions [37,38,39,40] including the inline monitoring of resin polymerization processes [30, 41]. It should be noted that Raman spectroscopy is another measurement technique already successfully utilized for monitoring of the curing process of resol PF resins [42]. However, it was found in laboratory measurements (data not shown) that the black dye added to the resol resin investigated herein causes a strong fluorescence signal. This was observed with both 785 nm and 830 nm excitation wavelengths, overshadowing the chemical information encoded in the Raman spectra, rendering it unsuitable for inline process control.
The laboratory measurements discussed above clearly show significant and characteristic changes in the NIR spectra for the different phases of the ongoing polymerization process. Therefore, NIR absorption data of the produced phenolic laminates, should provide useful information on their degree of curing. Thus, the NIR data should nicely correlate with the resin flow and volatile compounds left in the sample (see the “Determination of volatile content” and “Determination of resin flow” sections), which are both routinely measured at the production site for sporadic quality control.
To assess the suitability of NIR spectroscopy as a tool for real-time inline quality control, a dedicated NIR measurement head (details described in the “Inline NIR measurements” section) was installed at the production site after the cooling rolls (see also Fig. 1). At this position, the temperature of the sample is relatively stable at 32 ± 2 °C. This is important to mitigate the influence of temperature effects, such as wavelength shifts of different absorption bands that can influence the output of the chemometric model applied to the NIR spectra.
In a feasibility measurement, approximately 18,500 NIR absorption spectra were collected over the duration of roughly 3 h and 10 min, with some short downtimes of the NIR measurement system in between, caused by software issues. During this timeframe, different operation parameters of the dryer were intentionally changed to provoke changes in the curing degree. This was done to introduce the associated changes in the NIR spectra to test if the curing degree can be derived from the acquired NIR spectral data by chemometric modeling. The dryer parameters changed were air fan speed and air temperature, the heating roller temperature as well as the feeder speed of the paper web. As one would expect, lower temperature and reduction in fan speed result in lower curing degree and thus increased resin flow and volatile content in the sample. Increased heating roller temperature is known to cause slightly higher impregnation degree of the paper, which results in a reduction of curing degree. The last parameter is the paper web speed, which when reduced causes a higher curing degree, due to the longer dwell time of the sample in the dryer. The values of these dryer parameters are plotted as a function of time in Fig. 9a and b.
A total of 11 samples were taken for reference measurements of resin flow and volatile content (see description in the “Determination of volatile content” and “Determination of resin flow” sections, all obtained reference measurements are provided as electronic supplemental material in Table S1). It should be noted that both offline reference measurements are strongly correlated, as they are both means to estimate curing degree. Therefore, it was chosen to model both resin flow and volatile content with a single PLS regression model. For each reference sample, 50 subsequently recorded NIR spectra taken roughly in a timeframe of ± 13 s surrounding the passing of the later measured sample section in front of the NIR sensor were considered as reference spectra. For the volatile content, only the reference measurement of the sample taken from the center was considered, since also the NIR-measurement is positioned in the center of the sheet.
As the laboratory investigation of the PF resin curing using NIR spectroscopy showed no significant spectral features below 1300 nm related to sample curing, it was chosen to consider only the wavelength region from 1300 to 2050 nm for the PLS modeling. The number of latent variables (LVs) for the PLS model was chosen via cross validation (CV), where 11 data splits were performed, each excluding the 50 subsequently recorded NIR spectra corresponding to a single reference measurement. The root mean square error of cross validation (RMSECV), showed a clear minimum with 4 LVs for both reference measurements at approximately 0.44 wt% and 0.19 wt% for the volatile content and resin flow, respectively.
Unsurprisingly, the PLS regression vectors for volatile content and resin flow, shown in Fig. 8a in blue and orange, respectively, are almost identical as they extract very similar information from the NIR spectra. A closer look at the loadings of the two regression vectors reveals a significant positive contribution of the NIR absorption around 1930 nm to both volatile content and resin flow. As discussed in the “Phase (i)—free solvent evaporation” section, where a significant peak in the principal component scores at this wavelength was observed, absorption at this wavelength is attributed to the H–O-H bending and O–H stretching combination mode and is strongly correlated to the amount of water present in the sample. Since more residual water directly leads to higher values for volatile content and resin flow, positive loadings at this wavelength are expected for both regression vectors. Absorption between 1570 and 1730 nm also contributes positively to the predicted values as evident from the positive loadings on the regression vectors in this region. This is in good agreement with the laboratory measurements, where positive contributions in this wavelength range have been observed in the loadings of the first principal components. As discussed above, changes in this wavelength region are attributed to methylene bridges being formed between the aromatic rings, as well as the evaporation of methanol, phenol, and formaldehyde from the sample (see the “Phase (i)—free solvent evaporation” and “Phase (ii) of the drying and curing process” sections). Negative loadings on the regression vectors can be seen between 1400 and 1500 nm, which is consistent with the observations made from the principal components in the “Phase (i)—free solvent evaporation” and “Phase (iii) of the drying and curing process” sections. Negative loadings are also visible in the regression vectors around 1800 nm. Similar negative changes in absorption close to 1800 nm were observed in the laboratory measurements in phase (iii). This, combined with the negative loadings in both regression vectors, suggests that changes in the sample occurring in phase (iii) of the ongoing process (see the “Phase (iii) of the drying and curing process” section) have a significant influence on volatile content and resin flow of the product in the industrial production environment.
Fig. 8
a PLS regression vectors for volatile content (blue) and resin flow (orange). b, c PLS prediction vs. offline reference measurement for volatile sample content and resin flow, respectively. The error bars show the standard deviation of the PLS predictions calculated for 50 subsequently recorded NIR spectra
Figure 8b and c show the values calculated from the NIR data using the PLS model vs. the values determined via the corresponding offline reference measurements. These plots show that the standard deviation of the predicted value for the 50 subsequently recorded spectra, indicated by the error bars, is of a similar relative magnitude for both reference measurement methods and amounts to approximately 4% of the respective measurement range. However, the overall fit of the mean predicted values fits visibly better for the volatile content. This is explained by the variation in curing degree across the width of the produced phenolic laminate. While the volatile content is measured in the center of the product, roughly at the position of the NIR measurement spot, the measurement of the resin flow only gives the average value over the entire width of the sample.
The calibrated PLS model allows to evaluate volatile content and resin flow as a function of time, which is depicted at the bottom in Fig. 9 with the same time axis as the different dryer parameters shown in the graph above. The blue and orange areas mark the acceptable ranges for volatile content and resin flow of 6.2 wt%–6.8 wt% and 0.6 wt%–1.0 wt%, respectively. In the beginning both reference measurements are mostly inside the desired range. One exception is the measurement of the volatile content for the second reference measurement, which is only 5.8 wt% and thus slightly too low. The resin flow on the other hand is still within spec, hinting towards differences in curing degree across the sample width. In fact, the measurements of the volatile content at the edges of the sample are higher with values of 6.2 wt% and 5.9 wt%.
Fig. 9
Top—The four dryer parameters intentionally altered during the feasibility NIR measurement at the production plant of the paper-based PF resin laminates as a function of time. Bottom—PLS predictions calculated from the NIR spectra acquired at the production plant of volatile content (blue) and rein flow (orange) as a function of time. The blue and orange areas in the graph correspond to the in-spec ranges for the volatile content and resin flow, respectively. The black circles represent the results of the offline reference measurements taken at the production plant
After the dryer temperature and fan speed were decreased and the heating roller temperature increased, both volatile content and resin flow rose significantly, which is also nicely reflected in the PLS predictions for both values. Interestingly, the fourth reference measurement is still in-spec for the resin flow, but already out of spec when it comes to volatile content. In the PLS prediction also the resin flow value is out-of-spec at the time of the measurement, which could again be caused by curing degree inhomogeneity across the width of the sample. As expected, further decrease in dryer temperature and increase in heating roller temperature continues the upwards trend of volatile content and resin flow, both in the PLS predictions and offline reference measurements.
After the reduction of heating roller temperature and increase in dryer temperature around 10:50, the curing degree at the end of the dryer slowly increases again before reaching in-spec values according to the PLS prediction shortly after the seventh reference measurement was taken. In-spec values are also measured for the eighth reference sample, which agrees with the inline NIR measurements.
Around 11:40, the dryer temperature and air flow were increased, while sample speed was reduced to provoke a higher curing degree. This heightened curing degree is nicely visible in both the inline NIR and the offline reference data taken thereafter. Around 12:13, both sample speed and dryer temperature were reset to usual values for the product to return to in-spec production. This leads to a sharp increase in the predicted value for volatile content and resin flow in the PLS predictions, which is later confirmed by the delayed offline reference measurement.
Overall, a very good agreement of PLS predictions and offline reference measurements is achieved. The PLS predictions in Fig. 9 nicely demonstrate the quick response time of the NIR measurement which provides much better insight into the ongoing changes in curing degree upon change of the drying parameters. This can be exploited for better process control and energy savings, as trends can be tightly monitored and dryer settings can be set accordingly in real time to produce high-quality products with the desired curing degree, while using only the minimum required heat energy.
Comments (0)