
Remember me


The first aim was to assess if neutrophils in DADA2 patients present a NETosis dysregulation.
To this end we modified a quantitative method [26], based on IFC, that simultaneously assess both “suicidal” and “vital” NETosis. An example of analysis template is shown in Supplementary Fig. 1.
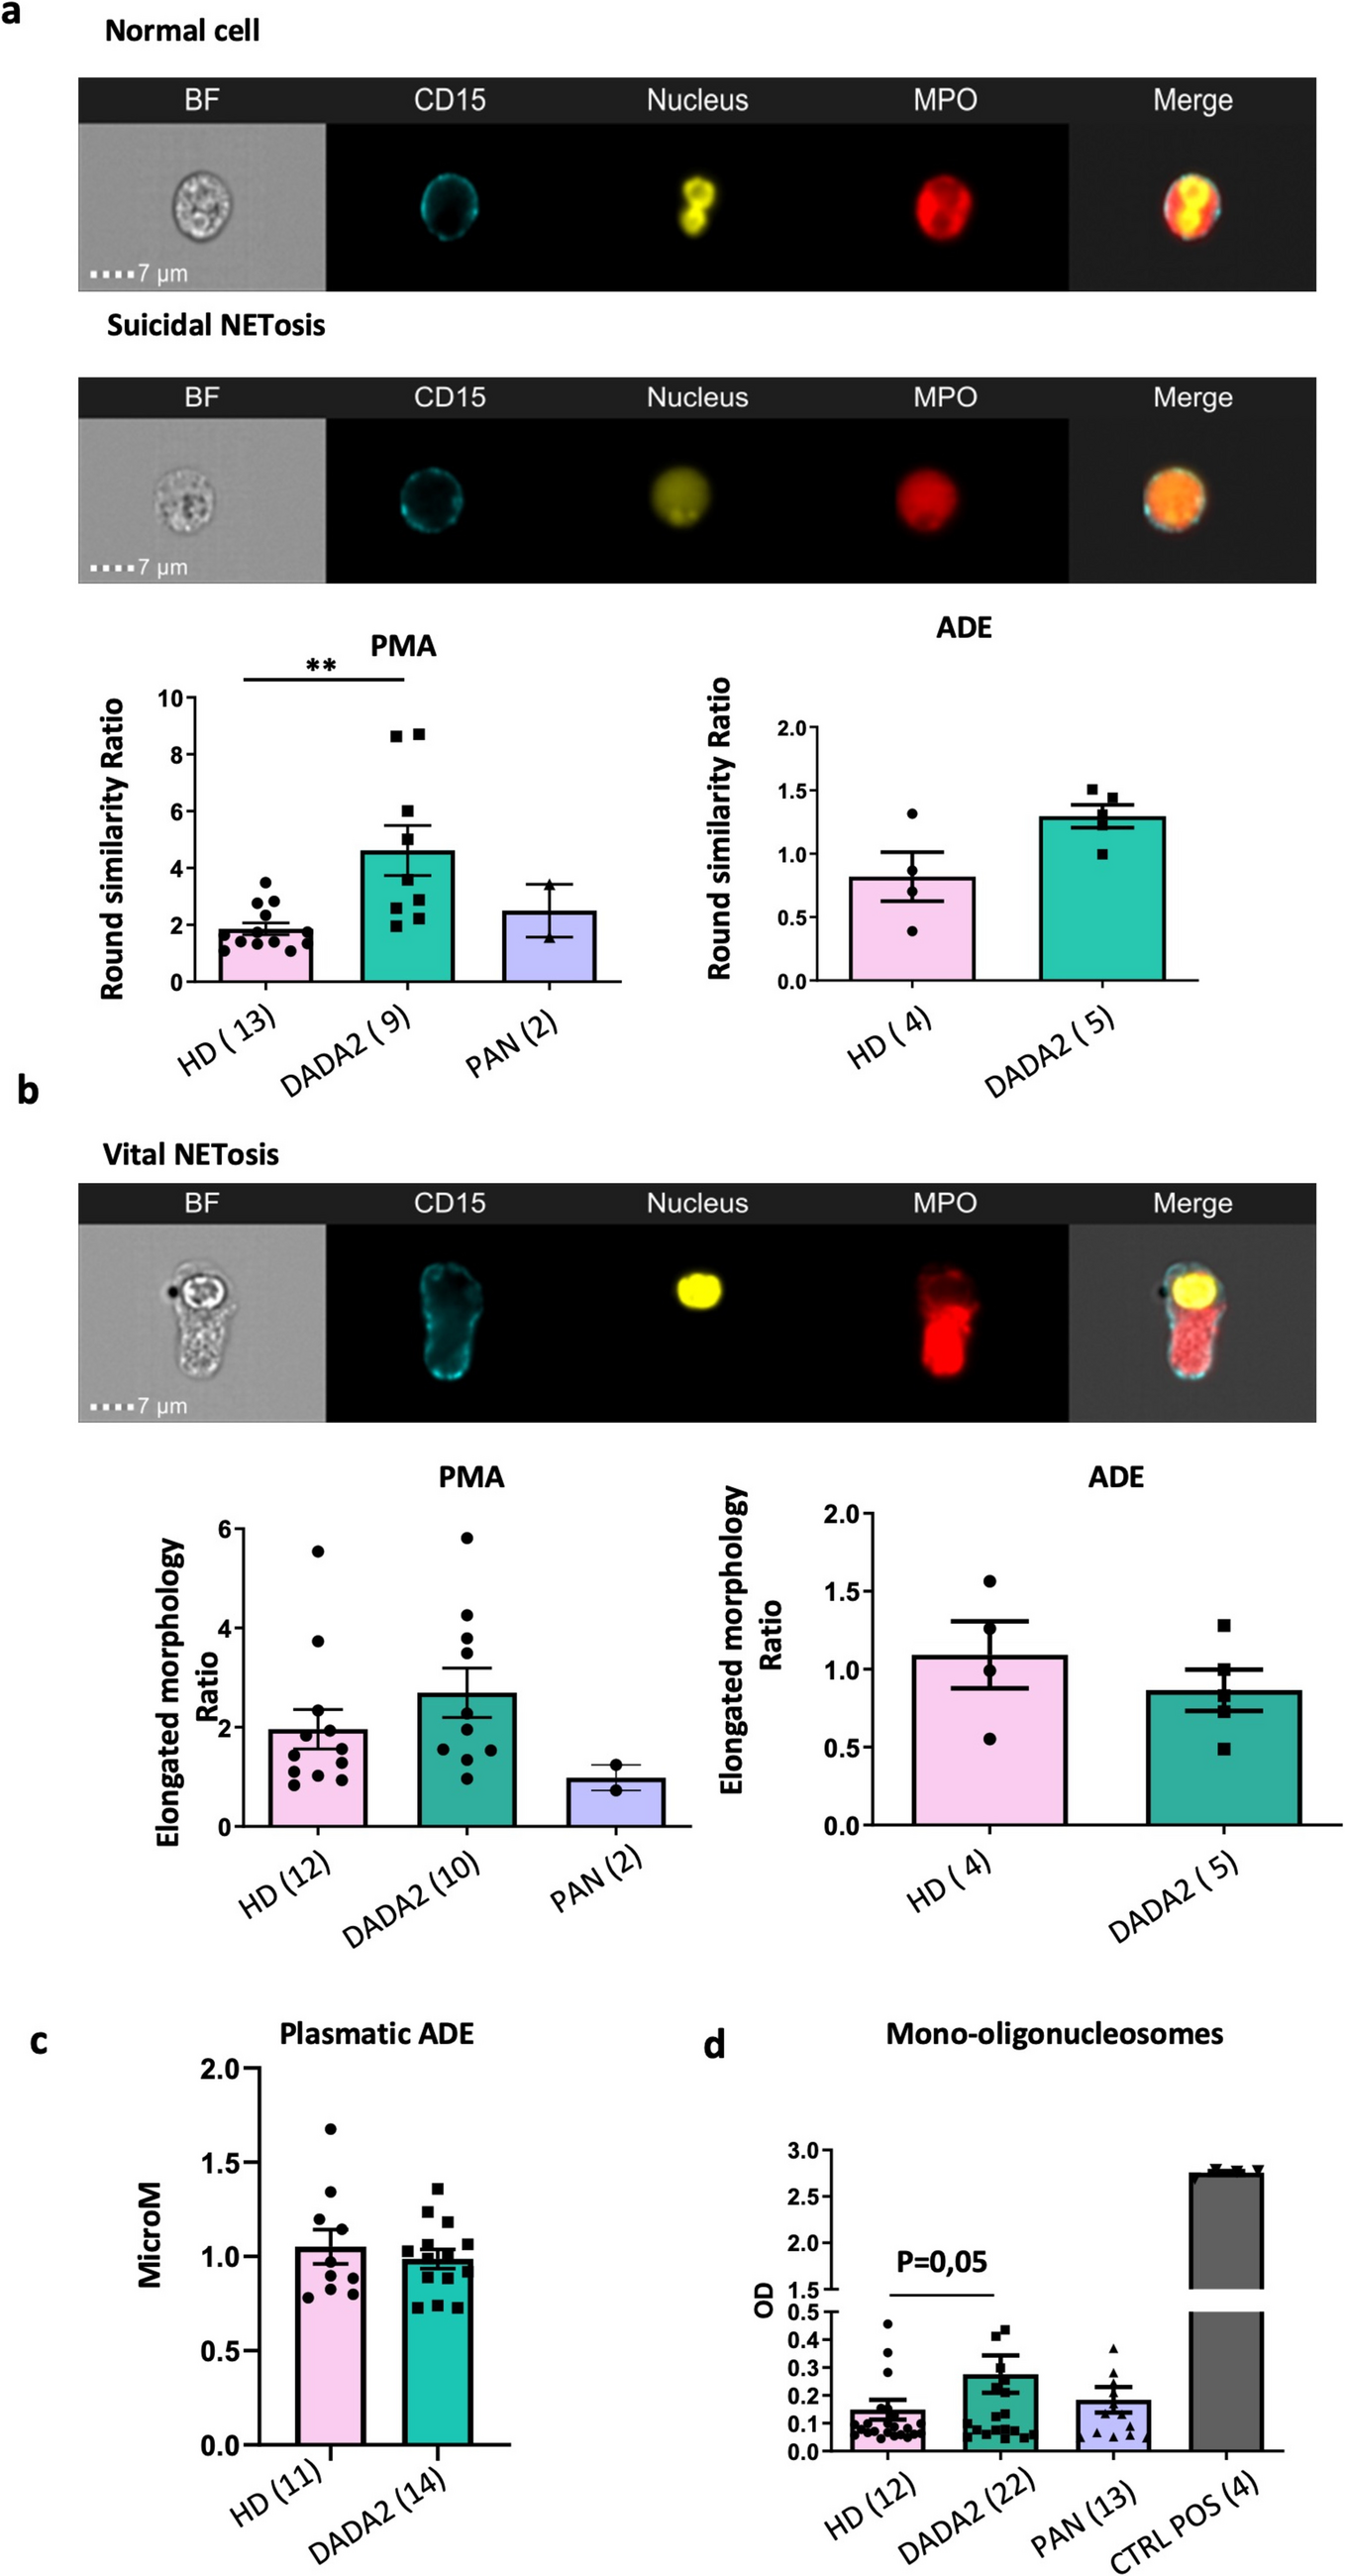
Suicidal NETotic cells were characterized as spherical, decondensed, with colocalization of myeloperoxidase (MPO) and nucleus. Vital NETotic cells were characterized by elongated morphology with nucleus condensed and polarized (Fig. 1A, B). The frequency of suicidal NETotic neutrophils stimulated with Phorbol 12-myristate 13-acetate (PMA) was significantly increased in DADA2 patients in comparison with HDs and PAN patients. Conversely the stimulation with Adenosine had a slight effect of induction of suicidal NETosis (Fig. 1A). Moreover PMA stimulated neutrophils from DADA2, showed a trend toward an increased “vital” NETosis, although not significant, again with no effect after ADE stimulation (Fig. 1B).
Fig. 1
DADA2 neutrophils show significant exacerbated NETosis. A Representative image of a normal and NETotic neutrophil analyzed by IFC. Lower Panel: statistical analysis of cells undergoing suicidal NETosis, represented as Round Similarity Ratio between positive cells in unstimulated and PMA/ADE stimulated samples. B Representative image of a vital NETotic neutrophil after PMA/ADE stimulation analyzed by IFC. Lower Panel: statistical analysis of cells undergoing suicidal NETosis, represented as Elongated morphology Ratio between positive cells in unstimulated and PMA/ADE stimulated samples. C Quantification of plasmatic Adenosine, D Histone-associated-DNA-fragments in DADA2 patients, HDs and PAN patients. Bar plots represent means ± SEM. Significant differences (Mann–Whitney test) are indicated. *P <.05, **P <.01, *** P <.005
Indeed we quantified plasmatic Adenosine in DADA2 and HDs and the level was comparable (Fig. 1C). This does not exclude that in the interstitial fluid at the tissue level there may be an accumulation of adenosine that can stimulate neutrophils in the tissue.
To confirm the significant increased NETosis in DADA2 patients we quantified histone-associated-DNA-fragments (mono-and oligonucleosomes), so called NET remnants, by ELISA assay showing a trend toward higher levels in plasma of DADA2 patients (P = 0.05), when compared to HDs and PAN patients (Fig. 1D).
DADA2 and PAN Patients Display a Defective DNAse Activity and Increased ROS ProductionSince a dysregulated NETosis process can be caused by an enhanced formation of NETs but also by decreased clearance of NETs, we hypothesized that NETs removal mechanisms could be defective in DADA2 patients. The digestion of circulating DNA and of NET-associated DNA is primarily facilitated by DNASE1 and DNASE1L3, which are dedicated to this function [36]. Therefore plasma levels of both enzymes were tested and as shown in Fig. 2A DNASE1 in DADA2 was comparable to normal samples. DNASE1L3 levels in normal donors were generally absent whereas a substantial quantity of circulating enzyme, was present in a significant frequency (60%) of DADA2 samples when compared to HDs/PAN (Fig. 2B). When we measured the plasmatic DNase activity, we found a significant reduced activity in both DADA2 and, to lesser extent, in PAN, when compared to HDs (Fig. 2C).
Fig. 2
Dysregulation in NETs removal mechanisms in DADA2 patients and ROS production is increased DADA2 neutrophils. A Determination of plasmatic Dnase1 in HD, DADA2 and PAN patients. B Determination of DNASE1L3 in HD, DADA2 and PAN plasma patients and frequency of positivity by Fisher test. C DNAse activity in HD, DADA2 and PAN. D MA plot displaying same samples PAN (purple dots), DADA2 (green dots) and HD (pink dots) analyzed for DNase activity with or without protein A sepharose: outlier data beyond the two red lines have a significant variation. (Non-parametric test Friedman for paired data). E Percentage of DHR-123 + positivity gated on cells SSC high/FSC high/; data analyzed by DIVA software and Prism. showing median and range of 30 independent donors, 9 DADA2 and 2 PAN patients
As shown in Fig. 2D DNAse activity was restored by protein A, suggesting the presence of circulating DNAse inhibitors, that were removed by this protein; this finding rise the hypothesis that the impaired NET degradation in DADA2 could be secondary to a decreased DNase activity due to the presence of a circulating DNase inhibitor.
Suicidal NETosis event [37] is mediated by PAD-4 and promoted by ROS [38], therefore we quantified ROS production and, as expected, it was significantly increased in DADA2 neutrophils (Fig. 2E).
Proteome Profile Shows Peculiar Signature in DADA2 NETs Compared to HD/PAN NETs and Gene Ontology Biological Processes (GOBP) Analysis Highlighted Distinct Pathways and Biological Processes in DADA2Proteome profile has been analyzed after purification of NETs spontaneously induced (NT) from neutrophils or after separate stimulation with PMA, ADE and TNFα from 7 HDs, 7 PAN and 6 DADA2 patients. A total of 1356 proteins were identified, 986 (72.7%) of which were present in the three clinical groups. Only 26 (1.9%), 61(4.4%) and 53 (3.9%) proteins were exclusively found in the HD, PAN and DADA2 samples, respectively (Fig. 3A). Considering the different stimulations, mimicking the inflammatory environment, we identified in DADA2 NETs 827 (NT), 664 (PMA), 795 (ADE) and 780 (TNFα) proteins found in at least 70% of samples of each group. 540 (54.8%) of which were present in all stimuli. Only 43 (4.4%), 28 (2.8%), 29 (2.9%) and 42 (4.3%) proteins were exclusively found in DADA2 NETs from neutrophils untreated (NT), stimulated with PMA, ADE and TNFα respectively (Fig. 3A).
Fig. 3
Analysis of NETs proteins in DADA2, PAN and HDs: VENN Principal component Analysis (PCA) plot, GO Enrichment of biologically relevant pathways significantly modulated in DADA2 and PAN with respect to control groups. A The VENN diagram in the left panel shows the number of identified common and exclusive NET proteins between DADA2, PAN and HDs groups. The VENN diagram in right panel shows NET proteins of DADA2 patients, present at least at 70% in each group, shared or specific for one treatment: NT (untreated), PMA, TNFα, ADE. B Principal component Analysis (PCA) plot shows separation among different biological groups on the basis of NET proteins expression profiles. The percentage of the total variation accounted for the first and second component is shown on the x and y axes, respectively. Green crosses, purple squares, and pink circles refer to DADA2, PAN and HD samples respectively. DADA2 and PAN/HD groups form two well separated clusters on Principal Component 1 (PC1). PAN and HD partially cluster on PC2. C Heatmap representation shows unsupervised hierarchical clustering analysis of significant NET proteins differentially expressed between DADA2, PAN and HDs groups, identified by ANOVA test (S0 = 0.1 and FDR = 0.05) in untreated (NT) conditions. In the heatmap, each row represents a protein and each column corresponds to a sample. Normalized Z-score protein expression levels are indicated by a two-color scale ranging from blue (lowest values) to red (highest values) reported in the horizontal bar at the right of the panel. The purple, pink and green bars below the columns distinguish the PAN, HD and DADA2 group respectively. The tree dendrogram at the top of the plot displays the results of the unsupervised hierarchical clustering analysis, placing similar sample/proteome profile values next to each other. The optimal association between the main clusters of NETs proteins identified (indicated by the coloured bars on the left side) and DADA2, PAN and HD groups of samples are shown. D Heatmap representation after PMA stimulation. E Pathway enrichment analyses and network of the protein clusters #296 (NET proteins significantly upregulated in NT neutrophils of DADA2 group respect to PAN/HD groups) of the heat map shown in panel C. Functional enrichment analysis for GO biological processes were conducted by ShinyGO, and enriched pathways were considered significant if FDR value ≤ 0.05. The graph shows the top enriched terms. F Pathway enrichment analyses of the protein cluster #290 (NET proteins significantly down regulated in NT neutrophils of PAN group respect to DADA2/HD groups) of the heatmap shown in panel C. Functional interaction networks refer to “neg. regulation of blood coagulation”, pathway of cluster #290 enrichment
Despite considerable overlapping of protein identity between the three clinical groups and four stimuli, principal component analysis with respect to Component 1 evidenced clear discrimination of two clusters consisting of all DADA2 samples and the other one from the whole of all HDs and PAN samples (Fig. 3B).
Specific protein expression pattern differences in NETs specimens from DADA2 patients were identified by ANOVA test; the expression profile after Z-score normalization of 300 statistically significant proteins in NT (Fig. 3C, Suppl. Table 4) and 278 in PMA (Fig. 3D, Suppl. Table 5) is reported in heatmap diagrams.
Independently of stimulus NET protein expression pattern differs between DADA2, PAN and HDs: in fact we identified the main clusters of proteins whose expression was significantly (FDR < 0.05) upregulated or downregulated with respect to HD/PAN.
A selection of the canonical pathways most significantly associated with the differentially expressed proteins were identified by GOBP analysis.
In the heatmap depicting the proteins significantly modulated by ANOVA test between DADA2/PAN/HD NT, three clusters were highlighted: #296 of the proteins upregulated in DADA2 NETs compared to the other 2 groups, #293 of the proteins downregulated in DADA2 NETs compared to the other 2 groups and #290 of the proteins downregulated in PAN NETs compared to the other 2 groups. One pathway enriched in cluster #296 and highly significant (FDR = 2,7E-14), including 27 proteins was “Myeloid cell activation involved in immune response”. They include MNDA (myeloid cell nuclear differentiation antigen), IFI35 (interferon-induced protein 35) and PECAM-1 (Platelet endothelial cell adhesion molecule-1) (Fig. 3E).
The same proteins associated to this pathway have been found significantly upregulated in DADA2 NETs with PMA stimulation in clusters #272 (Fig. 3D) and with TNFα stimulation in cluster #196 (Fig. 4A).
Fig. 4
Hierarchical Clustering, GO Enrichment of biologically relevant pathways upregulated in DADA2 with respect to control groups with TNFα and ADE stimulation. A In the left panel the heatmap representation shows unsupervised hierarchical clustering analysis of significant NET proteins differentially expressed between DADA2, PAN and HD groups, identified by ANOVA test (S0 = 0.1 and FDR = 0.05) after TNF stimulation. In the right panel is shown the pathway enrichment analyses of the protein cluster #196 (NET proteins of TNF stimulated neutrophils upregulated in DADA2 respect to HD/PAN). Functional interaction network refers to the “cellular response to cytokine stimulus” pathway of cluster #196 enrichment is shown. B In the left panel the heatmap representation shows unsupervised hierarchical clustering analysis of significant NET proteins differentially expressed between DADA2, PAN and HD groups, identified by ANOVA test (S0 = 0.1 and FDR = 0.05) after ADE stimulation. In the right panel is shown the pathway enrichment analyses of the protein cluster #289 (NET proteins of ADE stimulated neutrophils upregulated in DADA2 respect to HD/PAN). Functional interaction network refer to the “Reg. of cysteine-type endopeptidase activity involved in apoptotic processes” pathway of cluster #289 enrichment. In the right panel the biological processes identified in NETs generated after ADE stimulation is shown
Two pathways enriched in cluster #293 of downregulated proteins in DADA2 NETs, (NT heatmap) and enriched also in cluster #273 of proteins downregulated in DADA2 (PMA heatmap) are “Neutrophil degranulation” and “Neutrophil activation” which include proteins involved in Glucose metabolism. These signatures emerged also in co-expression networks analysis (Fig. 5B, C).
Fig. 5
Differentially correlated functional modules extracted by processing the protein expression profiles from DADA2 NETs (vs HD NETs and vs PAN NETs).For each comparison, the most relevant terms (FDR < 0.05) are shown. Connected terms share at least 60% of their genes. A Gene Ontology (GO) Biological Processes. B REACTOME pathways identified by comparing DADA2 NETs vs HD NETs and PAN NETs conditions. C Differentially correlated pathways by comparing samples treated with PMA, TNF or ADE (vs NT) are shown; specifically, in red are highlighted pathways up correlated in PMA, TNF or ADE, while in blue are highlighted those most correlated in NT (FDR < 0.05). D Best ten-ranked hubs/bottlenecks in HD NETs, DADA2 NETs and PAN NETs. Hubs/bottlenecks were selected based on betweenness, centroid and bridging centralities
This is probably strictly interconnected with suicidal NETosis because a metabolic shift toward Pentose Phosphate Pathway (PPP) is necessary for NET release [39].
Because the DADA2 patients are on etanercept therapy, we performed an experiment on 3 JIA patients on the same treatment to verify that there was no treatment effect, and Suppl. Figure 2 show that proteins belonging to clusters #296, #272, #196 were not found in the JIA NETs and therefore are not a treatment effect. In previous works [40] the PTMs highlighted modifications of NETs proteins linked to an immunogenic function. So we estimated the percentage of all modifications present in DADA2 NETs versus normal or disease control NETs. In Suppl. Figure 3 the heatmap shows an altered trend in phosphoproteins, but a detailed deep analysis on phosphoproteins results not significant. We identified also the pathways, enriched in the cluster #293 of significantly downregulated proteins in DADA2 NT versus other groups, concerning actin polymerization and depolymerization (Suppl. Table 4); WAS (Wiskott Aldrich syndrome protein) and ARPC1B (Actin related protein 2/3 complex subunit 1 B) belong to this pathway but they have been founded also downregulated in therapy controls JIA NETs (Suppl. Figure 2). This means that these pathways downmodulated could be due to the therapy or to the NETs extrusion process.
If we focus on PAN NETs compared to the other groups, in unstimulated condition, (Fig. 3C), in PMA condition (Fig. 3D), in TNFα condition (Fig. 4A) and in ADE condition (Fig. 4B) significant down-regulated proteins were identified by ANOVA test (Suppl. Table 4, 5, 6, 7). In particular in clusters #290 (Fig. 3C, F), #274 (Fig. 3D), #194 and #288 (Supplementary Fig. 4), the pathways “fibrinolysis” (FDR = 7,29E-12) “negative regulation of blood coagulation” (FDR = 4,32E-14) and “negative regulation of hemostasis” (FDR = 2,07E-13) were enriched. They include down-modulated proteins in PAN NETs PROS1 (Vitamin K-dependent protein S), VTN (vitronectin), FGG, FGA, FGB (Fibrinogen γ α β chains). Other factors are SERPING1 (Plasma Protease C1 Inhibitor), a negative regulator of blood coagulation, whose deficiency leads to a thrombotic effect [41] HRG (Histidine-rich glycoprotein) [42] and A2M (Alfa-2–macroglobulin) that can be seen as both anti- and pro-hemostatic [43] involved in maintaining vascular homeostasis.
TNFα and ADE Stimulate DADA2 Neutrophils to Produce NETs with Specific Proteins Associated with Peculiar PathwaysTNFα is crucial for inflammation in DADA2: for mimicking the inflammatory environment we stimulated neutrophils with TNFα and evaluated NETs proteins: when comparing DADA2 NETs versus HD/PAN NETs by ANOVA test we found a cluster #196 of proteins significantly up regulated in DADA2 respect to the other two groups represented in the heatmap in Fig. 4A (Suppl. Table 6), in which the pathways “cytokine mediated signaling pathway” (FDR = 5,87E-06) and “cellular response to cytokine stimulus” (FDR = 1,51E-06) were enriched. Among the proteins stands out STAT1 (Signal transducer and activator of transcription 1), interferon stimulated genes IFI35 and IFIT3 (interferon induced protein with tetratricopeptide repeats 3).
The absence of ADA2 activity leads to an accumulation of ADE in patients’ plasma; we therefore treated in vitro neutrophils with ADE. By comparing DADA2 NETs treated with ADE versus other two groups, ANOVA test identified cluster #289 of upregulated proteins in DADA2 (heatmap in Fig. 4B and Suppl. Table 7), in which the pathway “regulation of cysteine-type endopeptidase involved in apoptotic processes” (FDR = 4,27E-06) is enriched. CASP8 (Caspase-8), NLRC4 (NLR family CARD domain-containing protein4), HMGB1 (high mobility group box 1) are associated to this pathway.
Co-Expression Networks Highlight Biological Processes in DADA2 NETsFollowing the merging of PPI and co-expression network models, we identified biological processes and pathways whose global correlation significantly changed in pairwise comparisons (Suppl. Table 8–9). In DADA2 NETs (vs HD), we observed an increased correlation of Actin cytoskeleton-related processes, including actin nucleation, actin2/3 complex-mediated actin nucleation and actin polymerization-dependent cell motility (Fig. 5A). Of note, the same processes were also most correlated in DADA2 NETs vs PAN NETs.
As for REACTOME (Fig. 5B), significant correlated pathways in DADA2 NETs included Neutrophil Degranulation [44], the Pentose Phosphate Pathway [45] (PPP), the Negative regulation of NOTCH4 signaling and the Tumor necrosis factor receptor 2 (TNFR2) non-canonical NF-kB pathway [46]. They were most correlated in DADA2 NETs in comparison to both HD/PAN. In this scenario, the PPP was further extracted as most correlated in PMA and TNFα-treated samples compared to NT, whereas it was down correlated in ADE compared to NT. This supports the hypothesis that the PPP could serve as a link between the absence/presence of ADE and the formation of NETs [39] Finally, glycolysis was found to be more correlated in ADE samples (vs NT) and less correlated in TNFα samples (vs NT), while cori cycle less correlated in those TNFα and ADE treated (Fig. 5C).
With the purposes to identify relevant proteins underlying the investigated phenotypes, in addition to protein quantitation, we processed the HD/DADA2 and PAN NETs weighted network models for extracting topological relevant nodes (Suppl. Table 10). Among the ten best ranked hubs/bottlenecks per condition, in DADA2 vs PAN NETs we noted the presence of different heat shock proteins (Hsp). In particular, DnaJ Hsp Family Member A1 (DNAJA1), Hsp90 Alpha Family Class B Member 1 (HSP90 AB1) and Hsp Family A Member 5 (HSPA5) were found in DADA2, while Hsp Family A Member 9 (HSPA9), and Hsp90 Alpha Family Class A Member 1 (HSP90 AA1) were in PAN. Of note, DADA2 was characterized also by the presence of Superoxide Dismutase 1 (SOD1) [47] and Interferon Gamma Inducible Protein 16 (IFI16) [48]. FGG, FGA, FGB are hub genes in PAN NETs, confirming proteomic data (Fig. 5D).
MODCs from DADA2 Patients Differentiate Normally, but PMA Induced NETs from DADA2 Induce Release of pro-Inflammatory Cytokines in DADA2 MODCsFrom previous paper [9] it is known that NETs stimulate macrophages to secrete TNFα; in the present study we unravelled as upregulated in DADA2 NETs several proteins belonging pathways such as myeloid cell activation. Dendritic cells are professional component of myeloid cells that orchestrate immune reactions and, when activated secrete various cytokines. So we wondered if cDCs and pDCs were normally distributed in DADA2 patients and if NETs can have a direct effect on the MODCs maturation and cytokines secretion. DADA2 patients have a normal distribution of cDCs and pDCs in peripheral blood: in Fig. 6A the percentage and absolute numbers of respectively 10 and 9 DADA2 patients are shown. The in vitro differentiation of MODCs from DADA2 patients did not differ from HDs: in fact the percentage of MODCs obtained is 60% in both HDs and DADA2 patients (data not shown) and the expression of the activation and maturation markers CD80, CD83, CD86 and HLADR was comparable as also the effect of DADA2 or HD NETs (Fig. 6B).
Fig. 6
Distribution of conventional dendritic cells (cDCs) and plasmacytoid DCs (pDCs) in DADA2 patients and effect of DADA2 NETs on maturation and cytokines secretion from MODCs. A Frequency and absolute count of cDCs (upper panel) and pDCs (lower panel), gated on lympho-monocytes. B Expression of activation and maturation markers in MODCs: CD80, CD83, CD86, HLADR. C In vitro production of pro-inflammatory cytokines by MODCs from HDs (blank bars) and DADA2 patients (green bar) stimulated with normal NETs or DADA2 patients derived NETs. D In vitro production of pro-inflammatory cytokines by MODCs from DADA2 patients stimulated with autologous DADA2 NETs or in presence of DNASE1/hrecADA2 or stimulated with PAN NETs. Data shown represent means ± SEMs. Significant differences (Unpaired t test) are indicated. *P <.05, **P <.01, *** P <.005
MODCs from DADA2 patients showed a decreased, although not significant, spontaneous secretion of pro-inflammatory cytokines TNFα, IL6 and IP-10 when compared to MODCs from HDs. This event could be depend on the effect of the in vivo treatment Interestingly the incubation with PMA induced DADA2 NETs, but not HD neither PAN NETs, affected DADA2 MODCs, but not HD MODCs, to significantly upregulate the secretion of TNFα and IL-6. On the other hand, both DADA2 NETs and HD NETs induced a significant upregulation of IP-10 secretion by both DADA2 and HD MODCs (Fig. 6C-D). The production was inhibited by DNAse1 and human recombinant ADA2 to signify a disease-specific NETs effect.
Comments (0)