
Remember me


Sixty-six (91.7%) patients received a genetic diagnosis (Table S1), most diagnosed using fluorescence in situ hybridization (FISH) analysis, while some underwent multiplex ligation-dependent probe amplification and microarray analysis. No deletion was detected in four patients by FISH analysis. Another patient with no deletion by FISH analysis showed a 22q11.2 deletion by microarray. Genetic studies were not present in two patients.
Demographical CharacteristicsThree patients (P33, P38, P49) (Supplementary appendix) had DGS with congenital athymia, and 69 had DGS. The M/F ratio was 41/31 (1.3). The median age at diagnosis was 1.7 years (0 days −22 years). The follow-up period was 21.7 months (0 days-17.3 years), the diagnostic delay was 12 months (0 days −17 years), and the age of symptom onset was 18.2 days (0 day-10 years) (Table S1). During the follow-up period, six patients (8.3%) died.
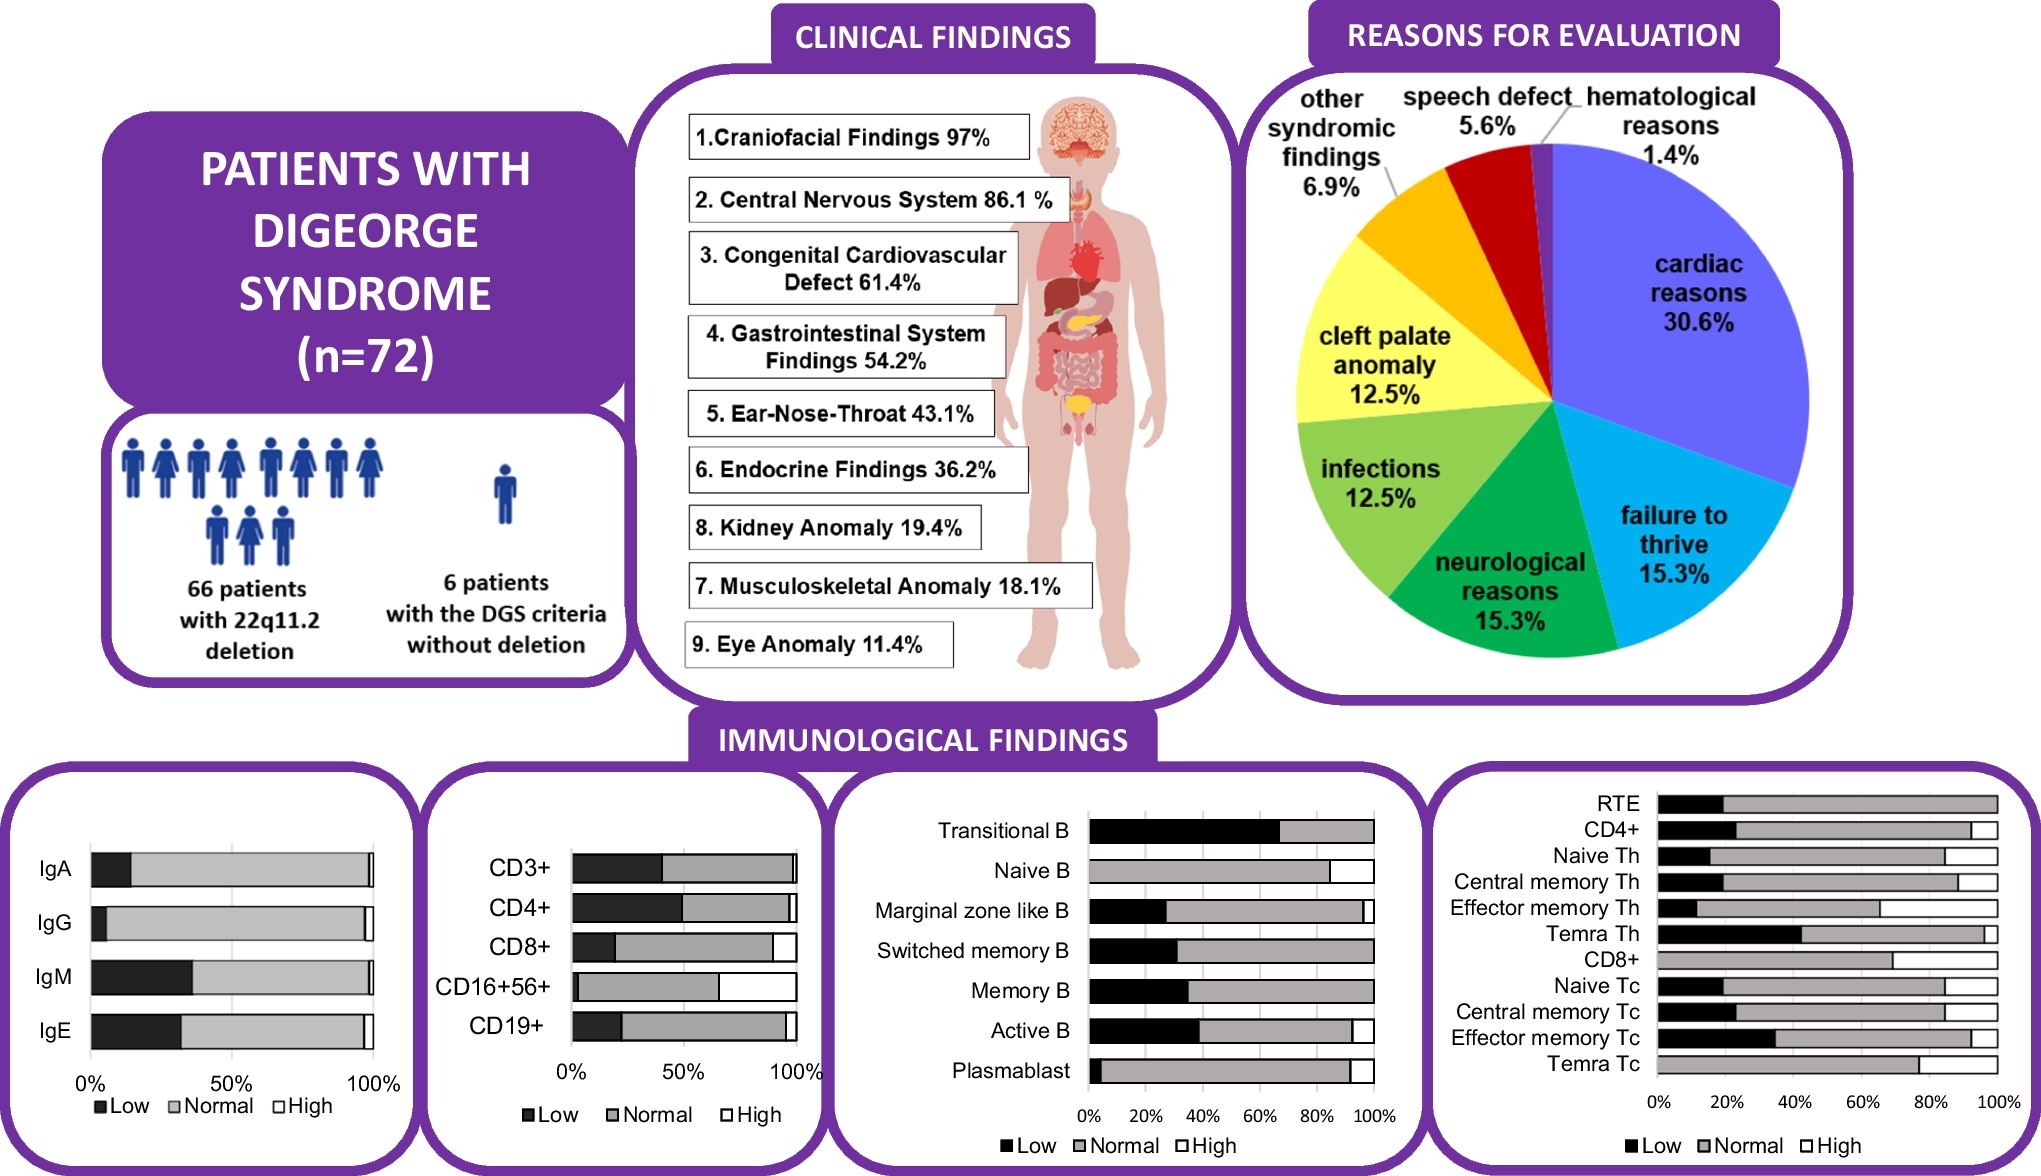
Clinical FindingsWe present the clinical findings in Tables 1-S1, Figure S2, Figure S3, and Suppl. appendix. Commonly prompting the first visit to the hospital were cardiac reasons (30.6%, murmur, cutis marmoratus, etc.), neurological reasons (15.3%, seizure, intellectual disability, etc.), and failure to thrive (15.3%) (Figure S2A). Craniofacial and neuropsychiatric features account for approximately 97% and 86.1%, respectively. Patient’s 75.7% (53/70) of the patients had developmental delays, 65.7% (44/67) had special education status, 39.4% (28/71) had seizures, 52.4% (11/21) had central nervous system malformation, and 10 had attention deficit hyperactivity disorder (ADHD). Among the 28 patients with seizures, 11 also presented with hypocalcemia. Of the patients with seizures, 26 had electroencephalograms (EEG), and eight had revealed pathological findings, including epileptic activity, dysrhythmia, baseline disorders, or baseline wave slowing. Additionally, 14 out of the 28 patients (50%) were on antiepileptic drugs. Forty-three patients (61.4%) had congenital heart defects, with common defects being conotruncal cardiac anomalies (n = 17, 39.5%), such as tetralogy of Fallot, aortic arch anomalies, and ventricular septal defects. One-third of patients had hypocalcemia, and 11.1% had hypothyroidism. Thirteen (n = 21, 61.9%) patients with hypocalcemia had a cardiac anomaly, and nine had T-cell lymphopenia. Six out of nine patients with hypocalcemia, cardiac anomalies, and T-cell lymphopenia died. In our cohort, the mortality risk was about 2/3 in patients with hypocalcemia, cardiac anomaly, and lymphopenia (Figure S3).
About half (54.2%) of the patients had at least one problem related to the digestive system. Kidney anomalies were present in 14 (19.4%) patients. Thirteen patients (18.1%) had musculoskeletal findings.
Immunological FindingsComplete Blood Counts, Serum Immunoglobulins, and Lymphocyte SubgroupsLymphopenia, anemia, thrombocytopenia, eosinophilia, and neutropenia were found in 30 (41.7%), 16 (22.2%), 15 (20.8%), 10 (13.9%), and 1 (1.4%) patient(s), respectively. The immunological data are summarized in Table S2. When percentages are presented below, the denominator is the number of patients with available data.
Serum Ig levels, evaluated according to age-matched references (Fig. 1A). Thirty-eight patients had normal/high IgA, IgG, and IgM values. No patient had panhypogammaglobulinemia. Low IgM (36.2%, n = 25), IgE (32.2%, n = 20), IgA (14.5%, n = 10), and IgG (5.8%, n = 4) levels were detected in the cohort. Two patients displayed elevated IgE values. Among patients with low IgA levels, six had low IgE levels. The association between low IgA and low IgE levels (below 5 IU/ml) was statistically significant (p = 0.011). Furthermore, strong correlations are present between IgG and IgA, as well as between IgG and IgE (r = 0.687, p < 0.001; r = 0.493, p < 0.001, respectively).
Fig. 1
Distribution of immunological values according to age-matched reference ranges. A, immunoglobulin values. B, lymphocyte subset counts. C, T cell subgroup percentages. D, B cell subgroup percentages. E, lymphocyte activation tests. Patient numbers are shown in white boxes in the center of each colored box. For IgE; low < 5 IU/ml, high > 150 IU/ml. Th; CD4+ T helper cells. Tc; CD8+ T cytotoxic cells.
Positive anti-HBs titers (indicating a protein antibody response) were observed in 33 (n = 33/55, 60%) patients. Isohemagglutinin responses, assessed using anti-A and anti-B titrations, were normal (above 1/16, n = 26).
Sixty-seven patients'lymphocyte subset counts according to age-matched reference ranges are present in Fig. 1B. CD3+ and CD4+ cell counts were low in 27 (40.3%) and 33 (49.3%) patients, respectively. B lymphocytes (n = 49, 73.1%), CD8+ T cells (n = 47, 70.1%), and NK cells (n = 42, 62.7%) were within normal levels in the given number of patients. While the NK cell percentage was high in 38 patients (56.7%), the NK cell count was high in 23 patients (34.3%) (Figure S4). The median ratio of CD4+ lymphocytes to CD8+ lymphocytes was 1.17 (0–5.90).
A weak correlation was found between CD3+ T cell and NK cell counts (r = 0.256, p = 0.036). However, a strong correlation was present between CD8+ T cell and NK cell counts (r = 0.358, p = 0.003). Interestingly, a strong correlation was recorded between CD8+ T cell and B cell counts (r = 0.642, p < 0.001) and between T and B cell counts (r = 0.611 and p < 0.001). We assessed the correlation between the CD4+ T cell counts and immunoglobulin levels and found no significant correlation (Table S2).
Additionally, 15 patients` IgA, G, M levels, and lymphocyte subset counts were normal/high according to the age-matched reference range (seven patients had T and B cell subset percentages, these patients displayed distributions different from normal; six patients had lymphocyte activation test, three of them had low activation response).
T cell Subgroup AnalysisThe T-cell subgroup percentages for 26 patients are presented in Table S2, Fig. 1C, and Fig. 2. The RTE percentages were within age-matched reference ranges in 21 (80.8%) patients and low in 5 (19.2%).
Fig. 2

Patients` T and B cell subgroup results. The gray areas indicate the normal age-matched reference ranges. The dotted line represents the trend with age in the results of DGS patients. T and B cell subgroup data are available for 26 patients. Th; CD4 + T helper cells. Tc; CD8 + T cytotoxic cells.
According to the age-matched references, the CD8+ T cell counts were normal or high in 80% of patients. Remarkably, no patient had a low percentage of CD8+ TEMRA cells. However, the percentages of CD4+ TEMRA cells were low in 42.3%(11/26) of patients.
In 19.2% of our DGS patients, the RTE cell percentages were lower than the age-matched reference ranges (Figs. 1 and 2). The percentage decrease in RTE cells with age was also prominent (r = −0.314, p = 0.118), although not statistically significant. Similarly, the naive CD4+ percentage decreased with age (r = −0.491, p = 0.011). The central memory CD4+ and effector memory CD4+ percentages increased (r = 0.530, p = 0.005; r = 0.508, p = 0.008), but the percentages of CD4+ TEMRA cells and the percentages of respective CD8+ cell subgroups showed no significant changes with age (Table S2).
An inverse relationship was present between the naive CD4+ cell percentages and the IgG levels (r =—0.453, p = 0.020), and there was a positive correlation between the central memory CD8+ and effector memory CD8+ cell percentages with IgG levels (r = 0.674, p < 0.001 and r = 0.463, p < 0.001, respectively).
A strong correlation was present between the RTE cell percentage and the CD3+ cell count (r = 0.678 and p < 0.001); as expected, this relationship was stronger for CD4+ lymphocytes (r = 0.719, p < 0.001) than for CD8+ lymphocytes (r = 0.404 and p < 0.04). Additionally, RTE percentages correlated with the CD19+ cell counts (r = 0.400 and p < 0.043).
Twenty (95.2%) patients out of 21 whose RTE cell percentages were within age-matched references had their serum IgA levels within age-matched references. Five patients had a low RTE cell percentage, and three (60%) had low IgA levels. A statistically significant correlation was present between the RTE cell percentages and the serum IgA levels (p = 0.014, tested with Fisher's Exact test). An inverse correlation was present between the RTE cell percentages and the IgM levels (r = −0.448, p = 0.022).
B Cell Subgroup AnalysisThe results for the B-cell subgroup percentages are in Table S2, Fig. 1D, and Fig. 2. In 26.9%, 30.8%, and 38.5% of patients, the percentages of marginal zone, switched memory, and active B cells were low, respectively, while 67% of patients had low transitional B cell percentages. Plasmablasts and naive B cell percentages were within the age-matched reference ranges or high in almost all patients. There was no patient with a high memory B cell percentage.
When evaluated at different age groups among the patients, the percentages of naive B, transitional, and plasmablast cells decreased with age (r = −0.660, p < 0.001; r = −0.669, p < 0.001; r = −0.393, p = 0.058, respectively). Memory B and switched-memory B cell percentages increased, and the marginal zone-like and active B-cell percentages did not change with age (Table S2).
We evaluated the relationship between B-cell subgroup percentages and serum immunoglobulin levels. The memory B-cell percentages and serum IgM levels were low in DGS patients, showing a positive correlation (r = 0.496, p = 0.01). The percentages of switched-memory B cells correlated with serum IgG and IgM levels (r = 0.402, p = 0.042; and r = 0.518, p = 0.007, respectively). Additionally, the percentages of marginal zone B cells correlated with serum IgM levels (r = 0.412, p = 0.037). Notably, there was an inverse relationship between the transitional B-cell percentage and serum IgG and IgM levels (r = −0.457, p = 0.025; r = −0.538, p = 0.001).
Lymphocyte Activation TestCD25 expression on CD3+ T cells was low in 6 (22.2%) of the patients (n = 27), and CD69 expression on CD3+ T cells was low in 8 (29.6%) when stimulated with phytohemagglutinin (Fig. 1E). A low IgA level was associated with low lymphocyte activation (p<0.05) (Table S2).
Infections and PathogensThe median number of infections per year in patients (n = 67) was four (2–10). The most common presentation was pneumonia (52.8%), followed by otitis (30.6%), sinusitis (16.7%), and sepsis (15.3%). The microorganisms evaluated to be causative during infectious diseases were Klebsiella pneumoniae (n = 9) and Staphylococcus epidermidis (n = 3). Sixty (83.3%) patients experienced at least one hospitalization due to infection in their lifetime.
TreatmentTwenty-eight (38.9%) patients were on antibacterial prophylaxis, and two were on antifungal prophylaxis (Table S1). Additionally, six patients were on immunoglobulin therapy, two with ITP and four with hypogammaglobulinemia.
Thymus transplantation was the plan for one of the three DGS with congenital athymia, and hematopoietic stem cell transplantation was considered for the other patient (the thymus transplantation wasn’t possible at that time). Unfortunately, both patients died before therapy.
Comments (0)