Tracer characteristic-based co-registration
Conceptually, TCBC registers MR to PET or PET to MR by optimizing the mean PET uptake measured from a pre-selected target ROI that has a well-documented radiotracer uptake characteristic. The optimization can be either a maximization or minimization process depending on whether the selected target ROI is known for a high or low tracer uptake. Moreover, the selected target ROI shall pose an intensity contrast with the adjacent tissues. We hypothesize that, when there is a known and significantly strong PET contrast between the selected target ROI and its surrounding tissue, the ideal co-registration of the selected target ROI and the PET images shall lead to an optimally measured mean PET intensity within this target ROI. For example, if a given brain structure has a uniformly high PET uptake while the surrounding tissue has significantly reduced uptake, the ROI of such a structure will yield the maximal measurement of the mean PET intensity when the ROI is ideally co-registered with PET.
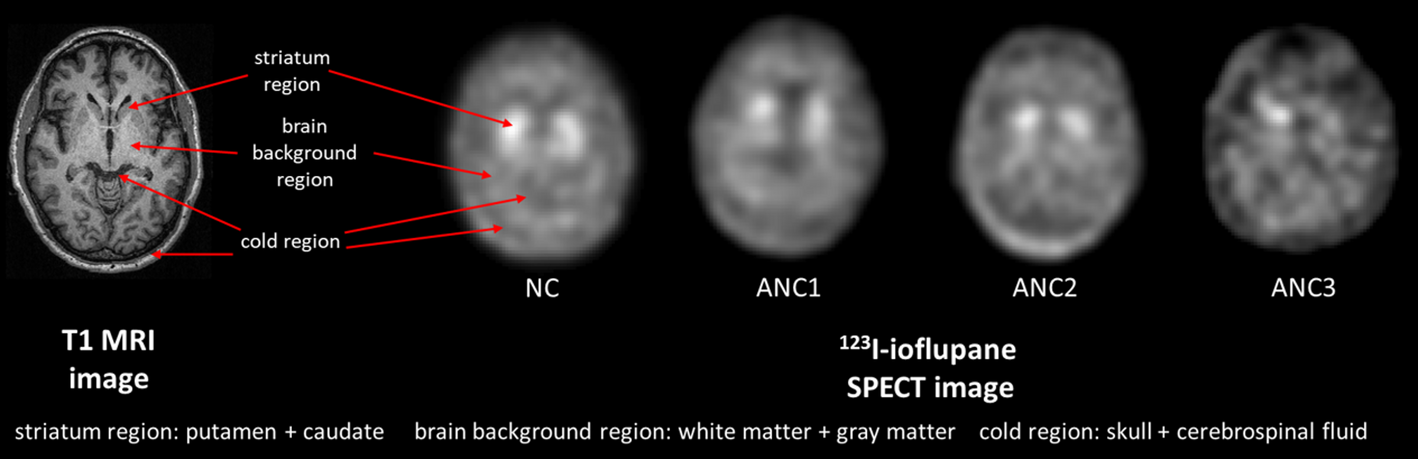
We chose amyloid PET scans to demonstrate the feasibility of TCBC in this study. Cerebral WM was identified as a good candidate to serve as the selected target ROI, as WM typically shows a high and uniform non-specific binding of Aβ tracers such as 18F-Florbetapir (18F-FBP) in both cognitive normal (CN) subjects and patients with cognitive impairment such as AD [20]. There is also a very strong signal contrast between WM and brain ventricles which typically do not retain amyloid tracers. This WM-to-ventricle contrast will be helpful in guiding the co-registration in patients with high amyloid burdens in gray matter (GM) that could lead to blurred boundaries between GM and WM on PET [21]. These consistent contrast patterns between GM, WM and ventricles enable the use of this method in healthy subjects or patients.
To implement TCBC for PET-to-MR co-registration, we first assume that there is no distortion or strong artifacts in PET and MR images and the co-registration can be achieved through a rigid body transformation without scaling, reflection, or shearing. TCBC is then designed to optimize the affine transformation matrix M with six degrees of freedom determined by translation (tx, ty, tz) and rotation (θx, θy, θz) along the three axes, as shown in Eq. 1:
$$\beginM\,(,\,,\,,\,,\,,)\,\\= \,T\,(,\,,\,)\,\,()\,\,()\,\,()\end$$
(1)
where T (tx, ty, tz) denotes translation by amount tx, ty, and tz in the x, y, and z axes, respectively. RX (θx), RY (θy), and RZ (θz) are the rotations within the y-z plane, x-z plane, and x-y plane by θx, θy, and θz, respectively. These transformation parameters serve as the decision variables in the optimization algorithm. The mean intensity function can be expressed as Eq. 2:
$$\begin}(,},},},},})\\= \,\,\sum \,((M\,(,},},},},})\,S) \otimes \,V)\,/N\end$$
(2)
where Imean (tx, ty, tz, θx, θy, θz) is mean intensity within the selected target ROI after its spatial transformation. S and V denote selected target ROI as a binary mask and the PET image volume, respectively. M (tx, ty, tz, θx, θy, θz) is the affine transformation matrix defined above and applied to the target ROI S. ⊗ denotes the element-wise convolution operation to calculate intensity values resulting from the transformed ROI and the PET volume. N is the number of voxels in the target ROI after transformation. The objective function to minimize through numerical optimization was then formulated as Eq. 3:
$$\mathop \limits_}}\,,\,\,,\,\theta z\,,}}} \}\,(,\,,,\,,\,,)\} $$
(3)
The TCBC method technically is not requiring any specific optimizer. In this study, we used the fminsearch function in MATLAB R2023b based on the Nelder-Mead simplex algorithm as the optimizer for the testing and the feasibility evaluation [22]. In practice, such optimization may often be affected by the choice of initial guesses. To reduce the bias in parameter optimization due to the choice of initial guesses, 100 sets of initial guesses were randomly generated for each numerical optimization process with the specified ranges of [-10 mm, 10 mm] for translation and [-10°, 10°] for rotation. These parameters sets were used by TCBC as the initial entries to find the ideal transformation matrix. fminsearch is an unconstrained optimization routine, so there were no upper or lower bounds for searching the six transformation parameters. The set of transformation parameters that generated the lowest output of the objective function was selected to compose the optimized transformation matrix. This matrix was then directly applied to both the T1w MR image and the corresponding MR-derived segmentation masks, aligning them individually with the PET image to complete the co-registration.
Imaging dataset
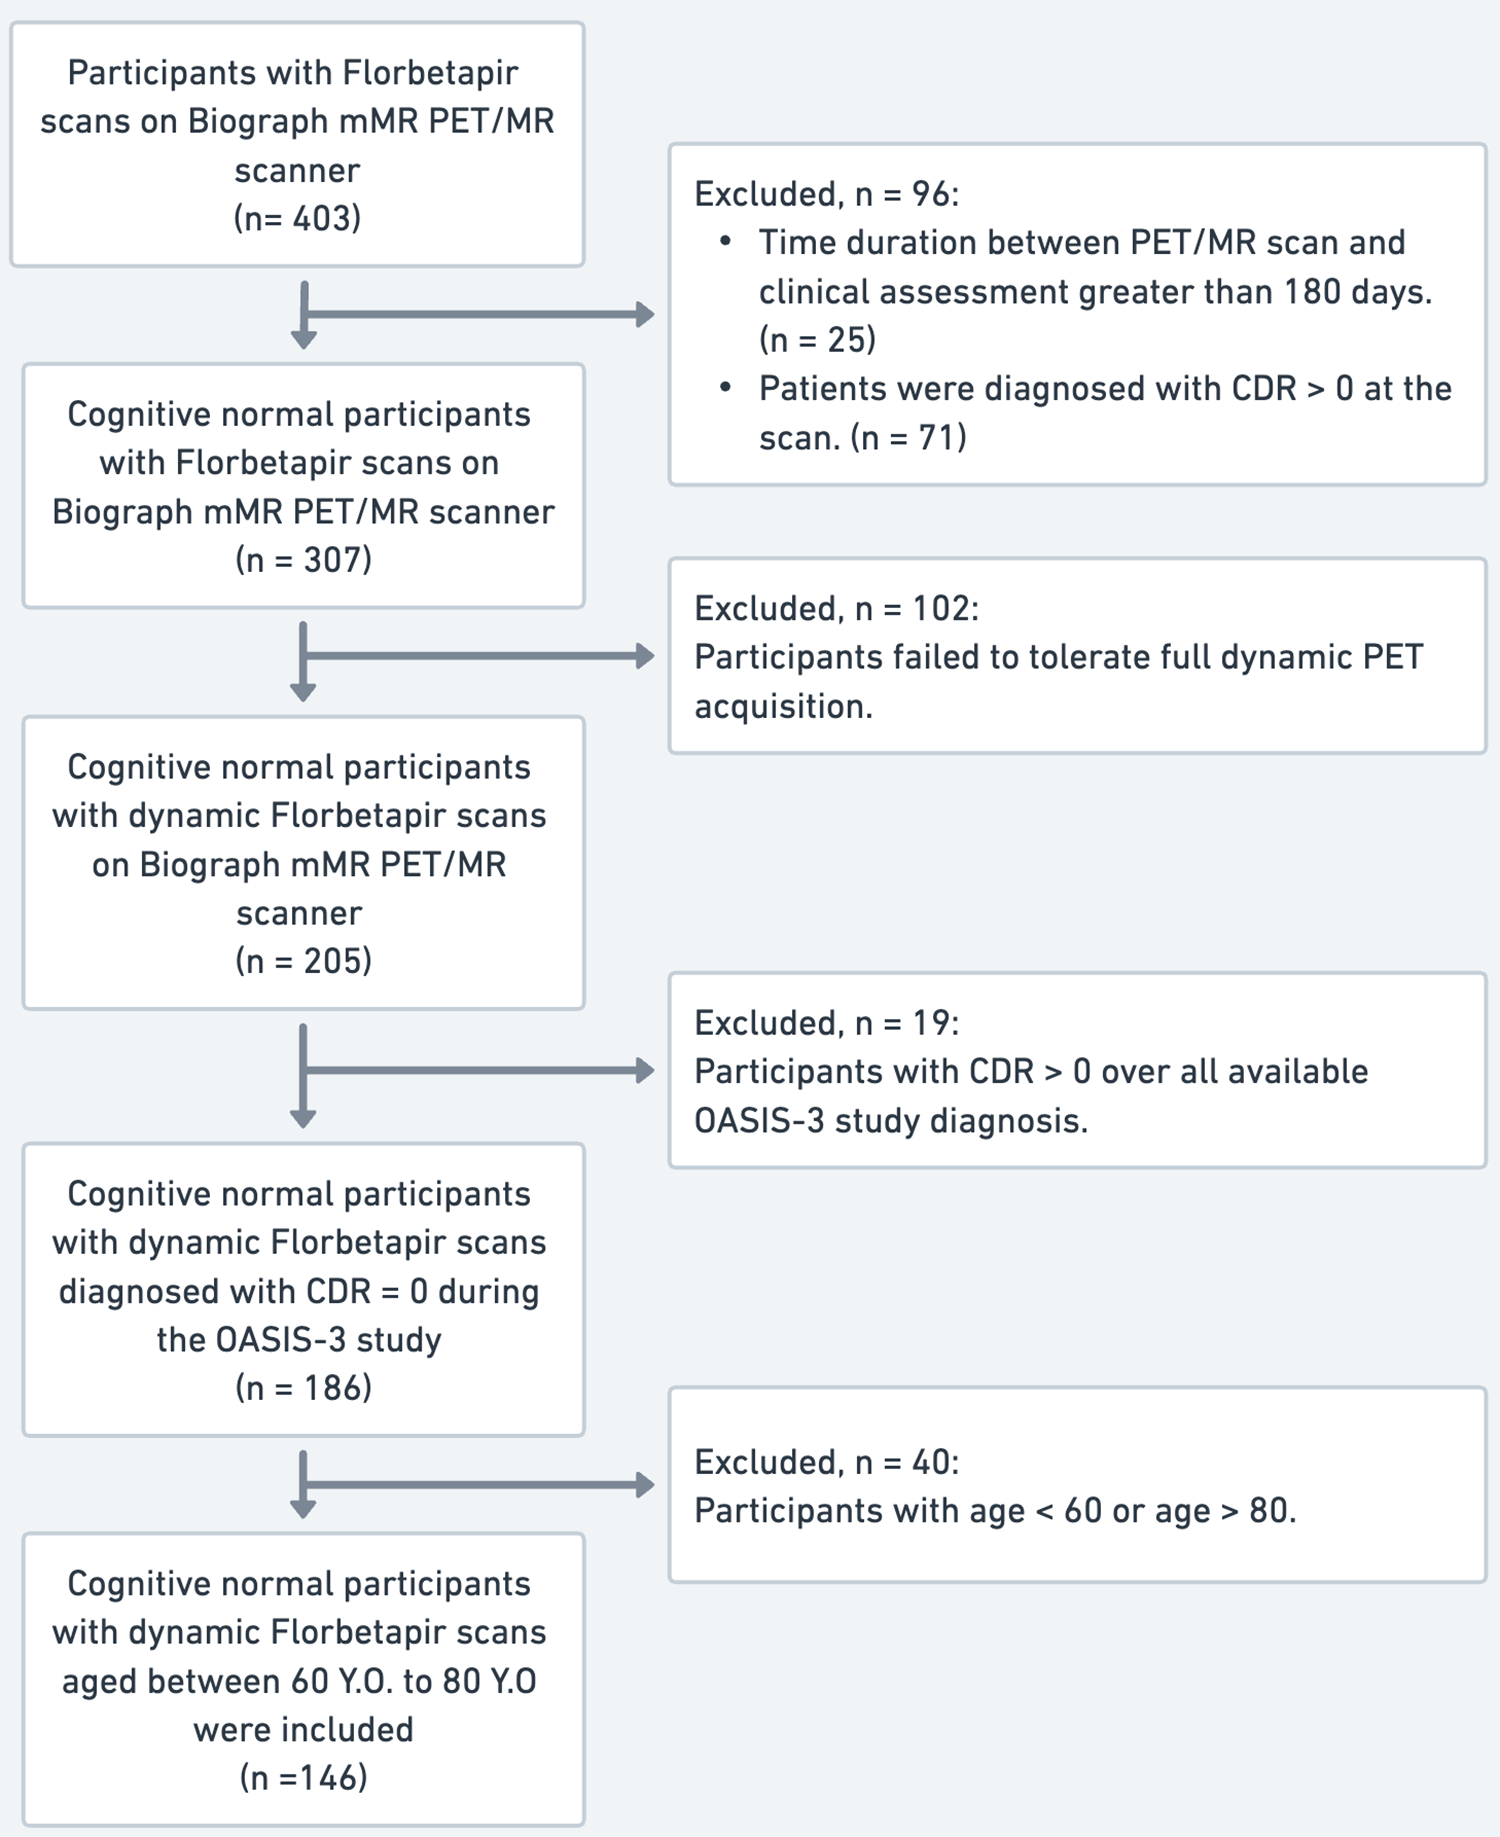
Human imaging data from the OASIS-3 dataset were used to conduct both a simulation and a retrospective human study for evaluating the TCBC performance. The OASIS-3 study was a research initiative led by the Alzheimer’s Disease Research Center (ADRC) at Washington University, St. Louis and involved data from both healthy controls and patients with cognitive impairment. The dementia status of the participants was determined with the Clinical Dementia Rating Scale (CDR) [23]. For participants with available 18F-FBP PET/MR data, those who meet the following inclusion criteria were included in this study: (1) Participants with zero CDR scores over all available longitudinal OASIS-3 evaluations, indicating no clinical cognitive impairments during their study participation. (2) Participants that went through the full dynamic PET/MR acquisition. (3) The time interval between the participant’s PET/MR scan and the corresponding ADRC clinical assessment was less than 180 days. Key clinical characteristics such as the participant’s age at scan, gender, and apolipoprotein E (APOE) genotypes were also collected.
Image acquisition and processing
Simultaneous PET/MR imaging was performed using a Siemens BioGraph mMR scanner. Aβ deposition was measured using 18F-FBP [24]. Participants received an intravenous bolus of 10 mCi of 18F-FBP, followed by 70 min of dynamic PET/MR imaging, which included 4 ⨯ 15 s frames, 8 ⨯ 30 s frames, 9 ⨯ 1 min, 2 ⨯ 3 min frames, and 10 ⨯ 5 min frames. For a few participants who were unable to tolerate the full dynamic scan, PET/MR scans began 50 min after bolus injection with a dynamic 20 min (4 × 5 min frames) PET acquisition. The acquired PET data were reconstructed using an Ordinary Poisson Ordered Subsets Expectation Maximization (OP-OSEM) algorithm. Structural T1w imaging was performed at the beginning of the dynamic PET acquisition with an approximate duration of 4 to 5 min. Volumetric parcellation was generated using FreeSurfer 7.3.2 for each T1w image [25].
Study design
We conducted two studies, one with simulated data and another with in vivo human data, to evaluate the performance of TCBC in comparison to FSMC. In the simulation study, we created artificial motion to the MR data and tested if the added motion can be properly corrected by TCBC. Furthermore, we evaluated whether TCBC will provide an improved motion correction when compared to FSMC. To generate data with simulated motion, we selected a participant from the OASIS-3 dataset who only underwent a 20-min PET/MR scan at the 50th minute post injection, instead of the full dynamic scan. In this selected participant, we used the 50–55 min 18F-FBP PET frame as the T1w MR was acquired simultaneously during this frame for this session. This scan hence provides well-registered PET and MR data because of the minimal time difference between the selected 18F-FBP PET frame and the T1w scan. We assumed that this minimal time difference would prevent the occurrence of substantial motion between the T1w and PET acquisitions. Visual evaluation also confirmed that there was no noticeable misalignment.
For the simulation study, we simulated noisy PET images with artificial motion to evaluate the performance of TCBC and FSMC in recovering the simulated motion. The simulation process involved several steps. First, the PET image from the selected participant was forward-projected into 2D sinograms on a slice-by-slice basis using ‘radon’ function in MATLAB. Second, the resulting sinograms were scaled to estimated counts that would be expected from an 18F-FBP scan, based on the injected dose of 370 MBq, an approximated brain uptake of 5% total injected dose [26], a given acquisition duration and the system-level counting sensitivity of 15 kcps/MBq for Siemens Biograph mMR [27]. Third, Poisson noise was added to the scaled sinogram. Finally, the noisy sinograms were reconstructed into images using MATLAB’s iradon function of Filtered Back-Projection (FBP) with a Hamming filter. We have simulated two noise levels under acquisition time of 5 and 20 min to evaluate the impact of noise for motion correction. For both conditions, we randomly generated 500 sets of simulated motion in the form of affine transformation matrices, each comprising randomly generated translation and rotation parameters within the ranges of [-10 mm, 10 mm] for translation and [-10°, 10°] for rotation as the ground truth of the simulated motion. Each matrix was applied to the T1w MR scan and MR-derived segmentation of the selected participant to generate simulated PET/MR pairs with artificial misalignments. TCBC and FSMC were then applied individually and independently for PET/MR co-registration. For each method, the root mean square error (RMSE) values were calculated to quantify the differences between the optimized co-registration parameters and the ground truth. Additionally, R-squared values were derived from linear regression to examine the consistency between the estimated parameters and the ground truth.
In the study with in vivo human imaging data, we designed a retrospective study to evaluate how the proposed co-registration method will affect the detectability of the association between PET measurements and physiological or metabolic conditions under investigation. We chose the well-known association of age and PET-measured amyloid burden in older adults as the target endpoint to evaluate the performance of different co-registration strategies. Prior reports have shown that amyloid burden increases with age in cognitively normal older individuals as part of the normal aging process [28,29,30]. It can be expected that, when there is a misalignment between PET and MR, the MR-based segmentation adds additional and undesired variance to the PET measurements, reduces the PET quantification precision, and degrades the detectability of age-dependent increase of amyloid standardized uptake value ratio (SUVR) in the given cohort. As a result, when an accurate co-registration is applied to PET/MR data with potential misalignment, precision of SUVR measurement can be restored and detectability of correlation between age and amyloid burden shall be improved. Therefore, we used the detectability of age-amyloid association as an indirect measurement of the image co-registration performance.
This retrospective study was performed with CN subjects and their SUVR across several brain ROIs. Participants aged 60 to 80 who maintained a CDR of 0 on all available ADRC clinical assessments constituted this cohort. For the TCBC method, the last PET frame from each scan was used for co-registration. This frame was chosen since Wong et al. has reported that the contrast between the GM and WM reaches the maximum at approximately 70 min for a typical dynamic 18F-FBP scan in both AD and CN participants [20], thereby providing the sharpest anatomical boundaries for image co-registration. Five target ROIs were selected due to their established age-amyloid association demonstrated in the literature, including precuneus, anterior cingulate, posterior cingulate, medial orbitofrontal, and an early Aβ composite comprising the aforementioned ROIs [31, 32]. 18F-FBP SUVR values were measured from the summation of the last four PET frames from the dynamic study (50 to 70 min post-injection) as it is the most common time window for amyloid SUVR computation [33,34,35]. An eroded WM ROI was used as the reference region for SUVR calculation [36,37,38]. WM erosion was done in accordance with the guideline proposed in Alzheimer’s Disease Neuroimaging Initiative (https://adni.loni.usc.edu/) to reduce spillover from surrounding regions. We used linear mixed-effect models (LMMs) with fixed-effect variables of age, sex, education, and APOE ε4 carriers, to determine their correlation with the 18F-FBP SUVR in target ROIs. We specifically focused on the age-SUVR association in this study.
We also designed a task under smaller sample sizes within the original cohort with the bootstrapping technique to evaluate the statistical power of TCBC-based SUVR compared to those measured under FSMC and uncorrected data. We performed bootstrap sampling and repeated the LMM analysis on each of the bootstrap samples [39]. Specifically, we generated 1000 bootstrap sets, each containing 100 subjects randomly drawn from the originally eligible CN subjects. For each bootstrap sample, we calculated 18F-FBP SUVR under three co-registration conditions (uncorrected, FSMC, TCBC). We then fitted the SUVRs with LMMs, incorporating fixed variables including age, sex, education, and APOE genotypes and assessed the association between age and 18F-FBP SUVR for each target ROI in each bootstrap sample. We averaged the p-values from all LMM analyses per region and calculated their confidence intervals to evaluate the consistency and detectability of the associations under the three co-registration conditions.


Comments (0)