Self-organizing maps can be created with several geometries, and their size (the number of coordinate units) can also be chosen freely. To find an adequate visual representation of the solvent set, we created maps that were square, rectangular, square toroidal, rectangular toroidal, and circular. The smallest investigated size had about three times as many coordinate units as there were samples. Several larger maps were created for each geometry. Since the training of a self-organizing map uses randomization during initiation and in the training sequence, the finished maps can differ in the arrangement of samples. To check for consistent results, ten maps were created for each geometry and size. The maps were then assessed and compared visually for legibility and consistency. The smallest maps were too small for all geometries. Solvents were placed in the same location unit, especially alkanes, and thus, no differentiation was achieved. Toroidal maps, where the left edge of the map is connected to the right edge and the top edge is connected to the bottom edge to obtain a continuous surface without edges, were difficult to read and interpret. Rectangular maps suffered from inconsistent placement of the solvents. This highlights the significance of edge and corner positions on self-organizing maps. These distinguished positions have fewer neighbors so that unusual solvents, for example, water, are preferably placed there. Rectangular maps had the highest portion of edge positions, and this noncontinuity affected the placement and grouping of the solvents. In one case, the otherwise reliably grouped ethers and esters were even split apart. After ruling out these unsuitable options, square and circular maps were further reviewed for representative placement of solvents and ease of legibility. Placement of the solvents were consistent between repetitions on these maps. Especially on circular maps, which do not have corner positions, the relative positions of solvents barely changed between individual maps. Among the circular maps, those with a larger number of position units agreed more with the visual expectation of a geographical map. The higher number of grid elements resulted in smoother transitions between the values of solvent properties, and the higher resolution allowed a more detailed distinction, for example, of alkanes. The map selected was a circular map with a radius of 37 grid units.
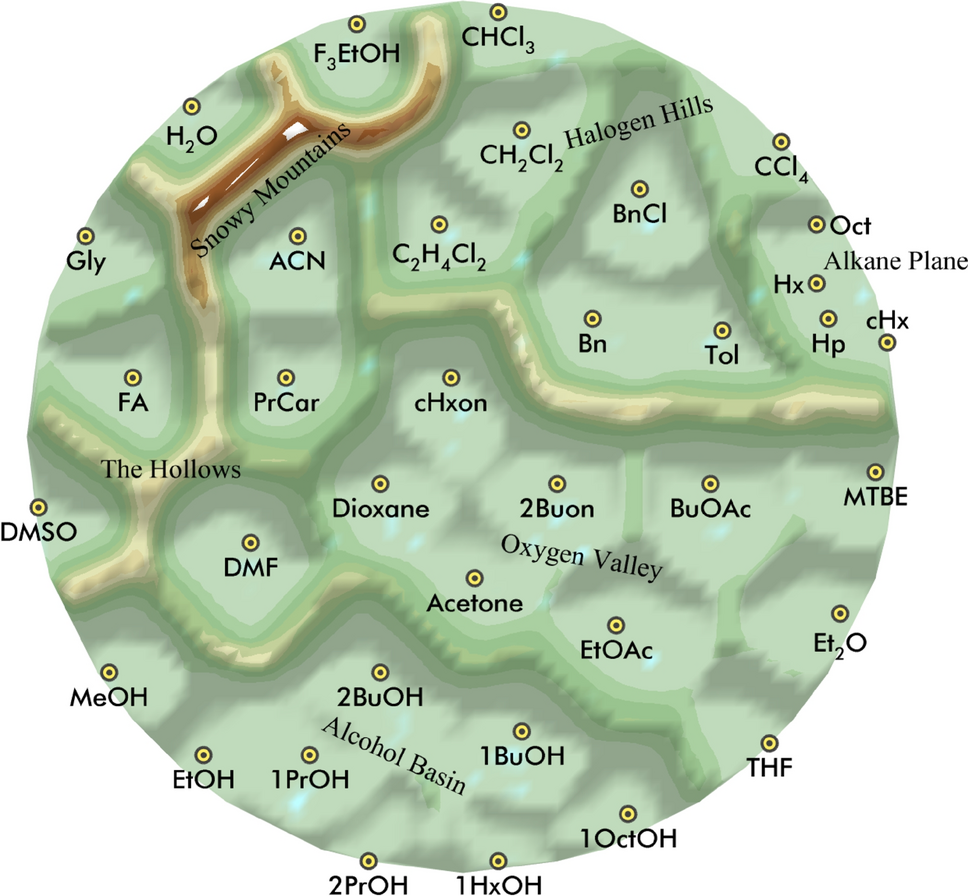
On a self-organizing map, similar solvents are placed next to each other, which allows for the observation of relationships between solvents. Moreover, the solvents are distributed evenly across the map, which prevents overlapping data points. The geometric distance between two data points is therefore not indicative of their difference in properties, unlike the scores plot in a PCA. Instead, a U-matrix is calculated to illustrate the extent of differences between two neighboring points. It shows the change in the values of solvent properties from one map unit to the next. Solvents which are very different will have high values for the U-matrix between them. These can be represented as hills and mountains by an adequate color scheme, analogous to a geographical map (Fig. 1). Solvents with similar properties share wide valleys that are enclosed by hills, while solvents with unique properties are isolated in mountain ranges. This division and grouping is readily understood without much explanation, as it is commonly known from geographical maps. As a final touch, regions of the maps were named to support a verbal discussion of the map. Not every cluster received a name so that the graph would not be cluttered. (Table 1).
Table 1 Solvents used for the self-organizing maps and their abbreviation. Values were taken from [10]Two solvents were consistently separated by higher barriers from others: water and trifluoroethanol. The neighborships across these barriers were stable, with trifluoroethanol neighboring to the halogenated solvents on one side and to water on the other side, which was placed next to glycerol, formamide, and dimethyl sulfoxide (DMSO). Water is surrounded by the highest barrier, which shows its unique solvent properties. As was pointed out earlier, it is unlikely that the other solvents placed behind high barriers are unique; their matching partners are simply not in the dataset [10]. Behind the mountain range are three pairs of solvents that are always placed next to each other: DMSO and dimethyl formamide (DMF), propyl carbonate, and acetonitrile. Acetonitrile was always placed next to the halogenated solvents. DMF and DMSO were reliably placed next to dioxane. DMSO was always placed next to the alcohols and preferably placed next to formamide.
The alkyl halides were arranged in a line from chloroform to dichloromethane. Carbon tetrachloride was separated from the other halogenated solvents and placed more closely to the alkanes. In addition, the grouping within aromatics (benzene–toluene–chlorobenzene) and alkanes (cyclohexane, n-hexane, n-heptane, and iso-octane) was stable throughout the maps. The geometrical distance between the alkanes was usually smaller than the typical distance between the solvent, and, on smaller maps, they were even placed into the same grid unit. This highlights the strong similarity within this group. The arrangement of alcohols generally followed the homologous series from methanol to octanol. Only 2-butanol was placed out of sequence closer to methanol than to octanol. Octanol, hexanol, and 2-propanol preferred locations at the edge of the map, and 2-propanol showed slightly elevated barriers in the U-matrix toward the other alcohols. This illustrates the diversity within this apparently consistent group of solvents. Within the alcohol group, the order of placement was stable, even when the relative orientation toward other solvent classes varied, as it was the case on some rectangular maps. Ethers, ketones, and ester were arranged in a more differentiated manner than expected by their chemical structure alone. Tetrahydrofuran (THF) and methyl tert-butyl ether (MTBE) were usually found in the exposed corner positions—THF towards the alcohols and MTBE towards the alkanes—while the esters and diethylether were placed in the center of the valley. Interestingly, dioxane was separated from the other ethers by the esters and ketones. Its location indicated a higher similarity with DMF and the other solvents with unusual properties.
The relative placement of regions was also constant. Alkanes, carbon tetrachloride, aromatics, and halogenated solvent were placed in this typical order. Moreover, the solvent between the Snowy Mountains and the rim—trifluoroethanol, water, ethylene glycol, and formamide—were typically arranged in this order.
The locations of the solvents on the map were compared with their organization in a HCA presented earlier by Poole and Karunasekara [10]. They describe seven major clusters that agree well with the troughs and valleys on the solvent map: alkanes; aromatics; halogenated solvents without carbon tetrachloride; acetonitrile and propylcarbonate; alcohols; ethers, esters and ketones; and ethylene glycol and formamide. Solvents that are not part of a cluster in the HCA also remain solitary on the map. Furthermore, the structure within the clusters, for example, for the alcohols, is the same in both approaches. The solvents that are grouped in clusters can be encircled on the self-organizing map by a single line without crossing the encirclement of another cluster. This further confirms that the grouping found on the self-organizing map and in the HCA are practically identical. In contrast to the dendrogram that is used to show the result of the HCA, the self-organizing map offers two dimensions to indicate the relationships between solvents, which gives more context to their interrelationships.
Importantly, the causes for the arrangements of solvents can be read from component planes that depict the values of the input properties across the map (Fig. 2). For example, from the component plane of polarizability s, it is apparent that alkanes have very low values, and the polarizability of solvents is high around the Snowy Mountains. Both along Oxygen Valley and the Alcohol Basin, a continuous increase is visible. The component planes offer directly observable explanations for the found groupings. The solvents between the Snowy Mountain and the rim have an exceptionally high excess molar refraction e, which reflects their potential to interact by loosely bound n- and π-electrons. They also share high values for a, hydrogen-bond acidity, and b, hydrogen-bond basicity. At the same time, they are quite heterogeneous in terms of the other parameters s, polarizability, and l, a gas–liquid partition coefficient based on hexadecane. Water has, as expected, a uniquely low value for this partition coefficient. The stable partnership of formamide and DMSO is likely based on a similar polarizability. Acetonitrile and propyl carbonate have very similar values altogether, with the exception of the excess molar refraction. For the alcohols, a logical gradient is observed for polarizability, acidity, basicity, and liquid partition coefficient. 2-Butanol stands out in terms of excess molar refraction, together with 2-propanol, and has a similar basicity and liquid-partition coefficient as DMF. For the halogenated solvents, a logical sequence is observed for the solvent properties. The separation of carbon tetrachloride is due to its polarizability, which is between the halogenated and the nonhalogenated alkanes. Toluene shows the lowest excess molar refraction of all aromatics, which places it close to the alkanes.


Comments (0)