
Remember me
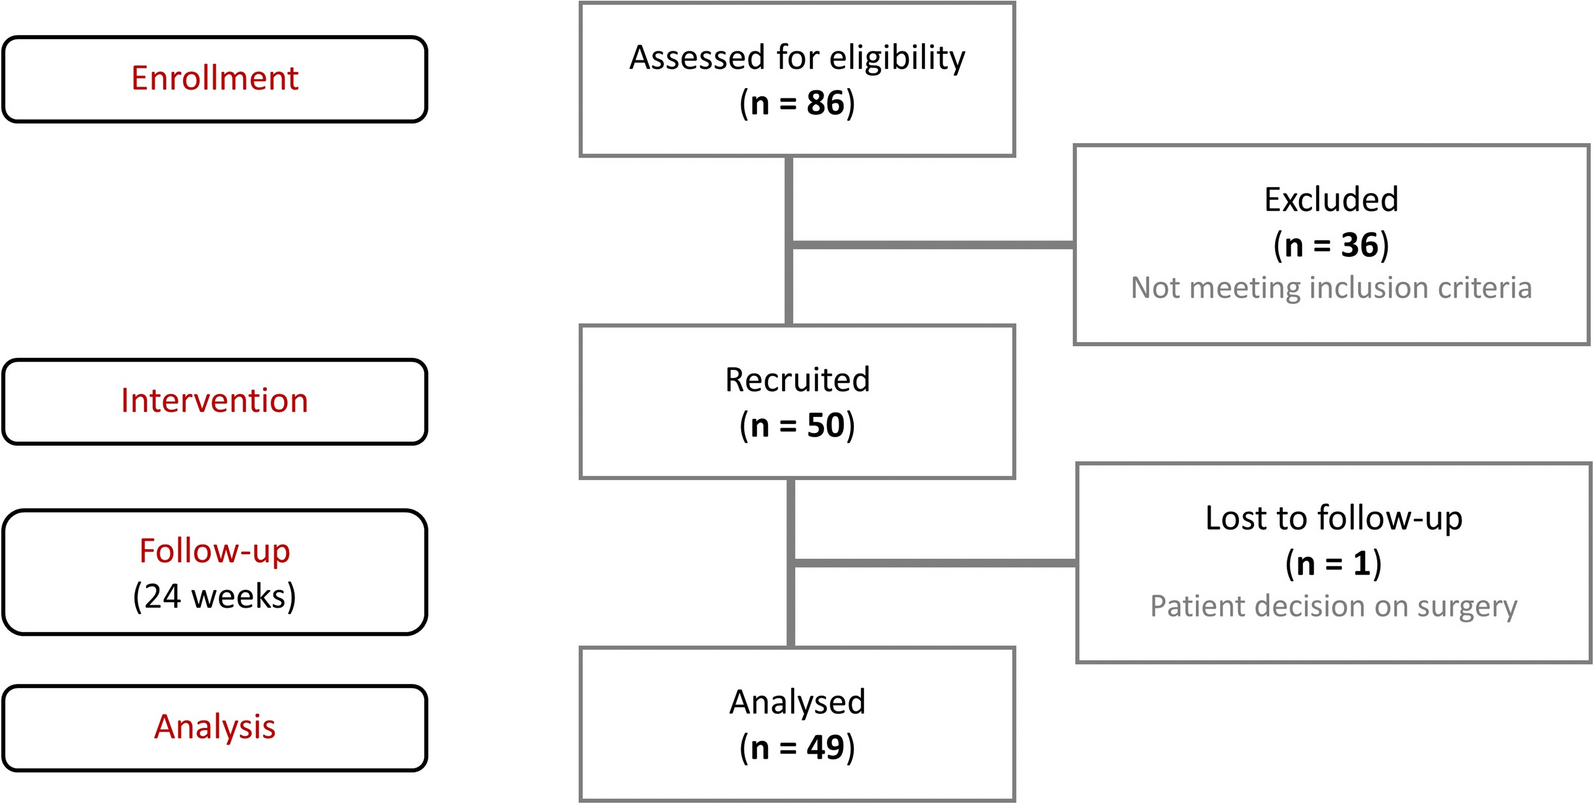
Between July 19, 2023, and February 28, 2024, a total of 125 patients were randomized, and 123 received treatment (firsekibart, n = 61; etoricoxib, n = 62) (Fig. 1B). All treated patients completed the study, with no discontinuations. Most patients in the etoricoxib group (66.1%, n = 41) switched to firsekibart due to recurrent flare, compared with 4.9% (n = 3) in the firsekibart group who received an additional injection.
Baseline demographics and disease characteristics were generally comparable between groups (Table 1). Most patients were male (firsekibart, 98.4%; etoricoxib, 100.0%; 1 female patient included in the firsekibart group), with a mean (SD) age of 41.2 (11.0) and 40.2 (11.7) years, and mean (SD) BMI of 26.6 (4.1) and 27.3 (3.3) kg/m2, respectively. The median (Q1, Q3) gout duration was similar: 80.0 (43.8, 127.5) months in the firsekibart group and 80.2 (43.0, 123.2) months in the etoricoxib group. Prior flare frequency in the previous year was also comparable between firsekibart and etoricoxib groups: 39.3% versus 50.0% experienced 3–5 flares, 29.5% versus 24.2% experienced 6–12 flares, and 11.5% versus 6.5% experienced > 12 flares, respectively. The prevalence of tophi was similar between firsekibart (31.1%) and etoricoxib (33.9%) groups.
Table 1 Demographics and baseline disease characteristics (FAS)Comorbidities were frequent in both groups (firsekibart, 95.1% [n = 58]; etoricoxib, 88.7% [n = 55]), most commonly metabolic and nutritional disorders (77.2% overall), primarily hyperlipidemia, hypertriglyceridemia, and hypercholesterolemia (> 10% of patients), and hepatobiliary system diseases (38.2% overall), mainly hepatic steatosis (> 10%). Other common comorbidities (> 10%) included kidney stones, renal failure, and hypertension. Overall, 67.5% (n = 83) of patients received ≥ 1 dose of ULT as combination therapy.
EfficacyMean (SD) baseline target joint pain VAS scores were comparable between the firsekibart (72.41 [12.38] mm) and etoricoxib (71.98 [10.11] mm) groups (Fig. 2). At 72 h post-treatment, the LSM change from baseline in target joint pain VAS score was − 54.37 mm in the firsekibart group and − 43.46 mm in the etoricoxib group, with a treatment difference of − 10.91 mm (95% CI − 18.11, − 3.72) (Table 2). The upper 95% CI bound for the treatment difference was below the 10 mm non-inferiority margin, indicating non-inferiority of firsekibart versus etoricoxib. In addition, as the upper bound was also below 0 mm, firsekibart was statistically superior to etoricoxib for pain reduction at 72 h. These findings were consistent across subgroups defined by baseline VAS score, BMI, body weight, and ULT use (Table 2). The mean target joint pain VAS scores decreased over time in both groups, with numerically lower scores observed in the firsekibart group at all timepoints (Fig. 2).
Fig. 2
Mean target joint pain VAS score over time (FAS). FAS full analysis set, SD standard deviation, VAS visual analog scale
Table 2 Change from baseline in target joint pain VAS scores at 72 h post-treatment (FAS)The median time to ≥ 50% reduction in target joint pain VAS score was 2.0 days (95% CI 2.0, 3.0) in the firsekibart group and 4.0 days (95% CI 3.0, 4.0) in the etoricoxib group (Fig. 3A), with an HR of 1.66 (95% CI 1.14, 2.43). Within 7 days of firsekibart administration, 96.7% (n = 59) of patients achieved ≥ 50% improvement versus 85.5% (n = 53) in the etoricoxib group.
Fig. 3
Kaplan–Meier curves of time to first achievement of 50% reduction in target joint pain VAS score from baseline (A), achievement of VAS ≤ 30 mm (B), achievement of VAS ≤ 10 mm (C), and time to first relapse (D) (FAS). FAS full analysis set, VAS visual analog scale
The median time to reach a target joint pain VAS score ≤ 30 mm was 3.0 days (95% CI 2.0, 3.0) with firsekibart and 4.0 days (95% CI 4.0, 8.0) with etoricoxib (Fig. 3B; HR: 1.57 [95% CI 1.07, 2.31]). At day 7, 95.1% (n = 58) and 85.5% (n = 53) of patients in the firsekibart and etoricoxib groups, respectively, had reached this threshold. A similar trend was observed for the median time to achieve target joint pain VAS scores ≤ 10 mm (5.0 days [95% CI 3.0, 8.0] vs. 8.0 days [95% CI 6.0, 9.0], respectively) (Fig. 3C; HR: 1.38 [95% CI 0.93, 2.06]).
Firsekibart delayed the median time to first new flare over a 12-week period versus etoricoxib (not reached [NR] vs. 28.0 days [95% CI 21.0, 52.0], respectively) (Fig. 3D). The risk of new flare was reduced by 94% with firsekibart versus etoricoxib (HR: 0.06 [95% CI 0.02, 0.18]). The proportion of patients experiencing ≥ 1 new flare within 12 weeks was 6.6% (n = 4) with firsekibart versus 66.1% (n = 41) with etoricoxib.
Rescue treatment was used by 3.3% (n = 2) of patients in the firsekibart group, versus 17.7% (n = 11) in the etoricoxib group.
SafetyAmong 123 patients in the SS, TEAEs were reported in 77.0% (n = 47) of patients in the firsekibart group, 51.6% (n = 32) in the etoricoxib group, and 61.0% (n = 25) of etoricoxib-to-firsekibart switchers (Table 3). Treatment-related AEs (TRAEs) occurred in 54.1% (n = 33), 21.0% (n = 13), and 48.8% (n = 20) of patients in these groups, respectively. Two SAEs occurred during the study: one case of Parkinson’s disease in the firsekibart group, and one case of ulnar and radial fractures following a fall in the etoricoxib group. Both were deemed unrelated to treatment, and neither resulted in treatment discontinuation or study withdrawal. No deaths or TEAE-related discontinuations occurred.
Table 3 Summary of AEs by treatment group (SS)In the firsekibart group, the three most common TEAEs were hypertriglyceridemia (42.6% [n=26]), hypercholesterolemia (13.1% [n=8]), and upper respiratory tract infection (11.5% [n=7]) (Table 3). The majority of hypertriglyceridemia and hypercholesterolemia cases were treatment-related (32.8% [n = 20] and 11.5% [n = 7], respectively), while no cases of upper respiratory tract infection were. In the etoricoxib group, the most common TEAEs were hypertriglyceridemia (17.7% [n = 11]), alanine aminotransferase (ALT) increased (9.7% [n = 6]), and hypercholesterolemia (8.1 [n = 5]). Most TEAEs were not treatment-related: treatment-related hypertriglyceridemia was reported in 4.8% of patients (n = 3), and aspartate aminotransferase (AST) increased, ALT increased, and hypercholesterolemia each in 1.6% of patients (n = 1). In etoricoxib-to-firsekibart switchers, the most common TEAEs were hypertriglyceridemia (22.0% [n = 9]), AST increased (17.1% [n = 7]), and ALT increased (14.6% [n = 6]), and TRAEs were hypertriglyceridemia (17.1% [n = 7]), AST increased (12.2% [n = 5]), ALT increased, hypercholesterolemia, and blood triglycerides increased (each 9.8% [n = 4]). Injection site reactions (ISRs) were rare, with one patient (1.6%) in the firsekibart group experiencing a grade 1 reaction (treatment-related).
Grade ≥ 3 TEAEs occurred in 21.3% (n = 13) of patients receiving firsekibart, 8.1% (n = 5) receiving etoricoxib, and 14.6% (n = 6) among switchers. Treatment-related grade ≥ 3 events were observed in 11.5% (n = 7) of firsekibart-treated patients, all hypertriglyceridemia, and in 12.2% (n = 5) of switchers, mainly due to blood triglycerides increased. No treatment-related grade ≥ 3 TEAEs occurred in the etoricoxib group. Most grade ≥ 3 TEAEs resolved or improved.
Increased triglyceride levels were observed in 19.7% (n = 12) of patients in the firsekibart group and 16.1% (n = 10) in the etoricoxib group. Among switchers, elevations were reported in 14.6% (n = 6) by day 8 and 17.1% (n = 7) by week 12. Increased cholesterol levels were observed in 19.7% (n = 12) of patients in the firsekibart group, 12.9% (n = 8) in the etoricoxib group, and 4.9% (n = 2) at day 8 and 7.3% (n = 3) at week 12 in switchers. No other clinically meaningful differences between groups were observed in laboratory parameters, physical examinations, or vital signs.
ImmunogenicityAmong the 102 patients in the ADAS, 13 (12.7%) tested positive for ADAs (titers: 20–2560) (Supplementary Material, Table S2). Five patients (4.9%) were ADA-positive before firsekibart administration, and 12 (11.8%) tested ADA-positive after dosing. Eight patients (7.8%) who were ADA-negative prior to administration became ADA-positive after dosing. One patient (1.0%) tested positive for NAbs both before and after dosing. No patients who tested positive for ADAs after administration experienced safety risks.
In the firsekibart group, 12 patients (19.7%) were ADA-positive, with four (6.6%) positive before treatment and 11 (18.0%) positive after treatment; eight patients (13.1%) became ADA-positive after dosing. No patients in this group tested NAb-positive.
In the etoricoxib-to-firsekibart switcher group, one patient (2.4%) tested positive for both ADAs and NAbs before firsekibart administration (ADA titer 2560). After dosing, the ADA titer decreased to 320, with NAb-negativity at the safety visit.
Comments (0)