
Remember me
Baseline patient characteristics for the mixed population in the primary and sensitivity analyses are presented in Table 1. Before matching, key differences between trial populations included a slightly more severe PsA population in the guselkumab trials (e.g., higher Disease Activity Score-28, greater number of swollen and tender joints). There was a lower percentage of female patients receiving guselkumab Q4W compared to patients receiving secukinumab and a greater proportion of patients with PsO in the guselkumab trials [18,19,20, 24, 25] compared to the secukinumab trials [13,14,15,16, 26,27,28,29,30,31].
Table 1 Baseline characteristics for the mixed populationBaseline patient characteristics for the biologic-naïve population in the scenario analysis are presented in Supplementary Table S3. Before matching, key differences between trial populations included a slightly more severe PsA population with greater CRP levels and a higher proportion of patients with PsO in the guselkumab trials [18, 19, 24, 25] compared to EXCEED [21].
Mixed PopulationPrimary AnalysisCharacteristics informing the primary analysis included prior use of anti-TNF inhibitors, Disease Activity Score-28, number of tender joints, number of swollen joints, enthesitis status, and PsO (≥ 3% of BSA).
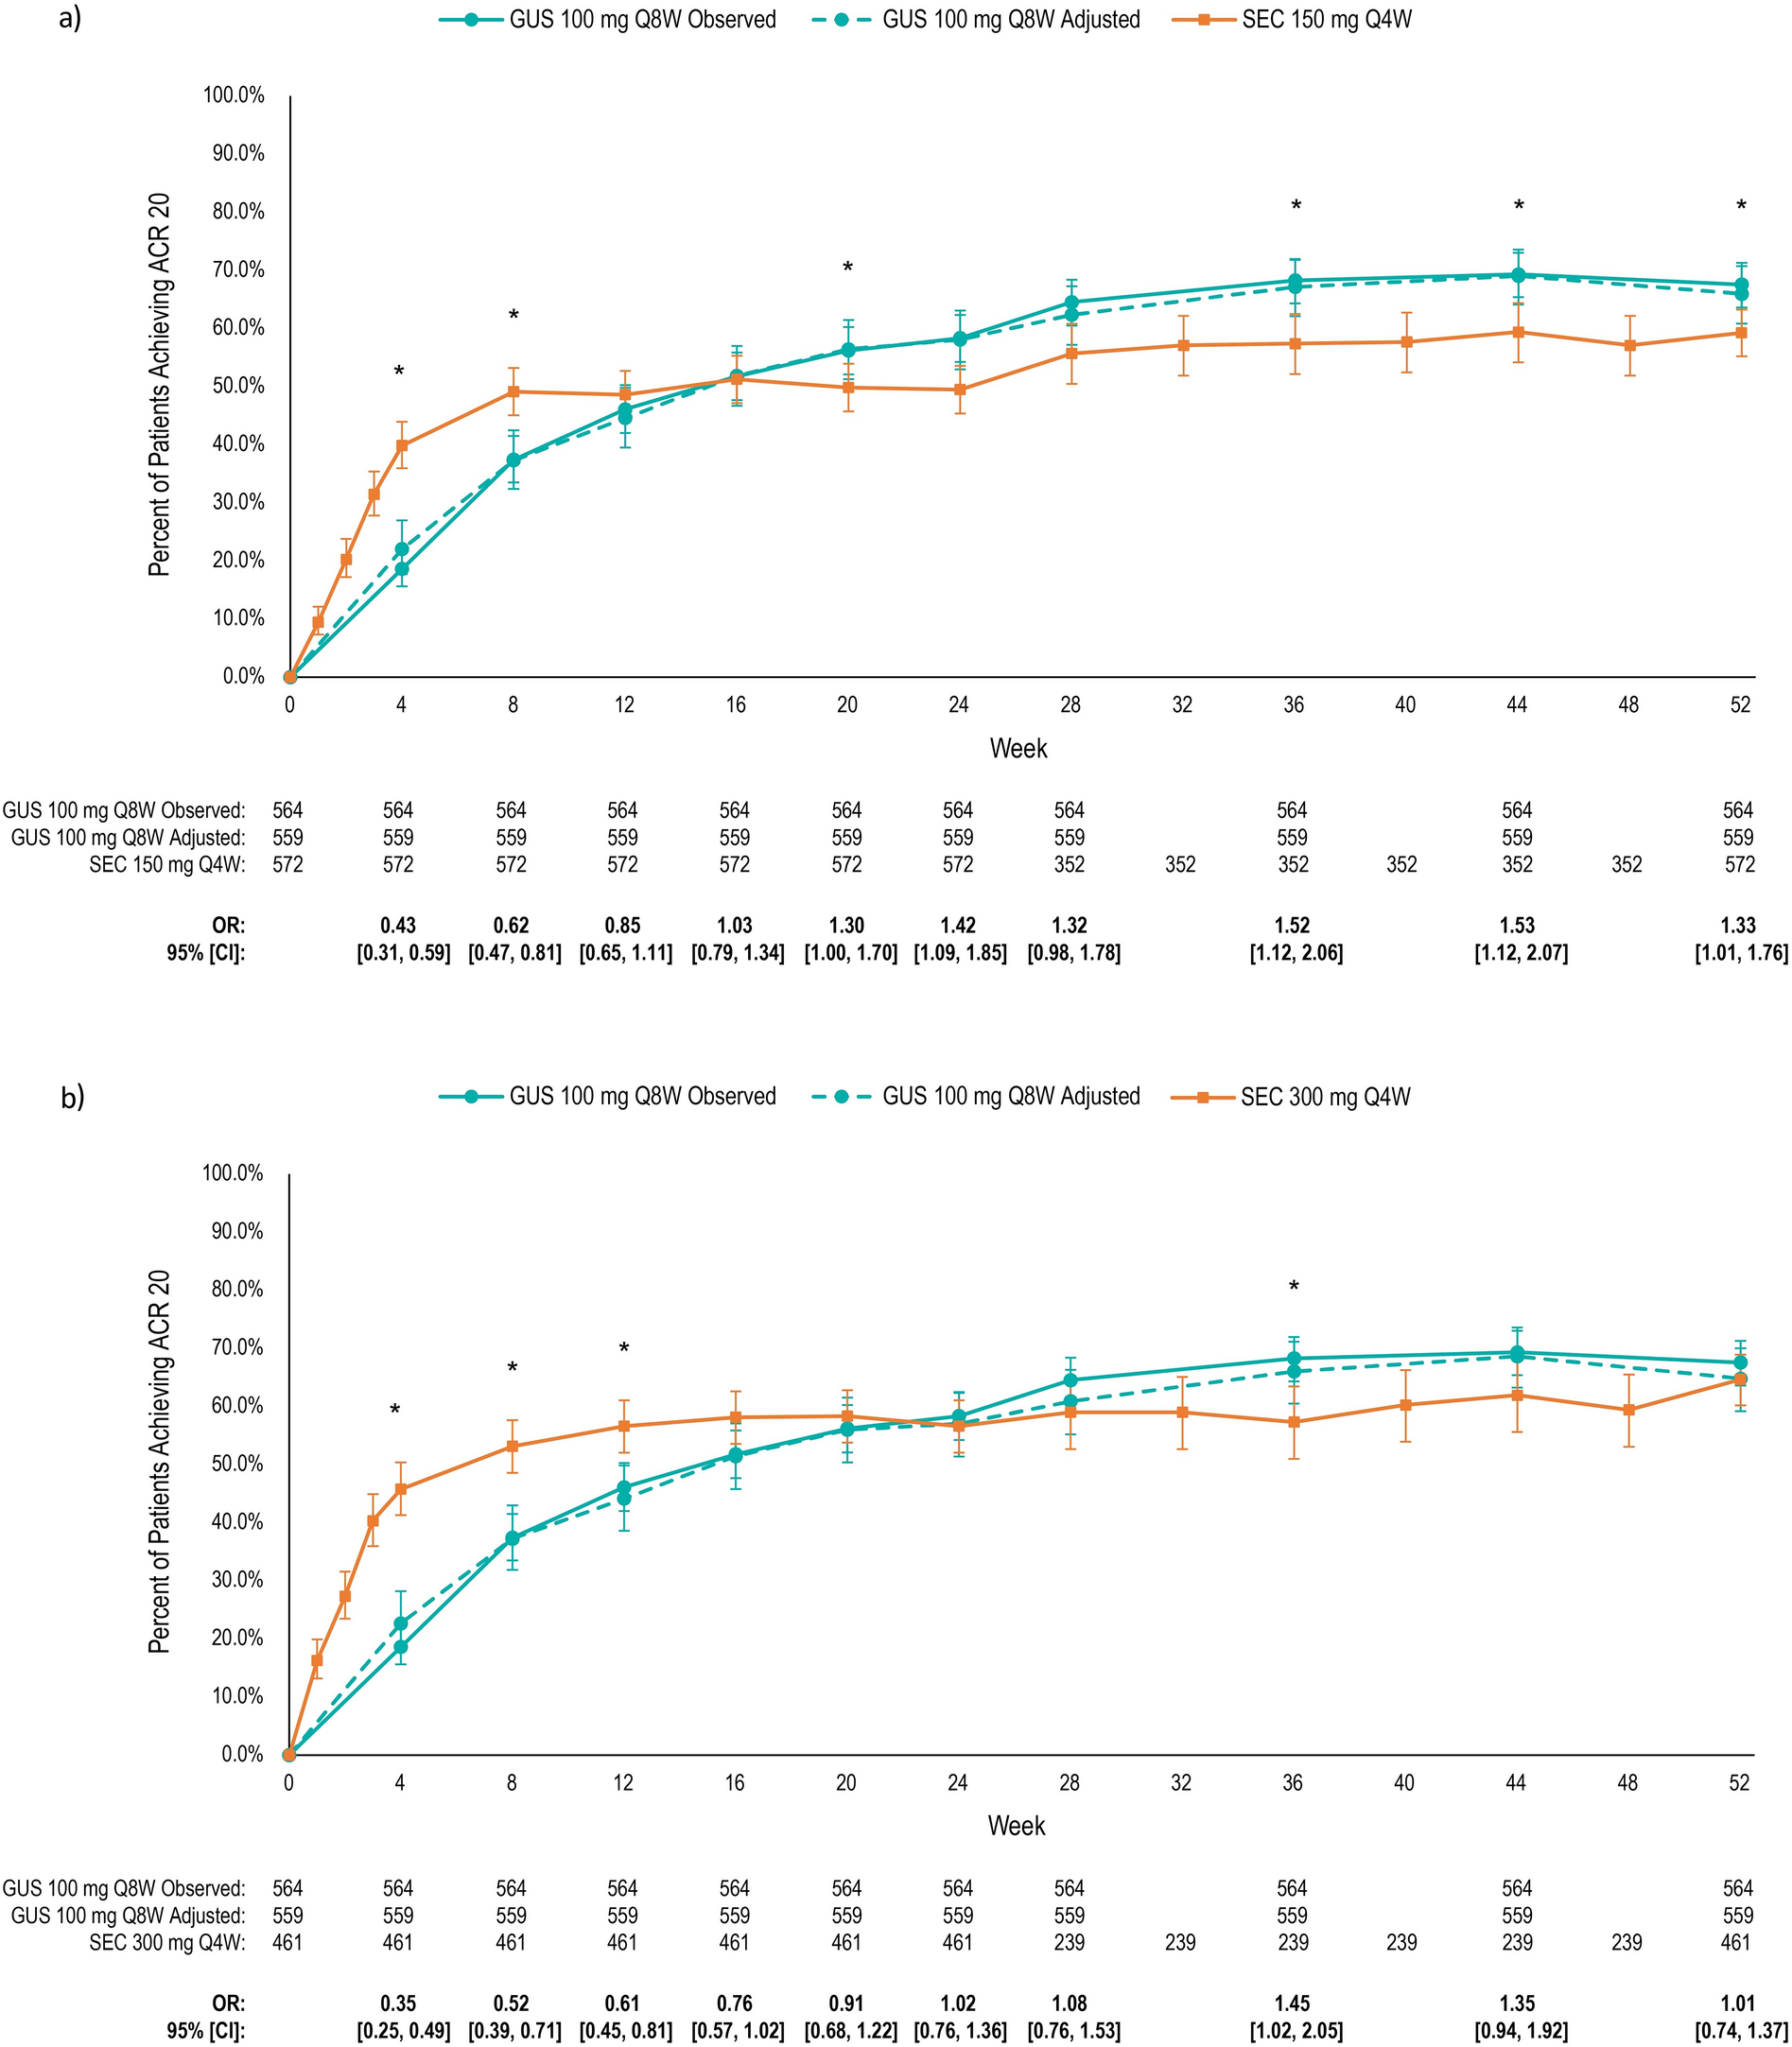
ACR 20 ResponsesGuselkumab Q8W vs. Secukinumab 150 mg: At weeks 4 and 8, ACR 20 responses were significantly lower for guselkumab Q8W. From week 16 onward, ACR 20 responses were numerically or significantly higher for guselkumab Q8W (week 52: 66.0% vs. 59.3%; OR = 1.33, 95% CI 1.01, 1.76; Fig. 1a).
Fig. 1
Observed and matching-adjusted ACR 20 responses for guselkumab 100 mg Q8W versus a secukinumab 150 mg Q4W and b secukinumab 300 mg Q4W. Note: No patients were excluded from the IPD data. *The OR for GUS (adjusted) vs. SEC is statistically significant (P ≤ 0.05). Characteristics matched: prior anti-TNF inhibitor use, disease activity score-28, tender joint count (of 68 joints), swollen joint count (of 66 joints), enthesitis, and psoriasis affecting ≥ 3% of body surface. ACR American College of Rheumatology, CI confidence intervals, GUS guselkumab, IPD individual patient data, OR odds ratio, Q4W every 4 weeks, Q8W every 8 weeks, SEC secukinumab, TNF tumor necrosis factor
Guselkumab Q8W vs. Secukinumab 300 mg: ACR 20 responses were numerically or significantly lower for guselkumab Q8W until week 20, then numerically or significantly higher from week 24 onward (week 52: 64.8% vs. 64.6%; OR = 1.01, 95% CI 0.74, 1.37; Fig. 1b).
Guselkumab Q4W vs. Secukinumab 150 mg: ACR 20 responses were significantly lower for guselkumab Q4W at week 4 and 8, but numerically or significantly higher from week 12 onward (week 52: 68.3% vs. 59.3%; OR = 1.48, 95% CI 1.00, 2.19; Fig. 2a).
Fig. 2
Observed and matching-adjusted ACR 20 responses for guselkumab 100 mg Q4W versus a secukinumab 150 mg Q4W and b secukinumab 300 mg Q4W. Note: No patients are excluded from the IPD data. *The OR for GUS (adjusted) vs. SEC is statistically significant (P ≤ 0.05). Characteristics matched: prior anti-TNF inhibitor use, disease activity score-28, tender joint count (of 68 joints), swollen joint count (of 66 joints), enthesitis, and psoriasis affecting ≥ 3% of body surface. CI confidence intervals, GUS guselkumab, IPD individual patient data, OR odds ratio, PASI Psoriasis Area and Severity Index, Q4W every 4 weeks, SEC secukinumab, TNF tumor necrosis factor
Guselkumab Q4W vs. Secukinumab 300 mg: ACR 20 responses were numerically or significantly lower for guselkumab Q4W from weeks 4 to 16, but numerically higher from week 24 onward (week 52: 68.7% vs. 64.6%; OR = 1.20, 95% CI 0.78, 1.84) (Fig. 2b).
ACR 50 ResponsesResults for ACR 50 responses mirrored those for ACR 20 (Supplementary Figures S2 to S5), with a similar pattern of numerically or significantly lower ACR 50 responses for both guselkumab doses compared to both secukinumab doses at earlier timepoints (week 28 or earlier), followed by generally numerically higher responses through to week 52.
ACR 70 ResponsesInitial responses (up to week 24) for ACR 70 showed a similar pattern to ACR 20 and 50 responses (Supplementary S6 to S9), with numerically or significantly lower ACR 70 responses for both guselkumab doses compared to both secukinumab doses. Both guselkumab doses had numerically higher ACR 70 responses from week 28 through to week 52 compared to secukinumab 150 mg, except at week 52, where ACR 70 response for guselkumab Q4W was slightly lower than secukinumab 150 mg. There were no data for secukinumab 300 mg between weeks 24 and 52, but at week 52, ACR 70 responses for both guselkumab doses were only slightly lower than secukinumab 300 mg.
PASI ResponsesPASI 90 data were only available at weeks 16, 24, and 52 for secukinumab 150 mg Q4W, and at weeks 24 and 52 for secukinumab 300 mg Q4W.
Guselkumab Q8W vs. Secukinumab 150 mg and 300 mg: Guselkumab Q8W had numerically higher PASI 90 responses than secukinumab 150 mg at all timepoints assessed, with statistical superiority at weeks 24 and 52 (71.7% vs. 43.1%; OR = 3.35, 95% CI 2.43, 4.60; Fig. 3a). Similarly, guselkumab Q8W had significantly higher PASI 90 than secukinumab 300 mg at both assessed weeks 24 and 52 (71.0% vs. 56.3%; OR = 1.90, 95% CI 1.33, 2.71; Fig. 3b).
Fig. 3
Observed and matching-adjusted PASI 90 responses for guselkumab 100 mg Q8W versus a secukinumab 150 Q4W and b secukinumab 300 mg Q4W. Note: No patients were excluded from the IPD data. *The OR for GUS (adjusted) vs. SEC is statistically significant (P ≤ 0.01). Characteristics matched: prior anti-TNF inhibitor use, disease activity score-28, tender joint count (of 68 joints), swollen joint count (of 66 joints), enthesitis, and psoriasis affecting ≥ 3% of body surface. CI confidence intervals, GUS guselkumab, IPD individual patient data, OR odds ratio, PASI Psoriasis Area and Severity Index, Q4W every 4 weeks, Q8W every 8 weeks, SEC secukinumab, TNF tumor necrosis factor
Guselkumab Q4W vs. Secukinumab 150 mg and 300 mg: Like guselkumab Q8W, guselkumab Q4W had numerically higher PASI 90 responses than secukinumab 150 mg at all timepoints assessed, with statistical superiority at weeks 24 and 52 (75.5% vs. 43.1%; OR = 4.07, 95% CI 2.74, 6.06; Fig. 4a). Compared to secukinumab 300 mg, guselkumab Q4W had significantly higher PASI 90 responses at weeks 24 and 52 (74.9% vs. 56.3%; OR = 2.31, 95% CI 1.49, 3.59; Fig. 4b).
Fig. 4
Observed and matching-adjusted PASI 90 responses for guselkumab 100 mg Q4W versus a secukinumab 150 Q4W and b secukinumab 300 mg Q4W. Note: No patients are excluded from the IPD data. *The OR for GUS (adjusted) vs. SEC is statistically significant (P ≤ 0.02). Characteristics matched: prior anti-TNF inhibitor use, disease activity score-28, tender joint count (of 68 joints), swollen joint count (of 66 joints), enthesitis, and psoriasis affecting ≥ 3% of body surface. CI confidence intervals, GUS guselkumab, IPD individual patient data, OR odds ratio, PASI Psoriasis Area and Severity Index, Q4W every 4 weeks, SEC secukinumab, TNF tumor necrosis factor
Sensitivity AnalysisThe sensitivity analysis for the mixed population matched for characteristics informing the primary analysis and additional characteristics, including sex, age, dactylitis, and PsA pain, if reported. The sensitivity analysis demonstrated similar results to the primary analysis for ACR 20 response (Supplementary Figures S10, S11, S12, and S13). In general, both doses of guselkumab had numerically or significantly higher ACR 20 responses compared to secukinumab 150 mg from week 16 onward and secukinumab 300 mg from weeks 24–28 onward.
For PASI 90 response (Supplementary Figures S14, S15, S16, and S17), results from the sensitivity analysis were consistent with the primary analysis with significantly higher responses for both doses of guselkumab versus both doses of secukinumab at weeks 24 and 52, with one exception. In contrast to the primary analysis, numerical, but no statistical superiority was achieved for guselkumab Q4W versus secukinumab 300 mg at week 24 (57.3% vs. 46.9%; OR = 1.51, 95% CI 0.98, 2.33) (Supplementary Figure S17).
Scenario Analysis for the Biologic-Naïve PopulationCharacteristics informing the scenario analysis for the biologic-naïve population included Disease Activity Score-28, number of tender joints, number of swollen joints, CRP > 10 mg/l, enthesitis status, PsO (≥ 3% of BSA), and baseline PASI score.
Compared to secukinumab 300 mg, ACR 20 responses for guselkumab Q8W (66.6% vs. 66.9%; OR = 0.98, 95% CI 0.67, 1.44) were comparable, while ACR 20 responses for guselkumab Q4W were numerically higher (71.6% vs. 66.9%; OR = 1.25, 95% CI 0.84, 1.85) (Supplementary Figure S18a and b).
Comments (0)