
Remember me


The present cost-effectiveness analysis used a cohort state-transition model with two different MSM approaches, informed by individual patient-level (IPD) data from three, single-arm, clinical studies of eladocagene exuparvovec [17,18,19] to compare with BSC. This study updates a previously published model [22] by using a new modeling approach and longer follow-up data and health state utilities for AADCd. The new modelling approach is presented here as the base case, and the approach used in the original study is presented as a scenario analysis.
2.1 Model structureThe cost-effectiveness model was structured as five motor function-related health states:
i.No motor function
ii.Full head control
iii.Sitting unassisted
iv.Standing with support
v.Walking with assistance
along with death as an absorbing state (Fig. 1, Table 1). Outcomes were modeled over two phases. During the first phase (the developmental phase), comparative effectiveness of the treatment arms was modeled as differential achievement of motor milestones, with patients able to achieve improvement in (i.e., “higher”) motor milestones. In the second phase of the model (the long-term phase), patients were assumed to maintain the highest motor milestone that they achieved during the developmental phase. Mortality risk was modeled in both phases.
Fig. 1
Model diagram. Bold lines reflect transitions between alive health states (without skipping motor milestones); dashed lines reflect transitions to mortality. In Scenarios 2 and 3, skipped milestone achievement was imputed at the midpoint between corresponding adjacent visits, and only transitions 1–4 were modeled in the developmental phase. In the base-case analysis (reflected above), transitions 1–10 were estimated allowing skipping in the MSM, for the N = 30 patients treated in clinical studies AADC-1601, AADC-010, and AADC-011(data on file). Motor milestone achievement with eladocagene exuparvovec was estimated based on multiples of the MSD of total PDMS-2 score, as it is expected to predict improvement in motor function with high certainty, and to be more sensitive to change than the five-level classification of motor milestones. FHC, full-head control; MSD, meaningful score difference; MSM, multistate survival modeling; no motor function, NMF; PDMS-2, Peabody Developmental Motor Scales-Second Edition sitting unassisted, SU; standing with support, SWS; WWA, walking with assistance
Table 1 Health state definitions, multiples of meaningful score difference, utilities (described by Monteleone et al. [21]), and disutilities (described by Landfeldt et al. [33])In the original model [22], motor milestone achievement was assessed based on scores for 4 items of the PDMS-2 (see Sect. 2.8) using data from clinical trials AADC-1601, AADC-010, and AADC-011 [17,18,19]. In the base case for this study, using updated PDMS-2 score data from those trials, MSM was conducted for the achievement of multiples of the MSD of total PDMS-2 score. MSD of total PDMS-2 score in AADCd was previously estimated at 40 points in an analysis anchoring improvement in motor milestones. The MSD of 40 points had specificity > 0.95 (false positive rate < 5%) for predicting improvement in motor milestones [20]. Multiples of the MSD were mapped to the corresponding motor milestone states (Table 1), and cumulative incidence of achieving each multiple of the MSD, conditional on the prior multiple, was modeled. In previously published research [20], using the MSD for Total PDMS-2 score to define health states has been shown to provide greater sensitivity in measuring improvements compared with motor milestone achievement because it captures a broader range of both gross and fine motor domains (reflexes, stationary performance, locomotion, object manipulation, grasping, visual-motor integration; Fig. A1). As a result, improvement can be ascertained earlier than using the motor milestone approach [23, 24]. Further, patient-level correlations between measures collected in clinical studies of eladocagene exuparvovec indicate a high level of association between cognitive development and motor function. In particular, correlations between change from baseline in total PDMS-2 and Bayley-III scores (cognition and language domains) were of large magnitude and statistically significant from month 6 onwards: r = 0.599 (p = 0.0032) at month 6, r = 0.796 (p = 0.0002) at month 18, and r = 0.861 (p = 0.0007) at month 60 [20]. Accordingly, capturing improvements in motor function may act as a proxy for impacts on other symptoms and consequences. Between the two approaches, the motor milestone approach (presented here as a scenario analyses) may be considered the more conservative analysis.
The model was developed in Microsoft® Excel® for Microsoft 365 MSO 64-bit and R statistical software, version 4.2.3 (R Foundation for Statistical Computing) was used for the MSM.
2.2 Study PopulationThe modeled population reflected N = 30 patients from clinical studies AADC-1601 (n = 8), AADC-010 (n = 10), and AADC-011 (n = 12) (as well as the long-term extension study AADC-1602). Patients had a diagnosis of AADC deficiency with a classical presentation of the disease (i.e., with complications such as developmental retardation, hypotonia and oculogyric crises). Mean (SD) age was 1.1 (0.7) years at diagnosis and 3.8 (2.2) years at treatment; 14 patients (46.7%) were female. All patients started the model from the no motor function health state, at baseline age of 4 years (reflecting the mean in clinical studies) [17,18,19].
2.3 ComparatorEladocagene exuparvovec efficacy and safety have been studied in the AADC-1601, AADC-010, and AADC-011 clinical trials [17,18,19], as well as the extension study AADC-1602, which evaluated long-term outcomes of patients with AADCd without head control at baseline.
2.4 Perspective of AnaslysisThe analysis was conducted from a modified US societal perspective. The modified perspective reflects quality-of-life impacts to parents and caregivers, beyond impacts on patients.
2.5 Time HorizonThe model had a lifetime horizon and cycle length of 3 months (the shortest interval between visits in the clinical studies).
2.6 Model ParametersAn overview of the model parameters can be found in Table 2.
Table 2 Model input sources2.6.1 Progression of Disease Under BSCAs previously described [22], the composition of BSC was informed by the International Working Group on Neurotransmitter Related Disorders guidelines [4] and the results of a clinician survey. BSC efficacy was based on published natural history data [12]. In the natural history study, patients who were aged < 4 years on average, had not achieved full head control (or a higher motor milestone) at diagnosis, and were treated with BSC, provide a comparable sample of patients to those treated with eladocagene exuparvovec in the three aforementioned clinical studies. Within approximately 1 year of BSC treatment, the highest motor milestone achieved was walking with assistance for 1.45% (n = 1/69) of patients, and sitting unassisted for another 1.45% [12]. Accordingly, during the developmental phase, the highest motor milestone achieved with BSC was modeled as 1.45% walking with assistance, 1.45% sitting unassisted, and 97.10% no motor function.
2.6.2 Treatment EfficacyLonger-term clinical trial data [17,18,19] than were included in the original CEA analysis [22] were incorporated in this model, for the 30 patients treated with eladocagene exuparvovec. Data up to June 2023 included motor milestone achievement observed over a follow-up of ≥ 2 years for 26 (87%), and ≥ 5 years for 19 (63%) patients (follow-up range 0.75–10 years). On the basis of these data, in the base case, at the end of the 12-year developmental phase 0.00% of patients were assumed to be in the NMF health state; 12.86% in the FHC health state, 21.44% in sitting unassisted (SU); 15.78%, SWS; and 49.91%, WWA. Among patients with 5 + years of data, a sustained treatment effect has been supported by emission tomography data that demonstrated the durability of gene transduction effect and were consistent with the durability of motor milestone development [19]. Over the study period, the majority of patients achieved ≥1 motor milestones [19]. Of further note, over the course of the clinical trial follow-up, few severe, treatment-related adverse events were reported [17, 19].
2.6.3 SurvivalMortality was modeled as including disease-related risk varying by motor milestone state and background mortality (i.e., of the general population), which was consistent across health states. Background mortality was modeled based on US life tables [25]. As there is currently no published survival data for patients with AADCd, disease-related mortality risk associated with motor milestone health states was informed by an analog condition, cerebral palsy [26], which was previously confirmed by clinical experts as an appropriate proxy [22, 26]. Survival data for those with cerebral palsy were adapted for patients with AADCd by mapping the estimates based on motor function states and feeding ability in cerebral palsy to the health states used in the present model for AADCd (Supplementary Fig. B1). Parametric models (exponential, Weibull, Gompertz, log-normal, log-logistic, and gamma) were estimated, and the best fitting models were identified based on goodness-of-fit statistics and clinical plausibility of the extrapolations (see Supplementary Information A). Modeled survival curves for full head control, sitting unassisted, standing with support, and walking with assistance health states closely aligned with the estimates for cerebral palsy. For the no motor function health state, the modeled survival was slightly lower than the estimates for cerebral palsy, with a median survival of 15 years modeled for AADCd versus approximately 15–20 years for cerebral palsy. According to clinical expert input, the median survival of 15–20 years would be longer than expected for a patient with AADCd and no motor function [27].
2.6.4 Adverse EventsThe model incorporated adverse events (AEs; moderate, serious and severe) from the three clinical trials (Supplementary Tables C1, C2). The AEs incorporated were eladocagene exuparvovec treatment-related and thus applied to that treatment arm and were assumed to occur only in the cycle immediately after treatment administration [28], AEs owing to treatment with BSC were expected to be included into the disease management cost estimates for the management of AEs sourced from Optum360 (2012) by diagnosis-related group (DRG) codes, as well as health-state disutilities [29].
2.6.5 Healthcare Resource UseModeling of healthcare resource use (HCRU) included follow-up healthcare visits, medical procedures, technical procedures and resources, and BSC pharmacotherapies, and was costed based on unit costs (see Supplementary Tables C1, C2, C3, C4, C5). HCRU varied by motor-milestone health state, as well as by treatment arm (i.e., BSC versus eladocagene exuparvovec). Estimates of HCRU modeled were based on Saberian et al. [30], who report HCRU estimates by disease severity (NMF or FHC, n = 8; SU or SWS, n = 2; WWA, n = 10). These estimates were mapped to the motor-milestone states. As a result of limited data for the SU and SWS states, HCRU for SWS is assumed to be the same as that for WWA, and HCRU for SU is assumed to be the average of the NMF/FHC and WWA estimates.
2.6.6 CostsUnit costs can be found in Supplementary Table C1.
2.6.6.1 State CostsOnly direct healthcare-related costs are considered due to data limitations regarding indirect costs (i.e., nonhealthcare related costs including work productivity of patients, work productivity of parents/informal caregivers, formal caregiving costs, home-modification costs, transportation costs). Cost categories reflected in the model included those that are relevant to the management of AADCd: follow-up healthcare visits, medical procedures, and technical procedures and resources (see Supplementary Tables C3–C5). Cost estimates were based on 2024 Current Procedural Terminology (CPT®) codes listed by the Centers for Medicare and Medicaid Services (CMS) [31]. For each cost category, unit costs were multiplied by the frequency of healthcare resource use within each cycle. The cost was applied to the distribution of patients in each motor milestone state per cycle, to calculate total costs. Cost estimates for the management of AEs were sourced from Optum360 (2021) by diagnosis-related group (DRG) codes [29]. A summary of estimated costs by health states in the base case can be found in supplementary table D4.
2.6.6.2 BSC CostsThe proportion of patients using BSC was specified by motor milestone health state and treatment arm (Supplementary Table C6). All patients treated with eladocagene exuparvovec were assumed to continue BSC treatment thereafter. List prices of BSC pharmacotherapies in the US were sourced from Merative Micromedex Red Book 2024 [32].
2.6.6.3 Eladocagene Exuparvovec-Tneq CostsFor costing of eladocagene exuparvovec-tneq treatment, the list price (wholesale acquisition cost, WAC) in the USA of $3,950,000 (per 2.8 × 10¹¹ vg vial) was used [32], as well as the cost of administration to the putamen of the brain through a stereotactic neurosurgical procedure. The cost of administration, $106,030, is a proxy value for the cost of the stereotactic procedure (reflecting mean total hospital charges for selective dorsal rhizotomy at age ≤ 18 years, Optum360) [29].
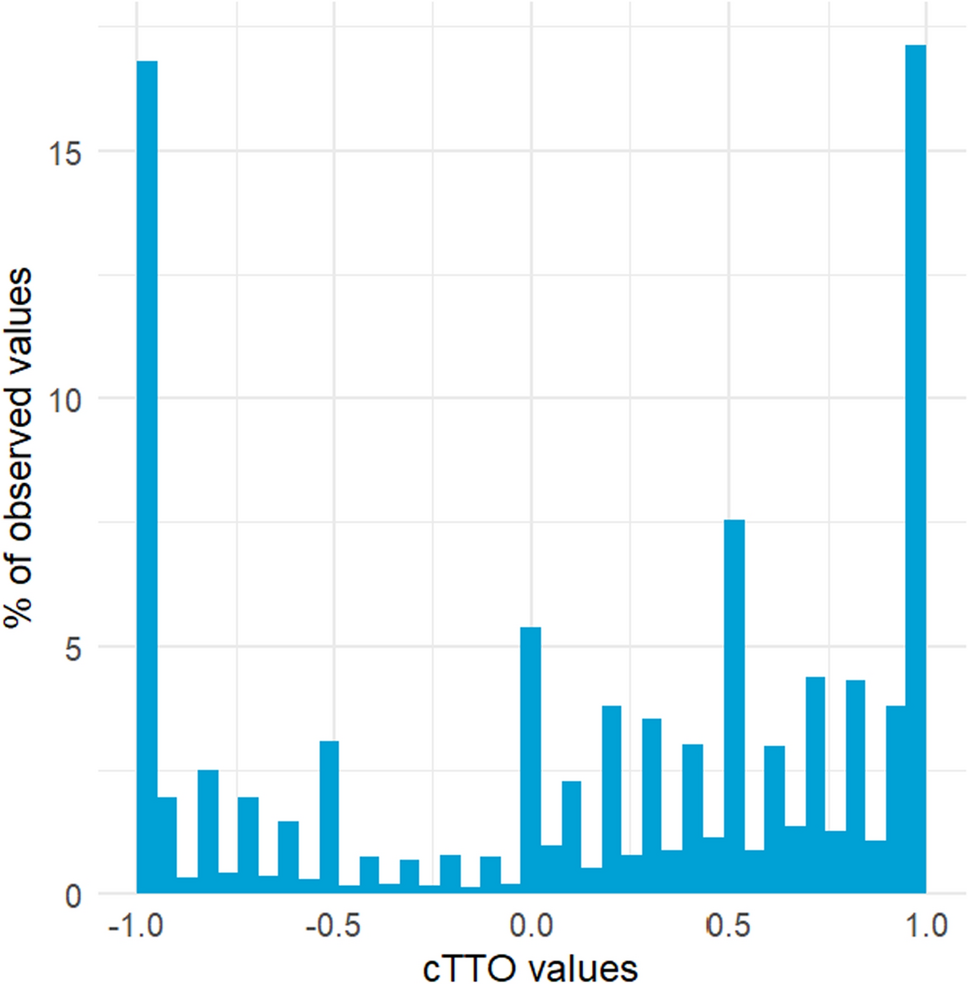
2.6.7 UtilitiesHealth state utilities were from a US time-trade-off (TTO) study valuing the quality-of-life impact of AADCd by motor milestone state [21] (Table 1). The impacts of variation in motor function on patients with AADCd were described across five motor milestone state “vignettes.” TTO assessment of the quality-of-life variation between the health states was then assessed by a general population sample of N = 120 individuals in the USA [21].
Caregiving for a patient with AADCd has a profound impact on caregivers’ quality of life, affecting physical health and emotional wellbeing, social/leisure activities, relationships, work, and finances [9]. Thus, disutility estimates reflecting caregiver burden were considered from a proxy condition, Duchenne muscular dystrophy [33], and scaled according to the relative patient health utility modeled on the basis of the TTO study described above (Table 1), on the basis that caregiver burden is expected to vary with the health of their patients. The number of caregivers was based on a previous National Institute for Health and Care Excellence (NICE) evaluation of risdiplam in SMA (TA755) [34], and assumed to be reduced with improved motor function. The number of caregivers required per patient (and accordingly, experiencing disutility) was modeled as 2.2 in the NMF health state, and reduced linearly to 1.2 in the WWA health state, reflecting reduced burden with improved patient motor function. In addition, the quality-of-life impact of a patient’s death on parents was incorporated into the model as a bereavement disutility, which was obtained from Song et al. [35]. In that study the long-term effects of child death on bereaved parents was examined; both mothers and fathers experienced an ongoing utility decrement of 0.04, as observed after more than 35 years. Song et al. [35] reported the mean age of parents at their child’s death as 25.7 years for males and 28.1 years for females. For parents who experienced the death of a patient before age 55 years, it was assumed that both parents would experience an annual 0.04 disutility until age 80 years.
Disutilities of AEs for eladocagene exuparvovec were modeled on the basis of published estimates [28].
2.7 Model OutcomesThe model’s primary outcomes were overall quality-adjusted life years (QALYs), overall costs, incremental life years (LYs), incremental QALYs, and the incremental cost-utility ratio (ICUR) for eladocagene exuparvovec versus BSC. Treatment outcomes, namely expected LYs, QALYs, and costs, were calculated separately by treatment arm, as well as incrementally (i.e., eladocagene exuparvovec versus BSC). All analyses are presented as discounted (3% annually), with undiscounted analyses presented in the appendix. Overall survival was also calculated for each treatment. Note that eladocagene exuparvovec acquisition, administration, and adverse event costs are not discounted as these occur in the first cycle.
2.8 Scenario AnalysesSeveral scenario analyses were conducted, characterizing alternative versions of the MSM analyses. In the first, aligning with the outcome modeled for eladocagene exuparvovec in the previously published CEA [22], motor milestone achievement (no motor function, full head control, sitting unassisted, standing with support, walking with assistance) was modeled based on updated (longer-term) data from clinical studies [20]. Motor milestone achievement was assessed in study AADC-1601, and served as the primary efficacy endpoint in studies AADC-010 and AADC-011, based on five classification levels [17,18,19]. Classification levels included no motor function, as well as four determined based on the following four components of the PDMS-2: full head control (Stationary item 10), sitting unassisted (Stationary item 14), standing with support (Locomotion item 28), and walking with assistance (Locomotion item 34). Achievement of these items was defined as mastery (PDMS-2 item score of 2 points) or emerging/partial mastery (PDMS-2 item score of 1 point).
Additional scenarios were also considered (1) omitting two patients with follow-up <12 months in clinical studies, for whom the required “independence assumption” of the MSM may not hold, and (2) imputing achievement of “skipped” milestones at the midpoint of the time between corresponding adjacent visits in the clinical studies (Fig. 1). These scenarios were informed by appraisal of the clinical validity of the MSM approach by clinical-expert authors, with rationale as described further in the supplementary materials. Eladocagene exuparvovec efficacy inputs for these scenario analyses (scenarios 2–6) can be found in Supplementary Table C7.
Finally, a scenario analysis was run excluding caregiver and bereavement disutility.
2.9 Probabilistic Sensitivity AnalysisProbabilistic sensitivity analysis (PSA) was conducted to assess the combined impact of parameter uncertainty on the base-case results using the total PDMS-2 MSD approach. Variables for which parameter values were sampled in the PSA included: percentage female, baseline age, disease-related mortality, motor milestone achievement, health state utility values, disutility from caregiver burden, disutility from bereavement, disutility from AEs, AE incidence, AE duration, and healthcare resource use estimates. The PSA was conducted using Monte Carlo simulation over 1000 iterations, with parameters and associated distributions described further in Supplementary Table C8.
2.10 ValidationThe use of motor function-related health states in the model was determined on the basis that impaired motor development is among the most important consequences of AADCd. This choice reflects available natural history evidence and was confirmed in advisory board meetings by clinical experts (n = 8) from six countries selected for their previous experience with economic models for rare diseases. Three participants also had previous experience with advanced therapy medicinal products (ATMPs). Qualitative modelling insights were collected during two separate meetings by using metric tools and questionnaires to measure the level of consensus, both in real-time and in between the discussions.[22, 27] The model’s five motor milestone health states were informed by five motor milestone state “vignettes,” which were validated by N = 5 healthcare professionals with experience managing AADCd and N = 4 caregivers of patients with AADCd [21]. Face validity of model inputs, results, and assumptions were reviewed with clinical-expert authors of the manuscript. Mortality risk associated with motor milestone health states was informed by an analog condition, cerebral palsy, which was previously confirmed by clinical experts as an appropriate proxy [22].
To inform the appropriateness of MSM compared with a Markov transition model, the fit of nonconstant-hazard parametric models (i.e., Weibull, Gompertz, log-normal, log-logistic, and gamma) was compared with an exponential parametric model for each transition (i.e., no motor function to higher milestone, full head control to higher milestone, SU to higher milestone, SWS to WWA). Best fit was assessed by lowest Akaike information criterion (AIC) and Bayesian information criterion (BIC). The computerized CEA model was examined by study authors with experience conducting health-economic modeling and who were not primary developers of the model. Additional details on model validation can be found in Supplementary Information A, including the Assessment of the Validation Status of Health-Economic decision models (AdViSHE) tool (Table A1).
2.11 Ethics StatementThis study used de-identified secondary data and therefore did not require ethical approval or individual patient consent.
Comments (0)