The study followed a ‘lite’ version of the EuroQol’s EQ-5D-5L valuation protocol [22] and used the latest available version of EuroQol Valuation Technology (EQ-VT) (version 2.1) [23,24,25], a computer-assisted personal interviewing program, to collect preferences data from a sample of the general adult population in Singapore. The study received approval from the Institutional Review Board of the National University of Singapore (NUS-IRB-2022-598).
2.1 The ‘Lite’ EQ-5D-5L Valuation Protocol
This ‘lite’ EQ-5D-5L valuation protocol was first used in an EQ-5D-5L valuation study in Uganda [22]. It was developed for use when recruiting a large general population sample is either infeasible or very expensive. Different from the standard protocol, the ‘lite’ protocol requires a sample size of only 500 individuals and includes only composite time trade-off (cTTO) valuation tasks. However, each individual needs to complete 20 cTTO tasks in contrast to 10 cTTO tasks per individual in standard EQ-5D-5L valuation studies. Five blocks of 20 health states were generated from the 10 blocks of health states (each comprising 55555) used in the standard protocol by pairing the blocks and then replacing one of the two 55555 states in each combined block with one of the five second-poorest health states (i.e. 45555, 54555, 55455, 55545, and 55554). As a result, a total of 91 health states (i.e. 86 states from the standard protocol plus the five second-poorest states) were included for valuation in the ‘lite’ protocol. Each participant in our study was randomly assigned to one of the five health-state blocks for valuation. As the ‘lite’ protocol was proven to be feasible and we had limited resources, we elected to use this new protocol in the current valuation study, which was approved by the EuroQol Research Foundation.
2.2 Sampling and Recruitment
Singapore is a multi-ethnic society comprising primarily Chinese, Malay, and Indian communities, with 87% of the population being literate in either English or Chinese [26]. We used a quota sampling method to ensure the distributions of age, sex, ethnicity, and education of the study sample resemble those reported for the Singapore 2021/2022 population [27, 28].
Participants were initially recruited from the Singapore Multi-Ethnic Cohort study, which comprised more than 20,000 residents, and is maintained by the Saw Swee Hock School of Public Health at the National University of Singapore [29, 30]. As quotas for certain minority groups could not be filled, we also recruited additional participants using social media advertisements. In collaboration with administrators of the cohort study and local online communities, we invited potentially eligible individuals to register online, assessed their eligibility, and then invited eligible individuals to fill preset quotas. The inclusion criteria for the study were as follows: (1) individuals aged 21 years or older, which is the legal age of adulthood in Singapore; (2) able to read and communicate in either English or Chinese; and (3) physically and mentally capable of completing an interview, either in-person or via Zoom. The exclusion criterion was prior participation in an EQ-VT study. Participation in the study was voluntary, and participants were compensated with SGD40 (approximately US$30).
2.3 Data Collection
Each eligible participant was invited to a computer-assisted interview using the EQ-VT program. The interviews were conducted either face-to-face or via video conferencing. While the EQ-VT program was designed for in-person interviews, it was adapted for video conferencing during the coronavirus disease 2019 (COVID-19) pandemic [31,32,33] and comparative studies showed that there were no significant differences in data collected using face-to-face or video-conferencing interviews [33, 34]. As individual preferences and practical concerns may play a role in study participation, both modes of administration were offered to maximize inclusion. The interviews were structured into four sections: Section 1 introduced the study, Section 2 captured participants' demographics and health status via the EQ-5D-5L questionnaire, Section 3 involved 20 cTTO valuation tasks preceded by a tutorial using an 'in wheelchair' example and three practices, and Section 4 assessed participants’ considerations behind their choices in the cTTO tasks using both closed-ended and open-ended questions.
All interviews were conducted by five research staff members and graduate students from the National University of Singapore who had recently conducted EQ-VT interviews as part of a multi-country EQ-5D-Y valuation study. Throughout the data collection period, interviewers’ performance was monitored as part of a standard quality control process developed by the EuroQol Group [35]. Specifically, two experienced data quality specialists periodically evaluated collected data and provided individualized feedback to interviewers. The evaluation was focused on potential quality issues including (1) less than 3 minutes spent explaining the wheelchair example, (2) failure to demonstrate the worse-than-dead element in the wheelchair example, (3) value for the ‘55555’ health state higher than any other value by 0.5 points, and (4) less than 5 minutes spent completing all the cTTO tasks.
2.4 Valuation Procedure
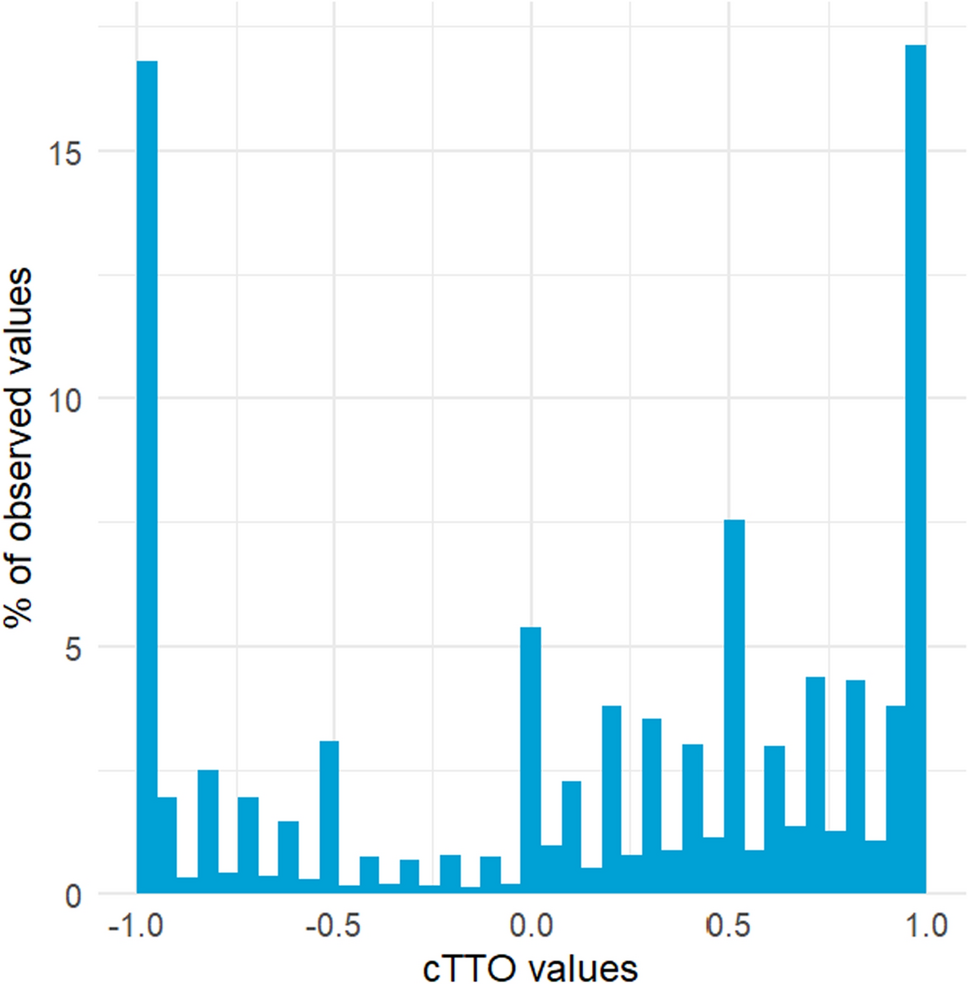
The cTTO approach combines the conventional time trade-off (TTO) (i.e. 10 years in an EQ-5D state) for valuing health states considered better than dead (BTD) and the lead-time TTO (i.e. 10 years in full health followed by 10 years in an EQ-5D state) for health states considered worse than dead (WTD). For each health state to be valued, respondents were first asked their preference between living in full health for 10 years and living in this state for 10 years. The length of time lived in full health varied each time by 1 or 0.5 years until the two options were indifferent to respondents. When respondents’ preferences indicated that a state was WTD (i.e. preferring 0 years in full health or ‘die now’ to living in the health state for 10 years followed by death), they were introduced into the lead-time TTO to choose between 10 years of full health (life A) and 10 years of full health followed by 10 years in the health state that is valued (life B). The number of years in life A was varied until indifference or 0 years was reached. Thus, a total of 41 unique values between 1 and − 1 could be expressed.
2.5 Data Analysis
Our data analysis consisted of four stages: data selection, model construction, model evaluation, and value set estimation.
2.5.1 Data Selection
We examined individual-level cTTO data and excluded respondents who valued all 20 health states as − 1 or whose values increased with health-state severity. Such respondents would be considered as failing to understand the valuation tasks.
2.5.2 Model Construction
Based on the design of recent EQ-5D valuation studies that we conducted or participated in [36,37,38,39,40], we constructed and tested a total of six tobit regression models in which the individual disutility value (i.e. 1 minus cTTO value) was regressed on the dimensional characteristics of valued health states. Tobit modelling was used because the cTTO values were censored at − 1.0. To ensure the model-predicted cTTO value for the full health state (i.e. 11111) was 1.0, the tested models did not include an intercept. The six models were as follows: (1) the conventional 20-parameter main-effects-only model (ADD20); (2) the 20-parameter model with two-way interaction terms (ADD20-I); (3) the 20-parameter model with a power function (ADD20-P); (4) the eight-parameter cross-attribute level effects (CALE) [41] model; (5) the CALE model with two-way interaction terms (CALE-I); and (6) the CALE model with a power function (CALE-P).
The interaction terms and power function were tested to relax the assumption that the relationship between cTTO value and health-state characteristics is linear. The inclusion of interaction and power terms is based on the concept of marginal disutility in health valuation. Two-way interaction terms capture inter-dimensional effects, while power terms account for overall marginal disutility. These specifications have demonstrated improved model performance in previous EQ-5D valuation studies [37, 42]. As our sample size did not allow inclusion of all possible interactions, we only specified 10 between-dimension interactions by treating the EQ-5D-5L dimension scales as continuous variables (range: 0 [no problems] to 4 [extreme problems]). For example, the value of the interaction between mobility and self-care for a health state in which mobility is at level 3 and self-care is at level 4 is (3 − 1) * (4 − 1) = 6. Detailed specifications of the models can be found in Table 1.
Table 1 Specifications of six candidate models2.5.3 Model Evaluation
Next, we used a cross-validation procedure to evaluate the models. Specifically, we used data from four of the five blocks of health states to estimate the models and used the remaining block to evaluate their performance. We repeated this analysis five times so that each health-state block was used for the purpose of validation. In each iteration, we examined (1) the significance and logical consistency of estimated model coefficients and (2) the out-of-sample prediction accuracy in terms of root mean squared error (RMSE), mean absolute error (MAE), and intraclass correlation coefficient (ICC). The averaged RMSE, MAE, and ICC from the five iterations were used to evaluate prediction accuracy of the tested models. For calculating RMSE, MAE, and ICC in each iteration, we used censoring-adjusted mean cTTO values of the 20 health states in the block for validation and the values predicted by the tested models. We chose to use censoring-adjusted means instead of observed means because the cTTO values were censored at − 1. To adjust for the censoring, we fitted the observed cTTO values of each health state consecutively into a tobit model with only the intercept term. As some of the 10 interaction terms might be insignificant, we used the entire sample and a backward selection method to identify significant interaction terms and included only those interaction terms in the cross-validation analysis. All the six model specifications were estimated with and without the heteroskedasticity of the cTTO data being accounted for.
2.5.4 Value Set Estimation
Finally, all the models were estimated using the entire dataset. Moreover, all the value sets were assessed for their logical consistency, namely, whether the predicted value for a health state is higher than the predicted value for another health state when the former is better than the latter according to their characteristics. This logical consistency was examined for a total of 759,375 pairs of EQ-5D-5L health states. All models were fitted using a non-linear mixed effects function from the xreg package (available at: www.github.com/intelligentaccident/xreg). A p value of less than 0.05 was adopted as the threshold for statistical significance in all analyses.


Comments (0)