
Remember me


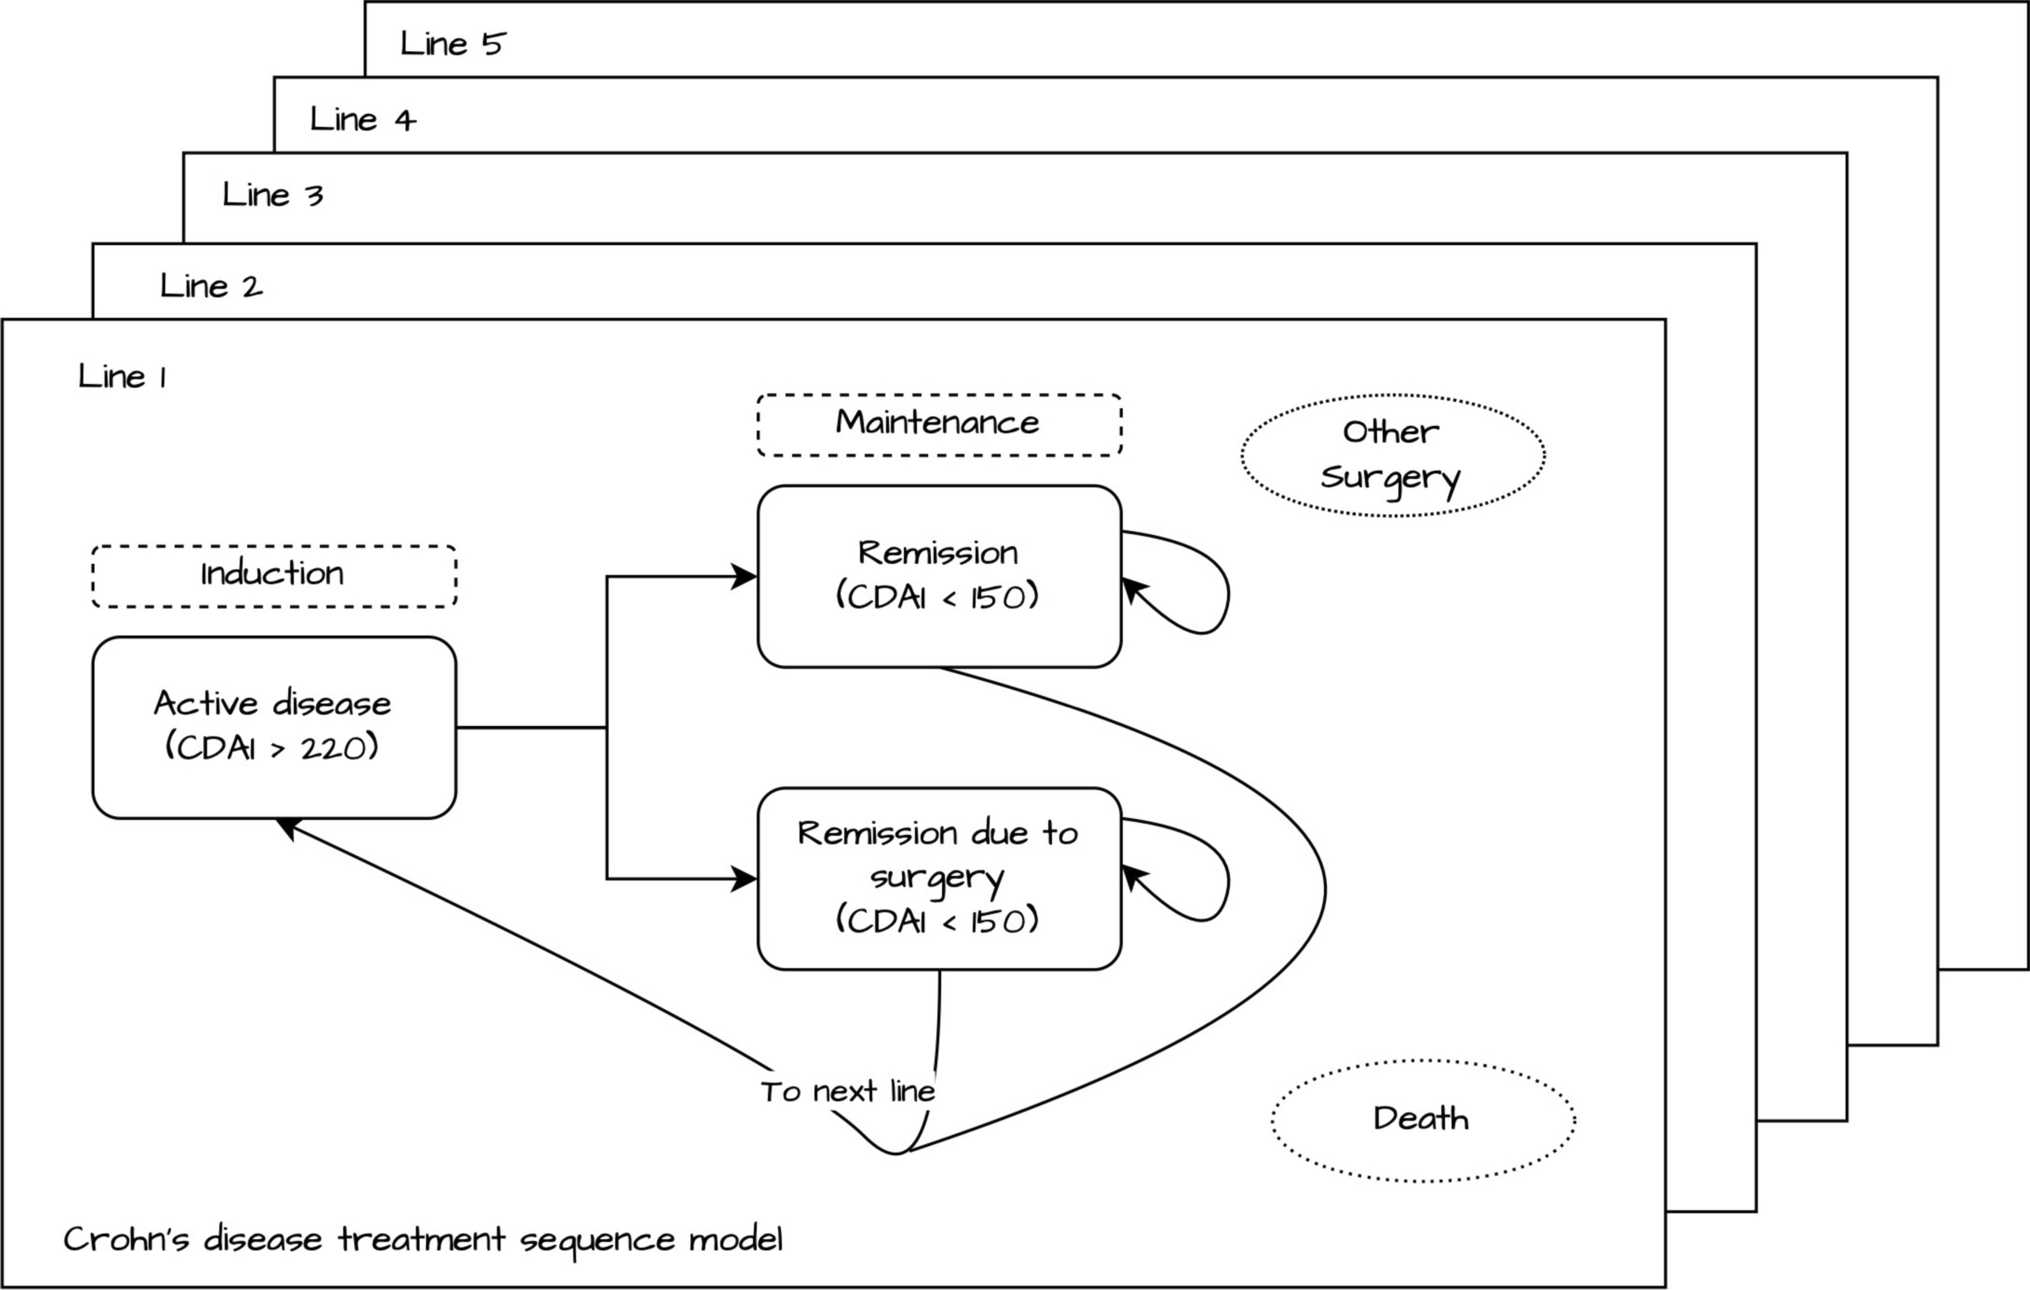

A conceptual model (Fig. 1) was developed on the basis of expert opinion of four Dutch gastroenterologists specialized in inflammatory bowel diseases (IBD; T.R., F.v.S., P.W., and M.P.) and a systematic literature review on cost-effectiveness models for CD (search terms in Supplementary Material 1). We developed a de novo individual state transition microsimulation model in R (version 4.3.2), adapted from the Decision Analysis in R for Technologies in Health (DARTH) model framework [16, 17]. Patients transition through four health states: active disease, remission, remission due to surgery, and death. Transitions between health states are informed by meta-analyses (background probability of achieving remission), NMAs (relative risks for treatments and discontinuation), and time-to-event analyses on registry data (time to active disease when in remission). The model has a societal perspective, lifetime time horizon, and a cycle length of 12 weeks. The model follows the updated Dutch guideline for economic evaluations and adopts a discount rate of 1.5% for effects and 3% for costs [18].
Fig. 1
Schematic overview of the model
The first-line therapy is prescribed as induction therapy, and its success is evaluated after 12 weeks. A patient that achieves remission remains on therapy with a maintenance dosage until loss of remission (active disease) when a treatment switch occurs. The time from remission to active disease is informed by a time-to-event model with patient characteristics as covariates (see the section ‘Background probabilities’). If a patient does not achieve remission, induction of the next treatment starts. Patients can receive a maximum of five treatment lines. When a patient has active disease, there is a probability to receive surgery “due to active disease.” These were all surgeries included in the registry and marked as “due to active disease” but were predominantly ileocecal resections. The probability to have this type of surgery is also informed by a time-to-event model estimated on registry data, and patients who receive this type of surgery enter the “remission due to surgery” health state. In this “remission due to surgery” health state, the time to active disease is equal to that of infliximab, as demonstrated by the L!RIC trial [19]. At all times, patients also have a probability to have surgery due to other causes (thus not due to active disease and not resulting in remission), also informed by a time-to-event model estimated on registry data. These surgeries included perianal fistulae. Since the majority of pharmaceutical treatment options commonly provided are exhausted after five treatment lines, it was assumed that, thereafter, patients stay in “active disease” unless they achieve remission after receiving surgery due to active disease.
2.2 Model Inputs2.2.1 Patient PopulationThe simulated patient population was based on the Dutch IBD South Limburg (IBD-SL) cohort of patients with CD [20]. A covariance matrix was estimated to account for the correlation in occurrence between the following covariates: age at diagnosis (< 40 years and ≥ 40 years), sex, current smoker (yes/no), the Montreal disease classification for location (L1, L2, and L3), behaviour (B1, B2, and B3), and perianal disease (yes/no). The covariance matrix was used to simulate a cohort of 30,000 (deterministic) and 1000 (probabilistic) hypothetical patients with CD. The comparison of the patient characteristics of the registry data and the simulated cohort can be found in Supplementary Material 2.
2.2.2 Treatment SequencesTreatment sequences were split between strategies that start with an immunomodulator (“step-up,” 156 sequences) and those that start with a biologic (“top-down,” 72 sequences). In total, nine drug treatments were included: vedolizumab + corticosteroids (VED), ustekinumab (UST), methotrexate (MTX), infliximab (IFX5), adalimumab (ADA40), infliximab + azathioprine (IFX+AZA), azathioprine + corticosteroids (AZA), risankizumab (RIS), and upadacitinib (UPA). In Supplementary Material 7, we show the different potential treatments by treatment line. We imposed several assumptions in line with Dutch clinical prescription practice: first, in the combination therapy infliximab + azathioprine (IFX+AZA), it was assumed that the immunomodulator would be stopped after 1 year. Second, azathioprine/6-mp (here abbreviated to AZA) and vedolizumab (VED) were assumed to be prescribed together with corticosteroids during the induction period. Third, while theoretically possible in clinical practice, ustekinumab (UST) was not included in line 1 as there are currently not enough “biologic exposed” options to fill the remaining treatment lines in the model.
2.2.3 Treatment Efficacy and Adverse Events: Meta-analysis and Network Meta-analysisTreatment efficacy was based on a published network meta-analysis (NMA) of pharmaceutical therapies for CD [21]. The NMA reported relative risks (RR) and was conducted separately for biologic-naive and exposed patients on the endpoints “clinical remission,” maintenance of clinical remission, with remission defined as Crohn's Disease Activity Index (CDAI) < 150, and discontinuation due to adverse events (Table 1 and Supplementary Material 3). Compared with the published NMA, the RR of clinical remission with vedolizumab was altered to reflect Dutch clinical practice, which prefers vedolizumab + corticosteroids for the induction of remission. The RR for vedolizumab was reestimated using only trials that allowed concomitant steroid use, increasing the RR of vedolizumab versus placebo from 1.37 to 2.37 [CI 1.37–4.10], confirming post hoc analysis of the pivotal trial [22]. Treatment dosing was based on Farmacotherapeutisch Kompas [23].
Table 1 Relative risks of included treatments derived from network meta-analysis2.2.4 Background Probability of Achieving Response or RemissionFrequentist random effect meta-analysis was conducted for achieving clinical remission and adverse event-related discontinuation using the metaprop function from the meta library in R on the placebo arms of the trials included in the NMA. The placebo probability to achieve remission for biologic naive patients was based on 16 RCTs and was 22% [CI 16.9–27.1]. For biologic-exposed patients, the placebo probability to achieve remission was based on 14 RCTs and was 15.25% [CI 11–20.7].
2.2.5 Background Probability Treatment-Specific Adverse Event-Related DiscontinuationTreatment-specific adverse event-related discontinuation was applied for the duration of treatment. The placebo discontinuation rate due to adverse events was based on 21 RCTs for biologic naive and 12 for biologic exposed patients and was 7.7% [CI 5.2–11.3] and 7.3% [CI 4.9–10.7], which was adjusted to a 3-month probability of 2 and 1.9%.
2.2.6 Background Probabilities for Loss of RemissionPatients who achieve remission after induction therapy may lose remission over time. This probability is based on time-to-event functions estimated on registry data of patients after the induction period (i.e., patients on treatment 12 weeks after its initiation). The time-to-event models were estimated on two registries from the Netherlands: the IBD-SL cohort for biologic-naive patients and the Dutch Initiative on Crohn and Colitis (ICC) cohort for biologic-exposed patients (Supplementary Material 2). The same patient-level covariates used to simulate the patient population are included in the time-to-event analysis. For drugs, three time-to-event models were estimated: first-line biologic-naive model with treatment-naive patients on azathioprine (based on IBD-SL data), a second-line biologic-naive model for patients who received second-line infliximab (based on IBD-SL data), and a third/fourth/fifth line model of biologic-exposed patients who received ustekinumab after having been pretreated with at least one biologic (based on ICC data). For surgery, two models were estimated, one for surgery “due to active disease” and one for “other surgery” (both on IBD-SL data). For extrapolation, the following functional forms were tested: exponential, Weibull, lognormal, loglogistic, gamma, and Gompertz. The best fitting functional form was chosen based on the Akaike information criterion (AIC), and the predicted extrapolations were validated with four gastroenterologists (T.R., F.v.S., P.W., and M.P.) (Supplementary Material 4).
The resulting background probabilities for achieving remission, discontinuation, and time to active disease transition probabilities were multiplied with the results from the NMA for each therapy to correct for the efficacy of the specific therapy. The transition probabilities of the time to active disease were derived from the parametric survival functions by converting the “survival” probabilities to per period transition probabilities using the following formula:
where p is the probability to transition from remission to active disease t, for patient level covariate combination i, and St is the survival probability at time t. These time-dependent transition probabilities for the treatments observed in the registries were multiplied with the relative risk of the other treatments as derived from the NMA to reflect the likely “real-world” time to active disease of the other treatments using the following equation:
$$_^=\left(1- \frac_}_}\right)*}_,$$
where p* is the treatment adjusted transition probability of time to active disease, and e represents the prior treatment exposure that defines if the RR is taken from the biologic naive or exposed NMA.
2.2.7 Costs2.2.7.1 Healthcare CostsHealthcare costs consist of the cost of treatment, the consultation of medical specialists and IBD nurses, diagnostic procedures, and hospitalizations. Treatment costs were based on prices declared at Dutch health insurances, thus incorporating discounts on the list price. The cost of medical specialist visits, diagnostic procedures, and hospitalization were health state-specific. These costs were derived from a reanalysis of the CD sample of the Dutch COIN study [24]. Costs of future medical consumption were age- and sex-specific and based on the PAID tool (version 3) [25].
2.2.7.2 Societal CostsSocietal costs included productivity costs and caregiver costs. Productivity costs were estimated on the basis of the friction cost method. Productivity costs for unpaid work and caregiver time costs were based on the Dutch COIN study [24], using an hourly wage of €18.80 from the Dutch costing manual [18]. The productivity losses for paid work for those in active disease and those not in active disease were derived from the Dutch WORK-IBD study [26]. All costs were indexed to 2023 using the consumer price index (Supplementary Material 5).
2.2.8 UtilitiesUtilities for health states and patient characteristics (current age, age at diagnosis of CD, location of disease, disease behavior, perianal disease, and current smoking status) were estimated on EQ-5D-3L [27] data from 364 patients with CD from the multicenter prospective Dutch IB-DREAM registry [28]. Statistically significant predictors (p < 0.05) of utility values were being in remission (+ 0.18) and having ileocolonic disease (Montreal L3) (+ 0.05 relative to L1) (Supplementary Material 6).
2.2.9 MortalityMortality was separated in background mortality for the average Dutch person, adjusted for age and sex from 2019 and a sex-specific hazard ratio (HR) for excess mortality due to CD taken from a large Swedish cohort study (HR = 1.8 for females and 1.5 for males) [29].
2.3 Cost–Effectiveness ThresholdIn the Netherlands, the cost–effectiveness threshold is based on disease severity as captured in “proportional shortfall.” The proportional shortfall was calculated for the sequence AZA–IFX+AZA–UST–VED–RIS, as this was considered to be a “standard of care” stepped approach in the Netherlands.
2.4 Analyses2.4.1 Model StabilityThe stability of the model was tested by visually comparing the variability of the incremental net health benefit of 20 model runs computed with different seeds at sample sizes ranging from 1000 to 100,000. Model results were considered sufficiently stable in a trade-off between runtime and variability at a simulated cohort of 30,000 patients for the deterministic analysis (Supplementary Material 8).
2.4.2 Deterministic AnalysesWe reported costs, quality-adjusted life years (QALYs), time on treatment, and time in remission. We ranked all treatment sequences on net health benefit (NHB = QALYs − (costs/willingness-to-pay threshold)) and visually displayed the proportion of treatments that ranked highest in each treatment line, including the average time on treatment. Direct comparisons between top-down and step-up sequences were not possible owing to limitations in the registry data structure. The model uses time-to-event functions derived from patients selected by clinicians for specific treatments. For biologic-exposed patients, we used ustekinumab data, which reflect patients with poorer prognoses who had failed prior biologics. This creates an inherent bias: in the top-down sequence, patients receive the “poor prognosis” time-to-event parameters from line 2 onward, while in the step-up sequence, these same parameters only apply from line 3 onward (after patients have already received azathioprine and infliximab in lines 1 and 2). This temporal mismatch makes direct comparison between strategies invalid, which is unfortunate as it can thus not provide information for clinicians on the cost–effectiveness of top-down versus step-up sequences.
2.4.3 Scenario AnalysesWe ran three scenario analyses. The first pertains to efficacy data. The NMA on which efficacy data was based included studies up to October 2023. Two large trials (SEQUENCE [30] and VIVID-1 [31]) were published thereafter and included data on currently reimbursed care in The Netherlands: risankizumab and ustekinumab. In a scenario, we test the robustness of findings by running the base case with these two trials included in the NMA: VIVID-1 includes mirikizumab data, which was added to the NMA, but not included in the cost–effectiveness model, as it is not reimbursed care at the time of writing, and the SEQUENCE trial, which was a noninferiorty study of ustekinumab versus risankizumab. The RR after inclusion for the induction of remission in biologic exposed patients was 1.71 for ustekinumab 6 mg/kg and 2.21 for risankizumab 600 mg, and for maintenance 0.84 for ustekinumab 90 mg and 0.67 for Risankizumab 360 mg, reflecting improved efficacy of risankizumab versus ustekinumab in the scenario.
Scenario analyses 2 and 3 pertain to price declines in ustekinumab. As of July 2024, ustekinumab is no longer under patent protection. As of November 2024, four biosimilars have entered the Dutch market, but list prices have remained stable. We reconducted the base case with an expected price decline of 48.4%, based on the difference in originator and biosimilar price of trastuzumab [32]. The loss of exclusivity may also raise the question if ustekinumab can be used prior to anti-TNF as a second line. Hence, we analyzed at which price ustekinumab would be the optimal second-line choice in step-up sequences.
2.4.3.1 One-Way Sensitivity AnalysesTo explore the impact of the parameters on the cost–effectiveness outcomes, one-way sensitivity analyses (OWSA) were performed for the sequence AZA–IFX+AZA–UPA–VED–RIS. The limits were based on confidence intervals of parameters for which it was available or otherwise a 20% increase or decrease.
2.4.3.2 Probabilistic Sensitivity AnalysesTo assess parameter uncertainty, all parameters were varied simultaneously in a probabilistic sensitivity analysis (PSA). The PSA was conducted sampling 1000 patients in 1000 model runs. All NMA parameters were varied using the covariance matrix to ensure capturing the correlation between effect estimates. Utility regression estimates were simulated using the covariance matrix of the linear model. Time-to-event estimates were varied by simulating, for each of the 192 unique patient profiles, the covariate values of the estimated function using the normboot.flexsurvreg function of the flexsurvreg package [33]. Societal costs were not varied owing to a lack of information on its variance and distribution. An overview of the parameters, their base case value, and their sampling distribution is included in Supplementary Material 9. Cost–effectiveness acceptability curves were used to estimate the probability of being cost-effective at the threshold, relative to a reference treatment.
2.4.4 Value of Information AnalysisThe expected value of perfect information (EVPI) was calculated for the uncertainty in the choice between the most effective and the most cost-effective treatment sequence for 1824 incident patients with CD [34].
2.4.5 ValidationModel validation was conducted and is reported using the Assessment of the Validation Status of Health-Economic decision models (AdViSHE) checklist [35]. An external scientific group inspected the technical implementation of the model code using the TECHnical VERification (TECH-VER) checklist [36] and used it to improve the model. External validation of outcomes was performed by comparing time on treatment in the second-line with Dutch claims data [37]. The claims data study reports time on second line treatment of 22,082 patients with IBD in the Netherlands. A total of 60.4% of patients where on anti-TNF combination therapy, and the rest were on anti-TNF monotherapy. The proportion of discontinued patients was reported for five time points after the start of second-line treatment. We compare these outcomes with a weighted mean of modeled results of sequences with IFX+AZA (60% weight) or adalimumab monotherapy (40% weight) in the second line. A second validation is conducted for top-down versus step-up sequences, as investigated by D’Haens (2008) et al. [38], showing 60.0% in remission after top-down and 35.9% after step-up at week 26. This comparison is only possible for a very short time horizon (i.e., before the time-to-event function of line 2 is activated, which is different between step-up and top-down sequences). Therefore, the outcomes of the model at week 24 are compared with the outcomes that is the nearest outcome to that of D’Haens et al.’s week 26 reported outcome. We use the consolidated health economic evaluation reporting standards (CHEERS) statement to facilitate the review of our work [39]. All checklists are provided as supplements.
Comments (0)