
Remember me

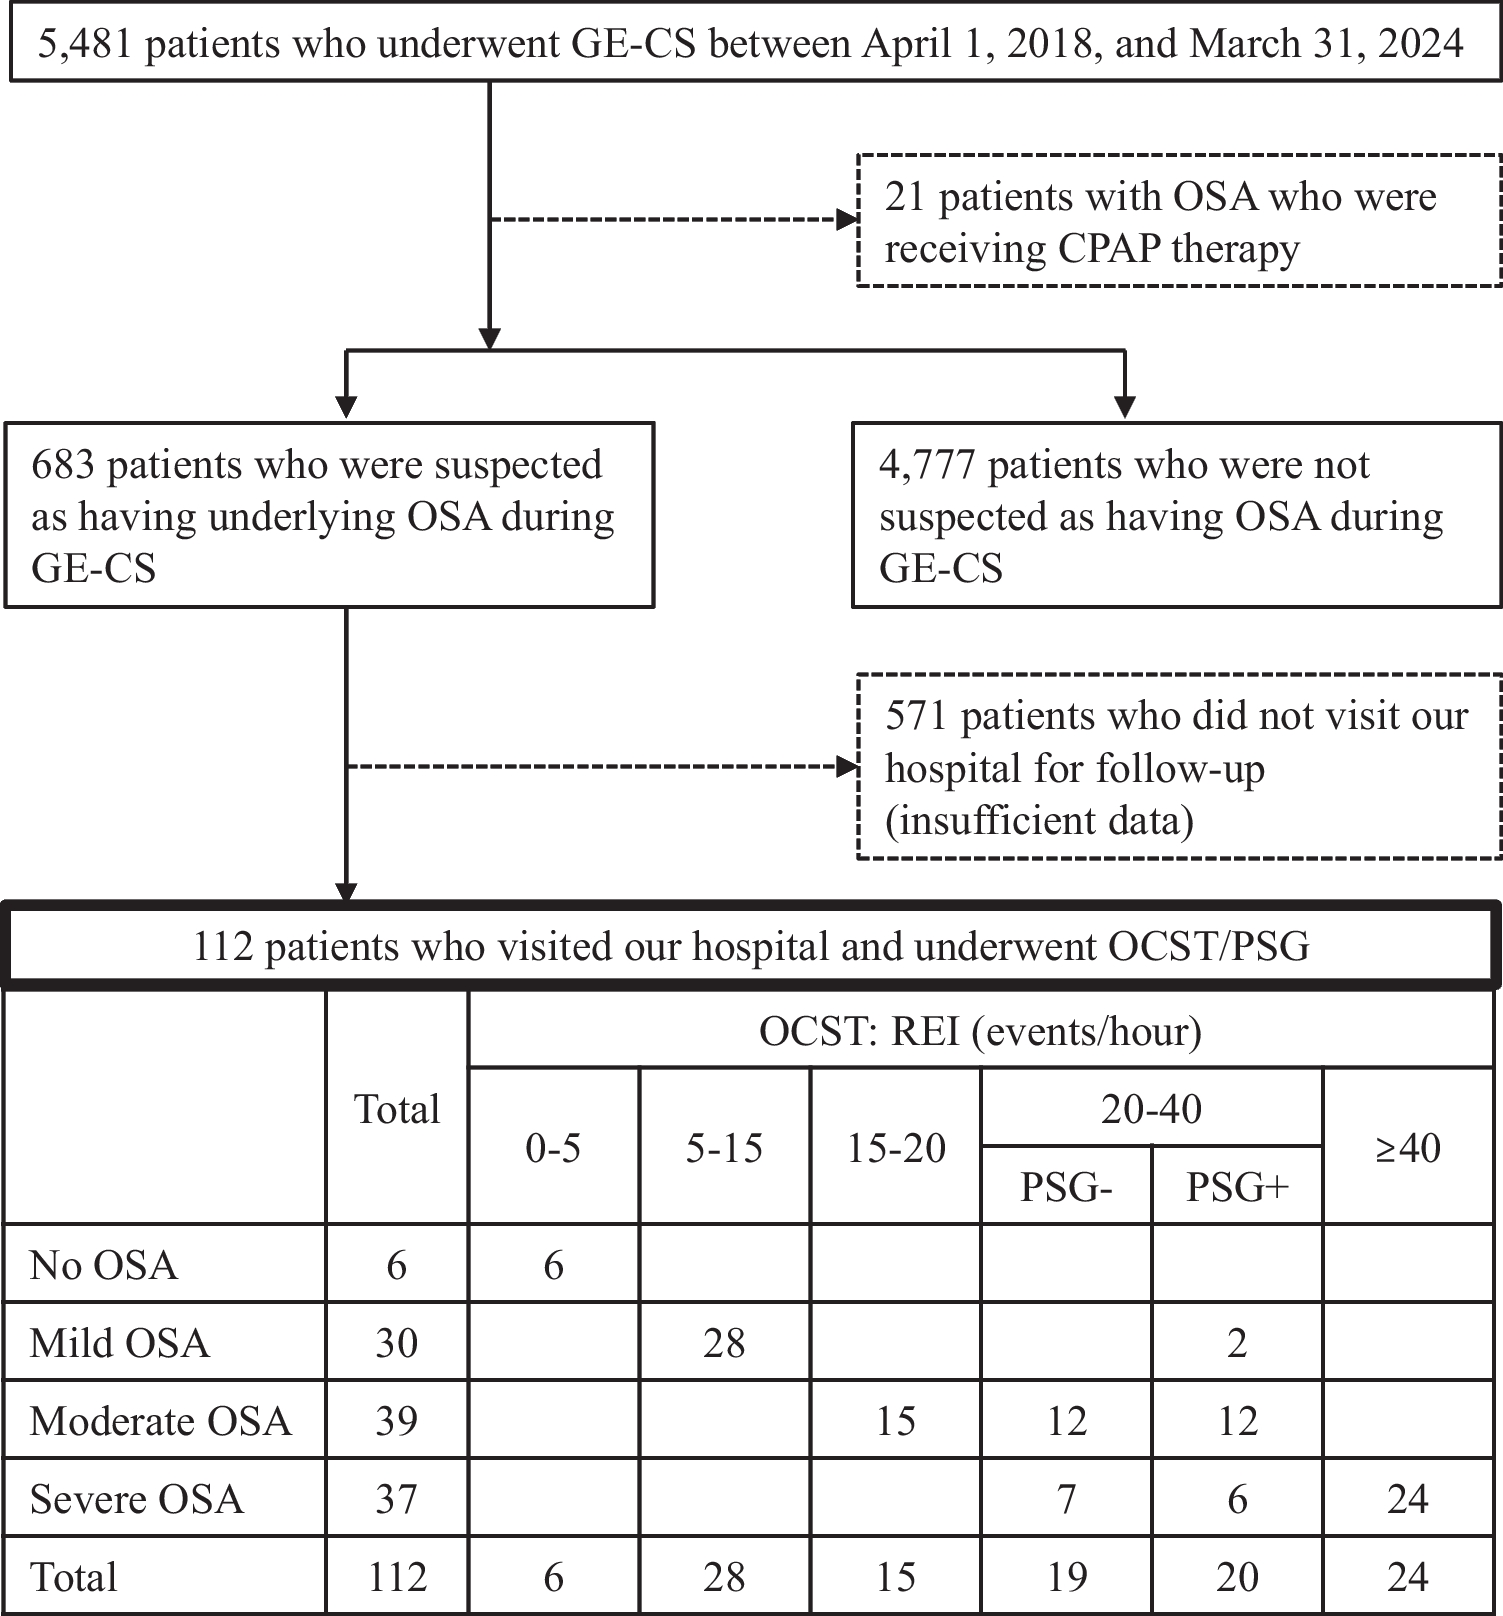
This study was conducted in accordance with the Strengthening the Reporting of Observational Studies in Epidemiology (STROBE) guidelines for observational research [20]. Data were retrieved retrospectively and analyzed anonymously. All participants provided written informed consent prior to inclusion in the study. A total of 104 adult patients with a confirmed diagnosis of OSA were retrospectively included. Participants were enrolled according to the following inclusion criteria: age over 50 years, treatment with CPAP or MAD, diagnosis of moderate to severe obstructive sleep apnea syndrome (OSAS), and a body mass index (BMI) below 30 kg/m². Exclusion criteria included smoking habits, neurological disorders, cardiac conditions, and a history of stroke or heart failure. The cohort was split into two treatment arms: 52 patients treated with MAD, and 52 patients with CPAP. Patient data were collected from consecutive clinical records at the Department of Orthodontics and Respiratory Medicine Unit, University of Foggia, Italy, over the period March 2022 to October 2024.
Each individual underwent a diagnostic sleep study prior to therapy initiation and a follow-up polysomnographic evaluation after a predetermined treatment interval. The collected data included the polysomnographic indices: apnea-hypopnea index (AHI) and oxygen desaturation index (ODI), as well as mean, minimum, and maximum heart rate, measured for each patient before (T0) and after treatment (T1). These parameters were compared to assess the impact of two treatments on cardiac function (HR min, mean and max).
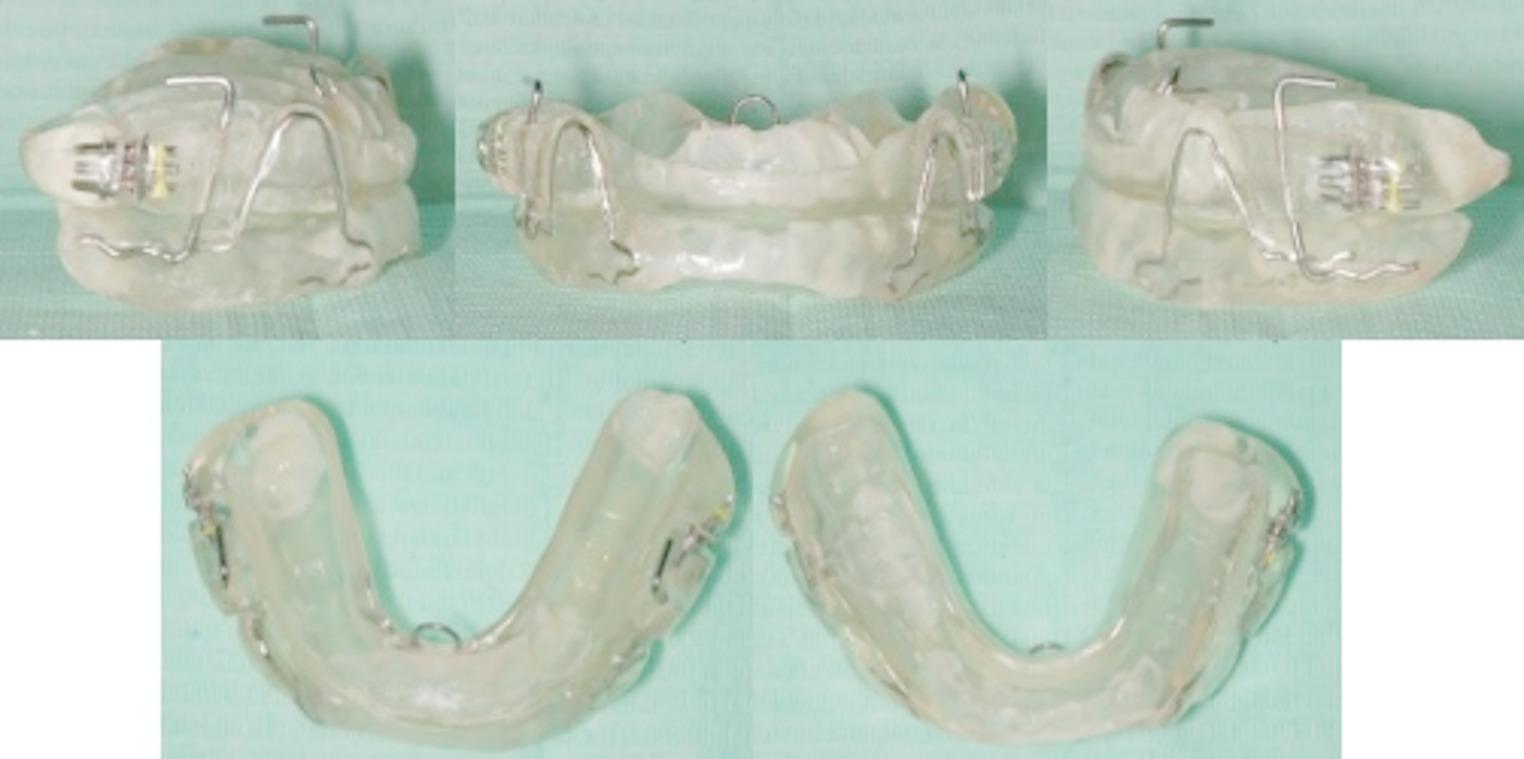
MAD protocolThe appliance employed was the It Makes You Sleep (IMYS, Salcuni Dental Laboratory, Italy) device (Fig. 1), a custom-made and titratable MAD. The IMYS device consists of two resin splints connected by two vertical stainless-steel bars and three screws. The vertical bars are inserted into a vertically oriented slot, located mesially to the screws, and are embedded within the resin of both the upper and lower splints. These components allow for limited vertical and lateral mandibular movements while preventing full mouth opening. Additionally, the upper splint included a lingual loop to improve tongue posture [21] and stainless-steel wire stabilizing bars to reinforce the appliance during mandibular advancement. A functional mandibular evaluation was performed for each patient. Impressions of both the maxillary and mandibular arches were captured using the iTero intraoral scanner, generating digital models that were subsequently mounted on an articulator. Being titratable, the device was initially set to a mandibular advancement corresponding to 70% of the patient’s maximum protrusive range. Following two weeks of treatment, the mandibular position was modified in small increments (1–2 mm) to achieve the best possible therapeutic fit for each patient.
Fig. 1 CPAP protocol
Participants began CPAP titration following the diagnosis of OSA, in accordance with the clinical guidelines of the American Academy of Sleep Medicine [22].
Titration was conducted using an automatic positive airway pressure (APAP, ResMed Autoset Airsense 10, ResMed, Italy) device with the goal of identifying the optimal therapeutic pressure (fixed CPAP, ResMed Airsense 10, ResMed, Italy). The device used, equipped with advanced algorithms, could adjust the delivered pressure in real time, breath by breath, continuously monitoring respiratory parameters such as inspiratory flow, snoring level, and AHI index.
Titration was performed at home in cases where the time spent with oxygen saturation below 90% (T90) was less than 30% of the total recorded time. Conversely, when T90 > 30%, titration was carried out in a hospital-based pneumology unit.
After three consecutive nights in APAP mode, the fixed therapeutic pressure for CPAP was set. At this stage, the Expiratory Pressure Relief (EPR) function was activated, limited to the initial ramp phase, to improve tolerance and respiratory comfort. The selected EPR level corresponded to a reduction of 1 cmH₂O during exhalation. Following the final pressure setting, each participant continued treatment for two consecutive nights with fixed-pressure CPAP to assess the correction of respiratory events. Finally, all patients adapted to CPAP underwent a follow-up RPG to verify the effectiveness of the therapeutic setting achieved [22].
Sleep study analysisAll participants underwent overnight diagnostic type 3 polysomnography/respiratory polygraphy (RPG, NOX T3, MedicAir, Italy) [23] at baseline (T0) and after 3 month of the assigned treatment (T1). The RPG included continuous monitoring of multiple physiological signals: airflow, thoraco-abdominal respiratory movements, oxygen saturation (SpO₂), heart rate and body position. The sleep recordings were manually scored by expert somnologists according to AASM criteria [24].
The following parameters were analyzed from the HST recordings for subsequent analysis for assessing the responses to treatment with MAD and C-PAP: AHI, ODI, and mean, minimum, and maximum heart rate (HRmean, HRmin, HRmax).
All patients included in the analyzed sample demonstrated proper adherence to the prescribed therapy. Both MAD- and CPAP-treated participants followed the therapeutic instructions, resulting in high compliance. No side effects were observed in the CPAP group. In the MAD group, eight patients experienced masticatory muscle pain and fatigue within the first 10 days of therapy.
Statistical analysisA power analysis conducted using G*Power 3.1.9.2 (Franz Faul, Universität Kiel, Germany) determined that, to detect an effect size of 0.5 [25] with a Mann–Whitney test, a sample size of 52 subjects per group is required, assuming a significance level (α) of 0.05 and statistical power (1 − β) of 0.80.
Data distribution was assessed using the Shapiro-Wilk normality test. Descriptive statistics were calculated for all variables (Table 2). For within-group comparisons of polysomnographic indices and heart rate parameters before (T0) and after treatment (T1), the Wilcoxon signed-rank test was applied in cases of non-normal distribution, while the paired-sample t-test was used when data were normally distributed. Between-group differences in the T1 − T0 difference of each variable were analyzed using the Mann-Whitney U test.
To compare the effect of MAD and CPAP devices on heart rate (HR) variation, a propensity score matching (PSM) was performed. A 1:1 matching was conducted using Nearest Neighbor Matching based on two baseline pre-treatment variables: AHI and ODI. The propensity score was calculated through logistic regression, and subjects were matched to minimize the distance between propensity scores. Subsequently, pre- and post-treatment differences were analyzed for the following outcomes: ΔHRmin, ΔHRmean, and ΔHRmax.
Furthermore, in consideration of studies on the nocturnal circadian profile of cardiac function [26], Sankey diagram (Figs. 2 and 3) was constructed considering the following HR values as normal during sleep: HR mean 55–70 bpm, HR min 45–55 bpm and HR max 70–90 bpm. X2 test was used to compare the categorical variables.
Fig. 2
Sankey plot to show mean (A), minimum (B) and maximum (C) heart rate changes in CPAP-treated patients
Fig. 3
Sankey plot to show mean (A) and minimum (B) heart rate changes in MAD treated patients
All statistical analyses and graphs were performed using RStudio version 2025.05.1 + 513. Statistical significance was set at p < 0.05.
Comments (0)