
Remember me

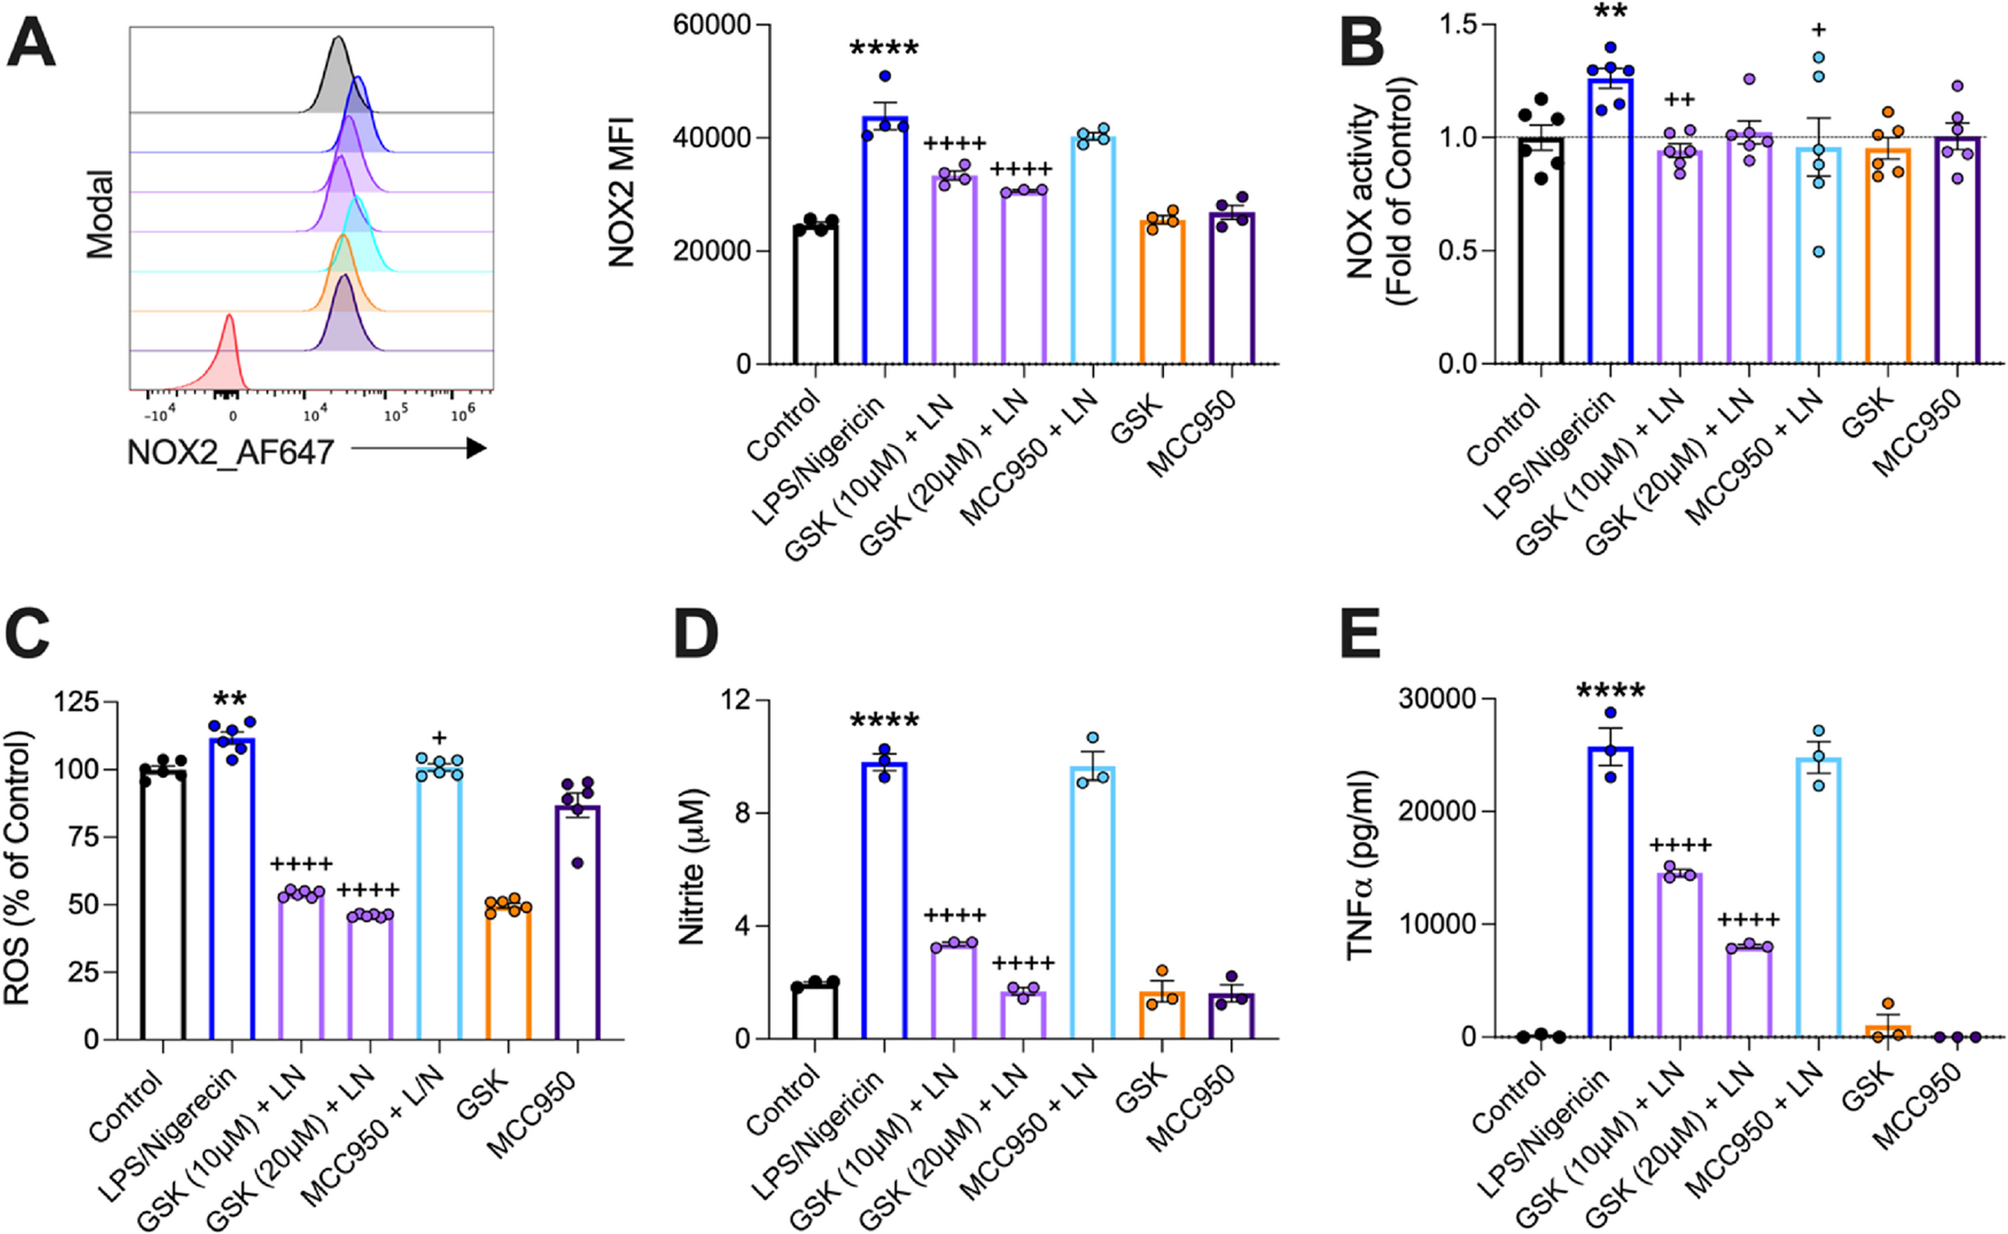


To closely mimic what occurs in TBI, we established an in vitro model of microglial activation using LPS/nigericin (L/N) stimulation to induce both NOX2 and NLRP3 inflammasome activation in immortalised microglia cells (IMG; [19]). Nigericin induces potassium (K+) efflux resulting in pore formation of the plasma membrane to induce NLRP3 inflammasome activation [29, 30]. L/N potently induces pyroptotic dependent IL-1β release. We sought to determine whether GSK2795039, a small molecule NOX2 inhibitor [16], could attenuate NOX2-mediated pro-inflammatory activation of microglia in vitro. L/N increased the mean florescent intensity (MFI) of NOX2 protein in IMG microglia (Fig. 1A; p < 0.0001 vs. control). L/N increased NOX-driven superoxide production (Fig. 1B; p < 0.01 vs. control). GSK2795039 attenuated NOX2 MFI in a concentration-dependent manner (Fig. 1A; p < 0.0001 vs. L/N), whereas MCC950 pre-treatment, an NLRP3 inhibitor, had no effect on NOX2 MFI (Fig. 1A). GSK2795039 (10µM) and MCC950 reduced NOX activity in L/N simulated IMGs (Fig. 1B; p < 0.05; p < 0.01 vs. L/N). These findings demonstrate that GSK2795039 inhibits NOX2 protein expression and activity in a model of NLRP3 inflammasome activation in microglia. In addition, the potent NLRP3 inhibitor, MCC950, fails to reduce NOX2 expression.
Fig. 1
GSK2795039 attenuates NOX2 expression and activity, reactive oxygen species, nitrite, and TNF⍺ production in IMGs. IMGs pre-treated with GSK2795039 (10 or 20 µM) or MCC950 (0.5 µM) for 1 h prior to stimulation with LPS/nigericin (L/N; 10 µM; 30 min) in a 12-well plate. GSK2795039 (10 µM) and MCC950 (0.5 uM) were used as drug controls. L/N increased NOX2 mean florescent intensity (MFI; A; ****p < 0.0001), NOX2 activity and ROS (B, C; **p < 0.01), nitrite and TNF⍺ (D, E; ****p < 0.0001) compared to controls. GSK2795039 reduced NOX2 MFI (A; ++++p < 0.0001), NOX activity (B; ++p < 0.01), ROS, nitrite and TNF⍺ (C-E; ++++p < 0.0001) versus L/N. MCC950 reduced superoxide activity and ROS (B, C; +p < 0.05) versus L/N but had no effect on NOX2 MFI (A), nitrite (D) or TNF⍺ (E). Data are mean ± SEM (n = 3–6 per group) and are a representative of three independent experiments. **p < 0.01; ****p < 0.0001 versus control, +p < 0.05; ++p < 0.01; ++++p < 0.0001 versus L/N; One-way ANOVA with post hoc Dunnett’s multiple comparisons test versus L/N
We next investigated what effect inhibition had on the pro-inflammatory mediators downstream of the NOX2/ROS signalling pathway. In microglia, ROS production induces NFκB translocation and NOS2 (iNOS) activation, followed by release of nitric oxide [31, 32]. Moreover, ROS and IL-1β results in an overproduction of TNF⍺ that can promote caspase-1 activity and drive neuroinflammation [33]. Therefore, we investigated the effect of GSK2795039 and MCC950 on ROS, nitrite and TNF⍺ levels pro-inflammatory microglia. L/N increased ROS, nitrite and TNF⍺ (Fig. 1C, D,E; p < 0.01, p < 0.0001 versus control). GSK2795039 attenuated ROS, nitrite and TNF⍺ levels in a concentration-dependent manner (Fig. 1C, D,E; p < 0.0001 versus L/N). MCC950 reduced ROS but had no effect on nitrite and TNF⍺ levels (Fig. 1C, D, E; p < 0.05 vs. L/N). These findings suggests that selective NOX2 inhibition disrupts downstream signalling including ROS, nitrite, and TNF⍺, which are key mediators of the microglial pro-inflammatory response.
NOX2 inhibition attenuates NLRP3 inflammasome activation in pro-inflammatory microgliaTo more deeply investigate the NOX2/ROS/NLRP3 inflammatory axis, components of the NLRP3 inflammasome were analysed in cell lysates (CL) and corresponding supernatants (SN) by Western blot. We examined apoptosis-associated speck-like protein containing a CARD (ASC), which is required for the formation of the NLRP3 inflammasome and binding to pro-caspase 1 [34]. Cleaved capsase-1 and cleaved IL-1β were also assessed to measure NLRP3 inflammasome activity. In the CL, L/N modestly increased NLRP3 expression, whereas in the corresponding SN there was a robust increased NLRP3 expression in pro-inflammatory microglia (Fig. 2A). Although there was no difference in pro-caspase 1 expression, L/N increased cleaved-caspase-1 in the CL in microglia (Fig. 2A; p < 0.05 versus control). Notably, L/N upregulated both pro- and cleaved caspase-1 in the SN. In addition, there was increased pro- and cleaved- IL-1β in both the CL and SN (Fig. 2A; p < 0.0001 vs. control). When compared to control, there was no L/N stimulated induction of ASC in the CL, but there was a robust increase in ASC expression in SN (Fig. 2A).
Fig. 2
NOX2 inhibition attenuates NLRP3 inflammasome activation in IMGs. IMGs pre-treated with GSK2795039 (10 or 20 µM) or MCC950 (0.5 µM) for 1 h prior to stimulation with LPS/nigericin (L/N; 10 µM; 30 min) in a 12-well plate. GSK2795039 (10 µM) and MCC950 (0.5 uM) were used as controls. Cell lysates (CL) and supernatants (SN) were processed and NLRP3, Caspase-1, IL-1β and ASC protein expression were examined. IL-1β, IL-18 and lactate dehydrogenase (LDH) were measured in the conditioned media. In CL, L/N increased NLRP3, cleaved-caspase-1, pro- and cleaved-IL-1β protein expression as shown by immunoblot and corresponding quantification (A; *p < 0.05; ****p < 0.0001) compared to controls. GSK2795039 reduced cleaved-caspase-1, pro-IL-1β (A; +p < 0.05; +++p < 0.001) and cleaved-IL-1β but failed to reach significance, versus L/N. MCC950 reduced cleaved-caspase-1 (A; +p < 0.05) versus L/N. In the corresponding SN, GSK2795039 reduced L/N induced NLRP3, pro- and cleaved-caspase-1, pro- and cleaved-IL-1β and ASC (A), which were also reduced with MCC950. L/N increased IL-1β, IL-18, and LDH (B-D; ***p < 0.001; ****p < 0.0001) compared to control. GSK2795039 and MCC950 reduced IL-1β, IL-18, and LDH (B-D; ++p < 0.01; +++p < 0.001; ++++p < 0.0001) compared to L/N. Data are mean ± SEM (n = 3 per group) and are a representative of three independent experiments. *p < 0.05; ***p < 0.001; ****p < 0.0001 versus control, +p < 0.05; ++p < 0.01; +++p < 0.001; ++++p < 0.0001 versus L/N; one-way ANOVA with post hoc Dunnett’s multiple comparisons test versus L/N
NOX2 inhibition by GSK2795039 had no significant effect on NLRP3 protein expression in CL, but there was a qualitative reduction of NLRP3 expression in SN, as shown by immunoblot (Fig. 2A). Surprisingly, the NLRP3 inflammasome inhibitor, MCC950, did not reduce NLRP3 expression in the CL in microglia, but its expression was completely abrogated in the corresponding SN (Fig. 2A). GSK2795039 had no effect on pro-caspase 1 expression in the CL but reduced cleaved-caspase-1 in the CL (Fig. 2A; p < 0.05 vs. L/N). In the corresponding SN, GSK2795039 qualitatively reduced pro- and cleaved- caspase 1 expression in a concentration-dependent manner. MCC950 had no effect on pro-caspase 1 expression in the CL but reduced cleaved- caspase-1 in the CL (Fig. 2A; p < 0.05 vs. L/N). Again, in the corresponding SN, MCC950 completely abrogated L/N induced pro- and cleaved- caspase 1 expression. In the CL, GSK2795039 reduced pro-IL-1β in a concentration-dependent manner (Fig. 2A; p < 0.05; p < 0.01 vs. L/N), as well as cleaved IL-1β, although this failed to reach statistical significance. In the SN, GSK2795039 reduced pro- and cleaved- IL-1β expression in a concentration-dependent manner. MCC950 had no effect on either pro- or cleaved- IL-1β in the CL, but levels of both were reduced in the supernatants. Despite no effect of GSK2795039 on ASC protein expression in the CL, it reduced its expression in the SN. MCC950 did not alter ASC levels in CL but robustly reduced its expression in the SN.
Independent analysis of the SN demonstrated that L/N increased IL-1β and IL-18 (Fig. 2B, C; p < 0.001; p < 0.0001 versus control) by ELISA. These NLRP3 inflammasome associated cytokines were reduced by GSK2795039 treatment in a concentration-dependent manner, and as predicted, MCC950 also reduced IL-1β and IL-18 in pro-inflammatory microglia (Fig. 2B, C; p < 0.01; p < 0.001; p < 0.0001 versus L/N). We next investigated if NOX2 inhibition of IL-1β and IL-18 is pyroptosis dependent. L/N increased lactate dehydrogenase (LDH) (Fig. 2D; p < 0.0001 vs. control), an indicator of pyroptotic cell death [35], while GSK2795039 attenuated LDH levels in pro-inflammatory microglia (Fig. 2D; p < 0.05; p < 0.0001 vs. L/N). MCC950 treatment returned LDH to control levels (Fig. 2D; p < 0.0001 vs. L/N). These findings indicate that reduced ASC and cleaved caspase 1, by selective NOX2 inhibition, prevents the activation of the NLRP3 inflammasome in pro-inflammatory microglia, which is confirmed by the reduction of downstream products, IL-1β, IL-18 and LDH.
GSK2795039 attenuates LPS/nigericin ROS, IL-1β, and LDH in primary microgliaWe next sought to replicate our findings using primary microglia derived from p1 rat pups. Stimulation of primary microglia with L/N increased ROS, IL-1β, LDH and reduced cell viability (Fig. 3A-D; p < 0.01; p < 0.001; p < 0.0001 versus control). NOX2 inhibition in primary microglia using GSK2795039 attenuated L/N induced ROS, IL-1β and LDH levels (Fig. 3A-C; p < 0.05; p < 0.01; p < 0.0001 versus L/N), while it had no effect on cell viability (Fig. 3D). The NLRP3 inhibitor MCC950 had no effect on ROS and IL-1β (Fig. 3A, B), albeit mainly due to data scatter and variability. MCC950 reduced LDH (Fig. 3C; p < 0.05 versus L/N) but did not rescue L/N induced-cell death (Fig. 3D). These findings in primary microglia confirmed prior studies in IMG microglia and demonstrate NOX2 inhibition by GSK2795039 attenuates L/N elicited ROS production and NLRP3 inflammasome activation.
Fig. 3
GSK2795039 attenuated L/N induced NOX2 and NLRP3 inflammasome activation in primary microglia. Primary microglia were pre-treated with GSK2795039 (5, 10, or 20 µM) or MCC950 (0.01 µM) for 1 h prior to stimulation with LPS/nigericin (L/N; 10 µM; 30 min) in a 96-well plate. GSK2795039 (10 µM) and MCC950 (0.01 µM) were used as controls. ROS and cell viability were measured in the cells, LDH and IL-1β were measured in the conditioned media. L/N increased ROS, IL-1β, LDH and reduced cell viability (A-D; **p < 0.01; ***p < 0.001; ****p < 0.0001) compared to control. GSK2795039 reduced ROS, IL-1β and LDH (A-C; +p < 0.05; ++p < 0.01; ++++p < 0.0001) versus L/N. MCC950 reduced LDH (D; +p < 0.05) compared to L/N. GSK2795039 or MCC950 did not rescue cell viability loss (D). Data are mean ± SEM (n = 3 per group) and are a representative of three independent experiments. **p < 0.01; ***p < 0.001; ****p < 0.0001 versus control, +p < 0.05, ++p < 0.01, ++++p < 0.0001 versus L/N; one-way ANOVA with post hoc Dunnett’s multiple comparisons test versus L/N
Cellular players in NOX2-ROS-NLRP3 inflammatory axis activation in the injured brainNOX2 activation in microglia/macrophages contributes to post-traumatic neuroinflammation and associated neurodegeneration up to 1-year post-TBI [2], with pharmacological or genetic NOX2 inhibition resulting in reduced neuroinflammation and improved neurological recovery in injured mice [4, 36]. In addition, inhibition of NLRP3 inflammasome activation using MCC950 reduces post-traumatic neuroinflammation in mice [17, 18, 37]. Together, these findings indicate that both NOX2 and NLRP3 inflammasome activation contribute to secondary neuroinflammation following TBI, but the cellular contributors to inflammatory pathway activation are poorly defined.
We therefore used flow cytometry to examine cellular profiles of the NOX2-ROS-NLRP3 inflammatory axis in a controlled cortical impact (CCI) of experimental TBI in mice. Adult male C57Bl6J mice were subjected to sham or moderate-level CCI [21] and cohorts of mice were humanely euthanized at 1-, 3- and 7-days post-injury (DPI) for cellular and molecular analysis. NOX2 related, Cyba, Cybb, the inflammasome, Nlrp3, and microglial phagocytic, Cd68, genes were robustly increased in the ipsilateral hippocampus following TBI with expression peaking at 3 DPI (Fig. 4A; p < 0.05 vs. sham). Cd68 was significantly reduced at 7 DPI (Fig. 4A; p < 0.05 vs. 3 DPI), with a reduction in Cyba, Cybb, and Nlrp3, which failed to reach statistical significance. Pro-inflammatory genes were also increased in the hippocampus with a significant upregulation of Il1b and Tnf mRNAs that peaked at 1 DPI (Fig. 4A; p < 0.001 vs. sham), with reduced expression of both genes at 3 and 7 DPI (Fig. 4A; p < 0.05; p < 0.01; p < 0.001 vs. 1 DPI).
Fig. 4
NOX2 and NLRP3 mRNA expression upregulated at 3 DPI and increased infiltration of neutrophils and monocytes at 1–3 DPI. Adult male C57BL6/J mice were subjected to sham or CCI surgery and euthanised at 1-, 3- or 7 DPI. Tissue punches from the ipsilateral hippocampus of sham or CCI mice were collected for gene expression analysis. CCI induced increased Cyba, Cybb, Cd68 and Nlrp3 mRNA at 3 DPI (A; *p < 0.05 vs. sham) and there was significantly lower Cd68 mRNA at 7DPI (A; *p < 0.05 vs. 3 DPI). CCI increased Il1b and Tnf gene expression at 1 DPI (A; ***p < 0.001 vs. sham), which was lower at 3 and 7 DPI (A; *p < 0.05, **p < 0.01, ***p < 0.001 vs. 1 DPI). CCI induced increased number of infiltrating myeloid cells (CD11b+CD45hi) at 1- and 3 DPI as shown in the representative dot plots (B) and quantification (D; ***p < 0.001; ****p < 0.0001 vs. sham). The number of neutrophils (Ly6G+) peaked at 1 DPI (B, E; ****p < 0.0001 vs. sham), and the number of monocytes (Ly6C+) peaked at 3 DPI (B, F; **p < 0.01; ****p < 0.0001 vs. sham). Data are mean ± SEM (n = 4–5 per group). *p < 0.05; **p < 0.01; ***p < 0.001; ****p < 0.0001; by One-Way ANOVA with Tukey’s multiple comparisons test
We next sought to determine cellular changes in the injured brain. The number and phenotype of brain resident microglia and infiltrating innate immune cells were evaluated at 1, 3 and 7 DPI by multi-dimensional flow cytometry analysis. When compared to sham levels, there were no changes in microglial numbers (CD11b+CD45int) after TBI (Fig. 4B,C), while there was increased infiltration of peripherally derived myeloid cells (CD11b+CD45hi) into the brain at 1 and 3 DPI (Fig. 4B,D; p < 0.001; p < 0.0001 vs. sham). Deeper analysis demonstrated that neutrophils (CD11b+CD45hiLy6G+) rapidly accumulated early after TBI and were the predominant population at 1 DPI (Fig. 4B,E; p < 0.0001 vs. sham). Monocytes (CD11b+CD45hiLy6C+) also accumulated in the injured brain, with peak numbers appearing at 3 DPI (Fig. 4B,F; p < 0.01; p < 0.0001 vs. sham).
We then examined functional changes in immune cells in the injured brain. Microglia were first investigated. When compared to sham, TBI increased NOX2+ microglia at 3 and 7 DPI (Fig. 5A, B; p < 0.0001 vs. sham). Although non-significant, there were increased IL-1β+ microglia at 3 DPI (Fig. 5A, C). TBI upregulated double positive (DP) NOX2+ IL-1β+ at 3 and 7 DPI (Fig. 5A, D; p < 0.05; p < 0.001 vs. sham; see Q2 in representative dot plots for DP populations in Fig. 5A). TBI also robustly increased microglial ROS production across all timepoints (Fig. 5M, N; p < 0.05; p < 0.001; p < 0.0001 vs. sham), with peak microglial ROS production at 3 DPI. When examining neutrophil phenotypes, there were increased NOX2+ neutrophils infiltrating the injured brain at 1 and 3 DPI (Fig. 5E, F; p < 0.05; p < 0.001 vs. sham). There was a significant reduction in NOX2+ neutrophils at 7 DPI (Fig. 5E, F; p < 0.05 vs. 3 DPI), which was due to an overall decreased number of neutrophils at this timepoint. TBI also increased IL-1β+ neutrophils (Fig. 5E, G; p < 0.01 vs. sham) and DP NOX2+ IL-1β+ neutrophils (Fig. 5E, H; p < 0.01 vs. sham; see Q2 in representative dot plots for DP populations in Fig. 5E) at 1 DPI. TBI also increased neutrophil ROS production at 1 DPI (Fig. 5M, O; p < 0.05 vs. sham). Finally, monocyte phenotypes were examined, and there were increased NOX2+ monocytes infiltrating the injured brain at 1 and 3 DPI (Fig. 5I, J; p < 0.001; p < 0.0001 vs. sham). There was a significant reduction in NOX2+ monocytes at 7 DPI (Fig. 5I, J; p < 0.001 vs. 3 DPI), which was due to an overall decreased number of monocytes at this timepoint. TBI greatly increased IL-1β+ monocytes (Fig. 5I, K p < 0.0001 vs. sham) and DP NOX2+ IL-1β+ monocytes (Fig. 5I, L; p < 0.0001 vs. sham; see Q2 in representative dot plots for DP populations in Fig. 5I) at 1 DPI. TBI also increased monocytic ROS production at 1 and 3 DPI (Fig. 5M, P; p < 0.05; p < 0.0001 vs. sham), with peak monocyte ROS production at 3 DPI. These comparative studies allow for insights into NOX2/ROS/IL-1β functional interactions in different cellular populations in the injured brain.
Fig. 5
Microglia, neutrophil, and monocyte NOX2/ROS/IL-1β production peaked at 1- and 3 DPI. Adult male C57BL6/J mice were subjected to sham or CCI surgery and euthanised at 1-, 3- or 7 DPI. Mononuclear cells isolated from the ipsilateral cortex were stained with surface markers, DHR123 (ROS dye), followed by intracellular staining of NOX2 and IL-1β and analysed by flow cytometry. CCI increased #NOX2+ and #NOX2+IL-1β+ microglia at 3- and 7 DPI as shown in the representative quadrants (A) and corresponding quantifications (B, D; *p<0.05; ***p<0.001; ****p<0.0001 vs. sham). CCI increased #NOX2+, #IL-1β+, and #NOX2+IL-1β+ neutrophils and monocytes at 1 DPI as shown in the representative quadrants (E, I) and corresponding quantifications (F-H, J-L; **p<0.01; ***p<0.001; ****p<0.0001 vs. sham). Numbers reduced to sham levels at 7 DPI (F-H, J-L; *p<0.05; ***p<0.001 vs. 1 and 3 DPI). Monocytic #NOX2+ peaked at 3 DPI (I, J; ****p<0.0001 vs. sham). CCI induced microglial ROS production across all time-points (M, N; *p<0.05; ***p<0.001; ****p<0.0001 vs. sham), which peaked at 3 DPI (N; *p<0.05 vs. 7 DPI). Neutrophils and monocytes induced ROS production at 1 DPI, (M, O, P; *p<0.05 vs. sham), which was reduced at 7 DPI (O, P; *p<0.05; ***p<0.001 vs. 1 and 3 DPI). Monocytic ROS peaked at 3 DPI (M, P; **p<0.01 vs. 1 DPI), and was reduced at 7 DPI (P; ***p<0.001 vs. 3 DPI). Data are mean ± SEM (n = 4–5 per group). *p<0.05; **p<0.01; ***p<0.001; ****p<0.0001; by One-Way ANOVA with Tukey’s multiple comparisons test
The small molecule NOX2 inhibitor, GSK2795039, has good brain penetration and modestly improves neurological function in the acute phase after TBIWe then sought to determine whether GSK2795039 could alter post-traumatic neuroinflammation and neurological outcomes after experimental TBI. The small molecule NOX2 inhibitor, GSK2795039, reduces inflammation in vivo in mice [16], and we wanted to check its brain distribution levels after TBI, so we performed in vivo pharmacokinetics (PK) analysis. Adult C57BL6/J male mice were subjected to CCI and GSK2795039 (100 mg/kg) or Vehicle was administered intraperitoneally (i.p.) at 2 h post-injury. Mice were humanely euthanized 0.5 h later, and blood, ipsilateral cortex and hippocampus, and liver was collected for PK analysis (Fig. 6Ai). The measured GSK2795039 levels in the cortex (8.19% of plasma) and hippocampus (7.01% of plasma; Fig. 6Aii) are consistent with literature of 5–10% of plasma levels needed for drug penetration in brain [38]. As expected, GSK2795039 was also detected in the liver (37.09% of plasma).
Fig. 6
GSK2795039 has good brain penetration and modestly improves neurological function in the acute phase after TBI. GSK2795039 (100 mg/kg; i.p.) was administered 2 h following CCI in adult male C57BL6/J mice, and mice were humanely euthanized 0.5 h later (Ai). The concentration of GSK2795039 (ng/ml) in plasma, liver, cortex and hippocampus was quantified using LC–MS analysis resulting in GSK2795039 levels in liver (37.09% of plasma), cortex (8.19%) and hippocampus (7.01%) (Aii). In a separate cohort of mice, GSK2795039 (100 mg/kg; i.p.) or vehicle was administered systemically starting at 2 h post-CCI (B). Gross motor function was measured by an accelerating rotarod at 1-,2- and 3 DPI (B). Vehicle treated CCI mice spent reduced time on the rotarod at 1-,2- and 3 DPI (C; *p < 0.05 vs. sham veh). GSK2795039 treated CCI mice spent increased time on the rotarod at 3 DPI, but levels failed to reach significance (C, D). Spatial learning and memory were assessed by a two-trials Y-Maze at 2 DPI (B). Sham mice spent more time in the novel arm of the Y-Maze (E; *p < 0.05) compared to the familiar arm, while vehicle treated CCI mice did not show any difference in the time spent in the familiar vs. novel arm. GSK2795039 treated CCI mice spent more time in the novel arm, but levels failed to reach statistical significance (E). The fold difference of the novel arm (over the familiar arm) was significantly lower in vehicle treated CCI mice (F; **p < 0.01 vs. sham). GSK2795039 treated CCI mice showed a trend towards sham levels, but this failed to reach statistical significance. Dotted lines represent mean ± SEM of the time spent in the familiar arm. Data are mean ± SEM (n = 4–6 per group). *p < 0.05 vs. sham veh/sham GSK2795039; **p < 0.01 vs. sham; Two-Way ANOVA with repeated measures and uncorrected Fisher’s LSD (C, D); paired t-test (E); One-Way ANOVA with Dunnett’s post hoc test (F)
We next investigated whether GSK2795039 treatment starting at 2 h post-injury could attenuate NOX2/NLRP3 inflammasome activation and improve neurological recovery acutely after TBI. Adult male C57Bl6/J mice were subjected to sham or CCI and administered GSK2795039 (100 mg/kg; i.p.) at 2 h, 12 h, 1 d, and 2 d post-injury (Fig. 6B). Gross motor function was assessed using an accelerating rotarod at 1, 2 and 3 DPI. As expected, vehicle treated CCI mice spent reduced time on the rotarod at 1, 2 and 3 DPI (Fig. 6 C; p < 0.05 vs. sham veh). GSK2795039 treated CCI mice spent reduced time on the rotarod at 1 DPI (Fig. 6C; p < 0.05 vs. sham GSK2795039), but showed improvements at 2 and 3 DPI, with levels not statistically different to sham (Fig. 6C). Sub analysis of rotarod performance at 3 DPI demonstrated that vehicle treated CCI mice spent 54.3 ± 6.9 s on the rotarod, whereas GSK2795039 treated CCI mice spent 73.3 ± 10.0 s on the rotarod (Fig. 6D; Sham + Veh = 99.9 ± 10.2 s; Sham + GSK2795039 = 95.9 ± 17.2 s).
We used a two-trial Y-maze test to assess spatial memory in sham and injured mice at 2 DPI. Sham mice (Vehicle and GSK2795039 groups pooled) spent more time in the novel arm compared to the familiar arm (Fig. 6E; p < 0.05 vs. sham familiar). Vehicle treated CCI mice did not differentiate the novel from the familiar arm (Fig. 6E), with only half of the mice spending more than 50% (chance) in the novel arm. In contrast, GSK2795039 treated CCI mice spent more time in the novel arm (Fig. 6E), with 5 out of the 6 mice spending more than 50% of the time in the novel arm. The ratio of novel over the familiar arm was also assessed. Vehicle treated CCI mice had a decreased ratio (Fig. 6F; p < 0.01 vs. sham), whereas GSK2795039 treated CCI mice had an increased ratio, but levels failed to reach statistical significance. There was no difference in distance travelled in the Y-maze test between the groups (Sham = 12.31 ± 0.7895 m; CCI + Veh = 13.69 +/- 1.411 m;); CCI + GSK2795039 = 11.80 +/- 0.946 m).
NOX2 inhibition reduces NOX2+ IL-1β+ infiltrating myeloid cells in the injured brainWe then used flow cytometry to investigate the effects of NOX2 inhibition on the inflammatory phenotype of microglia and infiltrating myeloid cells after TBI. When compared to vehicle treated CCI mice, GSK2795039 treated CCI mice had reduced numbers of infiltrating monocytes at 3DPI, albeit no difference in infiltrating neutrophil or microglial numbers were observed (Table 1). As expected, vehicle treated CCI mice had increased numbers of NOX2+ and IL-1β+ microglia (CD11b+CD45Int) and infiltrating myeloid cells (CD11b+CD45hi) (Fig. 7A-F; p < 0.0001 vs. sham veh). GSK2795039 treated CCI mice had reduced numbers of NOX2+ and IL-1β+ microglia, but levels failed to reach statistical significance (Fig. 7A-D). Notably, GSK2795039 treated CCI mice had reduced numbers of NOX2+ and IL-1β+ infiltrating myeloid cells (Fig. 7A, B,E, F; p < 0.001 versus CCI Veh).
Table 1 The effect of CCI and GSK2795039 treatment on immune cell population numbers in the brain at 3 DPI. Abbreviations: CCI, controlled cortical impact; Veh, Vehicle; GSK, GSK2795039Fig. 7
Pharmacological NOX2 inhibition reduces NOX2+ IL-1β+ infiltrating myeloid cells in the injured brain. GSK2795039 was administered at 2 h, 12 h, 1 d and 2 d post CCI. Mononuclear cells isolated from the ipsilateral cortex were stained with surface markers followed by intracellular staining of NOX2 and IL-1β and analysed by flow cytometry. CCI increased the absolute number of NOX2+ and IL-1β+ CD11b+CD45Int microglia and CD11b+CD45hi infiltrating cells in vehicle treated CCI mice (C-F; ****p<0.0001 vs. sham veh). GSK2795039 treated CCI mice had reduced #NOX2+ #IL-1β+ microglia, but levels failed to reach significance (C). GSK2795039 treated CCI mice had significantly reduced #NOX2+ IL-1β+ infiltrating cells (E, F; +++p<0.001 vs. CCI veh). Data are mean ± SEM (n = 4–6 per group). ****p<0.0001 vs. sham veh, +++p<0.001 vs. CCI veh; Two-Way ANOVA with uncorrected Fisher’s LSD
We then performed a deeper analysis on neutrophil and monocyte populations in the injured brain. Vehicle treated CCI mice had increased numbers of NOX2+ and IL-1β+ neutrophils (CD11b+CD45hiLy6G+) as well as DP NOX2+IL-1β+ neutrophils (Fig. 8Ai-iv; p < 0.0001 vs. sham veh). Notably, GSK2795039 treated CCI mice had reduced numbers of IL-1β+, NOX2+, and DP NOX2+IL-1β+ neutrophils (Fig. 8Ai-iv; p < 0.05; p < 0.01; p < 0.0001 vs. CCI veh). When examining monocytes (CD11b+CD45hiLy6C+), vehicle treated CCI mice had increased numbers of NOX2+ and IL-1β+ monocytes as well as DP NOX2+IL-1β+ monocytes (Fig. 8Bi-iv; p < 0.0001 vs. sham veh). Notably, GSK2795039 treated CCI mice had reduced numbers of NOX2+ monocytes (Fig. 8Bi-iv; p < 0.05 vs. CCI veh), and reduced numbers of IL-1β+ and DP NOX2+IL-1β+ monocytes, but levels failed to reach statistical significance. The immunophenotyping findings indicate that NOX2 inhibition attenuates TBI neuroinflammation, with specific effects on NOX2+ IL-1β+ neutrophils and monocytes that infiltrate the injured brain.
Fig. 8
Pharmacological NOX2 inhibition reduces absolute numbers of NOX2+ and IL-1β+ neutrophils and NOX2+ monocytes at 3 DPI. GSK2795039 was administered at 2 h, 12 h, 1 d and 2 d post CCI. Mononuclear cells isolated from the ipsilateral cortex were stained with surface markers, followed by intracellular staining of NOX2 and IL-1β, and analysed by flow cytometry. CCI increased the absolute number of NOX2+ and IL-1β+ neutrophils and monocytes in vehicle treated CCI mice (Ai-iv, Bi-iv; ****p < 0.001 vs. sham veh). GSK2795039 reduced #NOX2+ #IL-1β+ neutrophils (Ai-iv; +p < 0.05; ++p < 0.01; ++++p < 0.0001 vs. CCI veh) and #NOX2+ monocytes (Biii; +p < 0.05 vs. CCI veh). Data are mean ± SEM (n = 4–6 per group). ****p < 0.0001 vs. sham veh, +p < 0.05; ++p < 0.01; ++++p < 0.0001 vs. CCI veh; Two-Way ANOVA with uncorrected Fisher’s LSD
NOX2 inhibition reduces IL-1R expression on T cells in the injured brainWe next investigated whether NOX2 inhibition could also alter the adaptive immune response following TBI. When compared to vehicle treated CCI mice, GSK2795039 treated CCI mice had reduced numbers of infiltrating CD3+ lymphocytes, with significantly reduced numbers of CD4+, CD8+ and CD4−/CD8− T cells in the injured brain (Table 1). We hypothesised that IL-1R expressing T cells respond to IL-1β released from cells of myeloid origin, such as microglia or monocytes [
Comments (0)