
Remember me


Periprosthetic joint infection (PJI) is one of the most devastating and costly complications after total joint arthroplasty.1,2 The standard of care for chronic PJI in North America is two-stage exchange arthroplasty, where implants are explanted and replaced with an antibiotic spacer. The spacer is designed to elute antibiotics locally from its cement substrate and stays in place during a course of systemic antibiotics; then it is removed with new implants implanted at a later date.3,4 Reported success rates for this procedure are variable, historically ranging from 65% to 100%, although more recent studies suggest we may be overestimating success in two-stage exchange for PJI, especially when not accounting for patients who never make it to the second stage.5–8
The addition of thermally stable antibiotics to cement spacers, such as aminoglycosides or vancomycin, allows for the local delivery of high-concentration antibiotics that can exceed levels obtained by systemic antibiotics alone.9 However, the choice and dose of antibiotics used in spacers during two-stage exchange varies widely.10 Experts and professional societies recommend the use of high-dose antibiotic cement spacers, defined as greater than 3.6 g of antibiotic per 40 g bag of cement, but these recommendations are based off in vitro studies and lack supporting clinical evidence.10–12 Others have recommended at least 2.0 g of vancomycin and 2.4 g of an aminoglycoside per 40 g bag of cement, but again, these suggestions have no clinical data to support them.3,10 Furthermore, antibiotic elution from the spacer varies depending on the viscosity of the cement used, with higher viscosity cement demonstrating superior elution characteristics.13
Understanding how antibiotic spacer dosing affects clinical outcomes has important implications for increasing the likelihood of success in two-stage exchange and minimizing the potential for adverse effects, such as acute kidney injury (AKI).14 Our primary question is whether commonly recommended antibiotic doses in cement spacers affect overall or infectious treatment failure. We secondarily seek to evaluate their effect on reimplantation, mortality, and readmission for acute renal injury or failure.
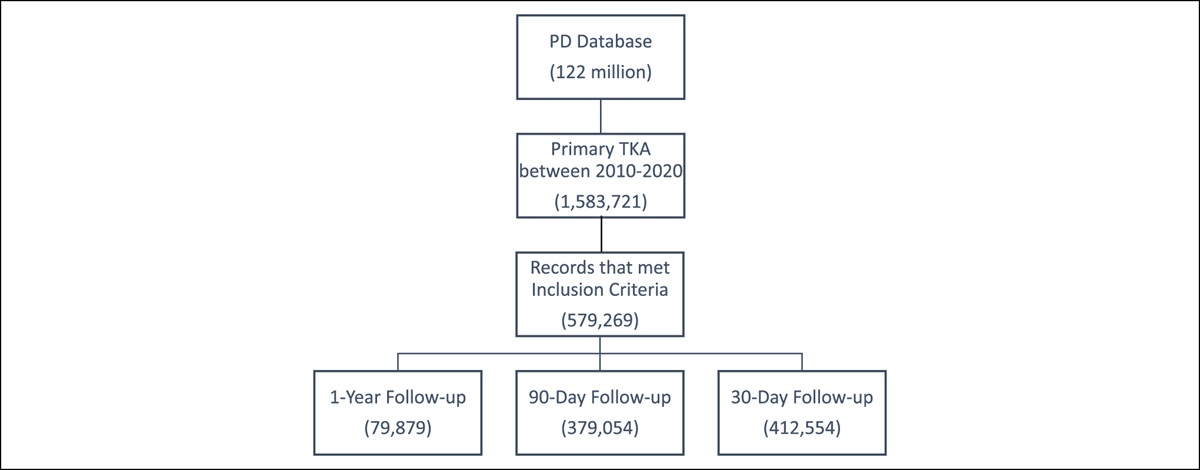
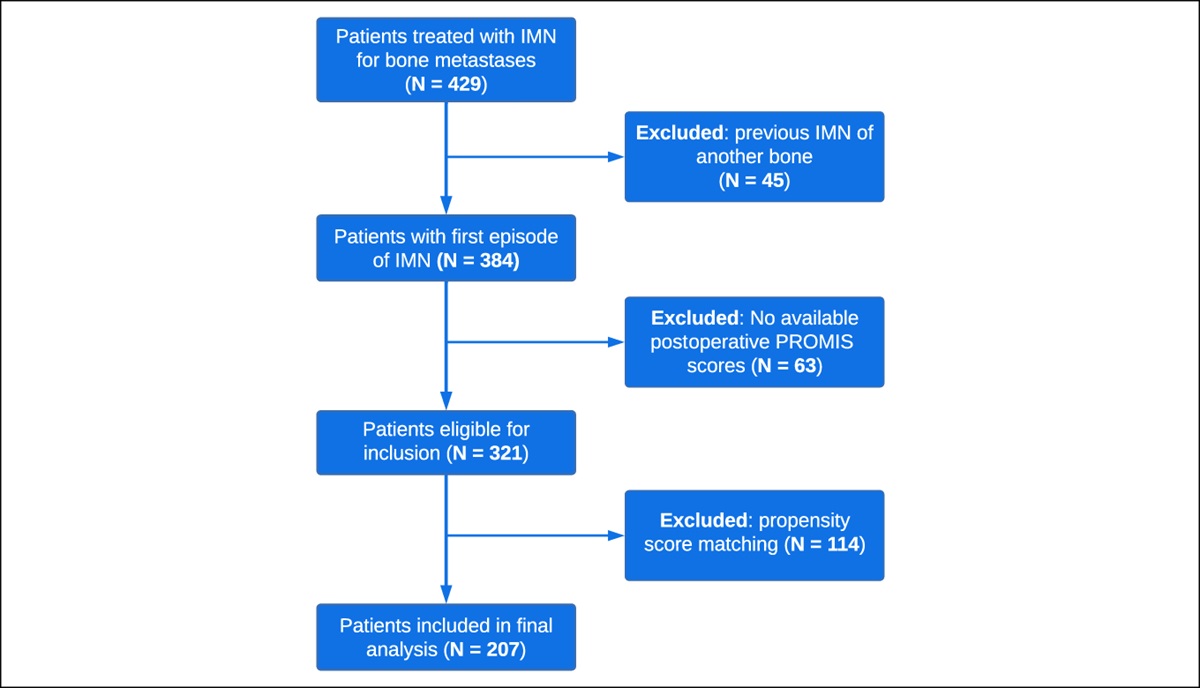
MethodsThis was a retrospective review conducted at a single institution for all patients who underwent two-stage exchange arthroplasty from 2004 to 2020 for PJI based on the definition created by the Musculoskeletal Infection Society (MSIS).15 The study attained institutional review board exemption. Exclusion criteria were patients with a megaprosthesis, those with a fungal infection, those who did not have information on specific antibiotic spacer dosing, and those with a history of prior PJI with spacer placement. Patients with a history of surgical site infection or PJI who only underwent irrigation and débridement were included. All patients were required to have a minimum of 1-year follow-up after initial spacer placement. After exclusion of 58 cases based on these criteria, the final cohort included a total of 202 PJIs. The cohort comprised 56 primary total hip arthroplasties, 79 primary total knee arthroplasties, 27 revision total hip arthroplasties, and 40 revision total knee arthroplasties.
Patients were separated into high and low-dose groups based on the definition of high-dose antibiotic spacers as containing greater than 3.6 g of total antibiotic per 40 g of cement.12
Surgical TechniqueOur treatment protocol is demonstrated in Figure 1. For all patients, a thorough synovectomy and débridement with at least 9 L of fluid was performed. Additional antimicrobial irrigation solutions were used at the discretion of the treating surgeon. An antibiotic spacer was placed. The choice and dose of the antibiotic used in the spacer was based on surgeon preference. The decision to use an articulating or static spacer was also based on surgeon discretion. Articulating spacers were fashioned by hand, made from preformed molds, or included prosthetic implants comprising metal and/or polyethylene. Among articulating spacers, 69% (78/113) contained metal and/or polyethylene components. A total of 6 to 8 weeks of systemic antibiotics was administered based on the culture results and recommendations by an infectious disease consultant. In addition, the serum erythrocyte sedimentation rate and C-reactive protein were trended. An antibiotic holiday period of 4 to 6 weeks was routinely used before reimplantation, during which time clinical symptoms were monitored. Repeat aspiration during this period was based on the decision of the surgeon because there was no institutional protocol to determine timing of reimplantation. Repeat débridement was performed at the time of reimplantation, and revision implants were used. Administration of extended postoperative oral antibiotics was the decision of the treating surgeon.
 Figure 1:
 Flowchart showing a summary of the treatment protocol for periprosthetic joint infection.
Outcome VariablesA retrospective chart review was conducted to obtain surgical details, including type and dose of antibiotic used in spacers, cement type, dates and clinical course of any subsequent surgeries after initial spacer placement, need for amputation, hospital readmissions for AKI or acute renal failure, mortality, organism culture information, and use of extended postoperative oral antibiotics which was defined as use for ≥3 months after reimplantation. For preloaded antibiotic cement, the type and dose of the preloaded antibiotic was included in calculations of the antibiotic dose. Antibiotic-resistant organisms included vancomycin-resistant Enterococcus and methicillin resistant Staphylococcus aureus. An electronic query of the medical record was also conducted to extract details on age, sex, body mass index, comorbidities, tobacco use, alcohol use, and drug use. Patients were classified as A, B, or C hosts according to the McPherson classification for systemic host grade.16
Primary and Secondary OutcomesThe primary outcomes were overall treatment failure and treatment failure for infectious reasons. Overall treatment success was based on a recent definition from the MSIS.17 Tier 1 or 2 were defined as a success while Tier 3 or 4 were defined as failure, which included patients who were not reimplanted, died, or underwent any unplanned revision surgeries (Table 1). Treatment failure for infection included any repeat irrigation and débridement, spacer exchange, or amputation. Secondary outcomes included mortality, failure to undergo reimplantation, and readmission for AKI or acute renal failure. Subanalyses were run for infected primaries, infected revisions, high-viscosity cement spacers, and low-viscosity cement spacers.
Table 1 - Treatment Success Definition Success Tier 1 Infection control with no continued antibiotic therapy Tier 2 Infection control with the patient on suppressive antibiotic therapy Failure Tier 3 Need for revision surgery and/or revision and/or spacer retention (assigned to subgroups A, B, C, D, E, and F based on the type of revision surgery) A Aseptic revision at >1 yr from initiation of PJI treatment B Septic revision (including débridement, antibiotics, and implant retention [DAIR]) at >1 year from initiation of PJI treatment (excluding amputation, resection arthroplasty, and arthrodesis) C Aseptic revision at ≤1 yr from initiation of PJI treatment D Septic revision (including DAIR) at ≤1 year from initiation of PJI treatment (excluding amputation, resection arthroplasty, and arthrodesis) E Amputation, resection arthroplasty, or arthrodesis F Retained spacer Tier 4 Death (assigned to subgroups A or B) A Death <1 yr from initiation of PJI treatment B Death >1 yr from initiation of PJI treatmentPJI = periprosthetic joint infection
All statistical analyses were conducted using SPSS (Version 21.0, IBM). Continuous variables were evaluated using Student t-test or Mann-Whitney U tests as appropriate. Categorical variables were assessed using a Fisher exact test or chi square test, and odds ratios were calculated.
Univariate analyses were conducted to compare demographic and other perioperative variables. Individual vancomycin and aminoglycoside doses were used as predictive variables in univariate analyses. Cutoffs of ≥2.0 g for vancomycin and ≥2.4 g for aminoglycoside were used based on published dosage recommendations per 40 g bag of cement.3 A multivariate logistic regression model was used to determine risk factors for the primary outcomes, overall treatment failure, and treatment failure for infection. The logistic regression included demographic variables, baseline characteristics that differed between high and low-dose groups, information on the infecting organism, and variables below a P-value threshold of 0.2 in univariate analysis. Final variables included in the model for overall failure were female sex, age older than 80 years, knee, infected primary, static spacer, high-viscosity cement, diabetes mellitus, hypothyroidism, renal failure, alcohol abuse, drug abuse, tobacco use, gram-positive, gram-negative, polymicrobial, resistant organism, and culture-negative. Final variables included in the model for infectious failure were female sex, age older than 80 years, knee, infected primary, static spacer, high-viscosity cement, renal failure, liver disease, alcohol abuse, drug abuse, tobacco use, gram-positive, gram-negative, polymicrobial, resistant organism, and culture-negative. Separate regression analyses were run for total antibiotic dose and for individual vancomycin and aminoglycoside doses.
To investigate the full spectrum of total and individual antibiotic doses, sequential antibiotic dose thresholds were entered into the regression models for overall and infectious failure (eg, dose ≥1 g, dose ≥2 g, dose ≥3 g). This was done separately for the total antibiotic dose, vancomycin dose, and aminoglycoside dose. For all analyses, an alpha of 0.05 was used to determine statistical significance.
ResultsIn our cohort, 80% (n = 162) of patients received a high-dose spacer (>3.6 g of total antibiotic per 40 g of cement), and 20% (n = 40) received a low-dose spacer. High-dose spacers were more likely to contain tobramycin (92% versus 80%, P = 0.026) and to be composed of high-viscosity cement (P < 0.001). Regarding the infecting organism in the overall cohort, 74% (150/202) of infections were caused by gram-positive bacteria, 14% (28/202) were gram-negative bacteria, 14% (28/202) were polymicrobial, 29% (58/202) were resistant, and 17% (35/202) were culture-negative. No significant differences were observed in baseline demographics or comorbidities between high and low-dose groups (Table 2).
Table 2 - Demographics and Characteristics of High and Low-Dose Groups High-dose (n = 162) Low-dose (n = 40) P Female 50.6% (82/162) 55.0% (22/40) 0.619 Age (yr) 63.6 ± 10.7 63.2 ± 11.6 0.818 Knee 59.9% (97/162) 55.0% (22/40) 0.575 Infected primary 67.9% (110/162) 62.5% (25/40) 0.516 Antibiotics in spacer Vancomycin 99.4% (161/162) 100.0% (40/40) 0.618 Cefazolin 6.2% (10/162) 0.0% (0/40) 0.107 Tobramycin 92.0% (149/162) 80.0% (32/40) 0.026 Gentamicin 20.4% (33/162) 7.5% (3/40) 0.057 Static spacer 42.6% (69/162) 50.0% (20/40) 0.398 Cement <0.001 High-viscosity 82.1% (133/162) 37.5% (15/40) Low-viscosity 16.0% (26/162) 55.0% (22/40) Unknown 1.9% (3/162) 7.5% (3/40) ≥3 mo postop antibiotics 66.4% (93/140) 61.3% (19/31) 0.586 BMI 30.3 ± 8.1 29.9 ± 6.5 0.751 Diabetes mellitus 16.1% (26/162) 22.5% (9/40) 0.334 Hypothyroid 10.5% (17/162) 7.5% (3/40) 0.570 Renal failure 16.7% (27/162) 27.5% (11/40) 0.116 Liver disease 13.0% (21/162) 7.5% (3/40) 0.339 AIDS 0.6% (1/162) 0.0% (0/40) 0.618 Rheumatological disease 6.2% (10/162) 0.0% (0/40) 0.107 Alcohol abuse 4.9% (8/162) 12.5% (5/40) 0.081 Drug abuse 7.4% (12/162) 12.5% (5/40) 0.299 Psychosis 1.3% (2/162) 5.0% (2/40) 0.126 Depression 27.8% (45/162) 35.0% (14/40) 0.368 Tobacco use 9.3% (15/162) 12.5% (5/40) 0.539 ASA score 2.6 ± 0.6 2.5 ± 0.7 0.227 Host grade 0.401 A 46.9% (76/162) 37.5% (15/40) B 47.5% (77/162) 52.5% (21/40) C 5.6% (9/162) 10.0% (4/40) Organism Gram-positive 75.9% (123/162) 67.5% (27/40) 0.275 Gram-negative 14.8% (24/162) 10.0% (4/40) 0.430 Polymicrobial 14.2% (23/162) 12.5% (5/40) 0.781 Resistant organisms 27.8% (45/162) 32.5% (13/40) 0.554 Culture-negative 14.8% (24/162) 27.5% (11/40) 0.058Bolded entries denote statistical significance at p<0.05
The overall treatment failure rate for the entire cohort was 43% (87/202), and the infectious failure rate was 31% (63/202). No significant difference was observed in the overall (40% versus 55%, P = 0.089) or infectious (28% versus 43%; P = 0.085) failure rate between high and low-dose groups when considering primary and revision infections together; however, for primary infections, high-dose antibiotic cement spacers were associated with lower odds of overall failure (OR, 0.37; 95% CI, 0.15 to 0.89; P = 0.024) and infectious failure (OR, 0.35; 95% CI, 0.14 to 0.86; P = 0.020). No differences were noted in overall or infectious failure when analyzing high-viscosity cement spacers separately; however, there was an increased overall failure rate in low-dose and low-viscosity cement spacers (OR, 0.30; 95% CI, 0.10 to 0.92; P = 0.033) (Table 3).
Table 3 - Primary and Secondary Outcomes for High and Low-Dose Groups High-Dose Low-Dose Odds Ratio P Overall failure Overall 40.1% (65/162) 55.0% (22/40) 0.55 (0.27-1.10) 0.089 Primary 35.5% (39/110) 60.0% (15/25) 0.37 (0.15-0.89) 0.024 Revision 50.0% (26/52) 46.7% (7/15) 1.14 (0.36-3.61) 0.820 High-viscosity cement 42.1% (56/133) 46.7% (7/15) 0.83 (0.29-2.43) 0.735 Low-viscosity cement 31.0% (9/29) 60.0% (15/25) 0.30 (0.10-0.92) 0.033 Infectious failure Overall 28.4% (46/162) 42.5% (17/40) 0.54 (0.26-1.10) 0.085 Primary 24.6% (27/110) 48% (12/25) 0.35 (0.14-0.86) 0.020 Revision 36.5% (19/52) 33.3% (5/15) 1.15 (0.34-3.87) 0.820 High-viscosity cement 30.1% (40/133) 40.0% (6/15) 0.65 (0.22-1.93) 0.431 Low-viscosity cement 20.7% (6/29) 44.0% (11/25) 0.33 (0.10-1.10) 0.066 No reimplantation Overall 13.6% (22/162) 22.5% (9/40) 0.54 (0.23-1.29) 0.161 Primary 11.8% (13/110) 20.0% (5/25) 0.54 (0.17-1.67) 0.277 Revision 17.3% (9/52) 26.7% (4/15) 0.58 (0.15-2.22) 0.419 High-viscosity cement 15.0% (20/133) 33.3% (5/15) 0.35 (0.11-1.15) 0.073 Low-viscosity cement 6.9% (2/29) 16.0% (4/25) 0.39 (0.07-2.33) 0.289 Mortality Overall 4.9% (8/162) 5.0% (2/40) 0.99 (0.20-4.84) 0.987 Primary 3.6% (4/110) 8.0% (2/25) 0.43 (0.08-2.51) 0.339 Revision 7.7% (4/52) 0.0% (0/15) 2.88 (0.15-56.47) 0.268 High-viscosity cement 4.5% (6/133) 0.0% (0/15) 1.58 (0.09-29.43) 0.401 Low-viscosity cement 6.9% (2/29) 8.0% (2/25) 0.85 (0.11-6.53) 0.877 Readmission for AKI/ARF Overall 3.1% (5/162) 7.5% (3/40) 0.39 (0.09-1.72) 0.200 Primary 2.7% (3/110) 4.0% (1/25) 0.67 (0.07-6.75) 0.735 Revision 3.8% (2/52) 13.3% (2/15) 0.26 (0.03-2.03) 0.172 High-viscosity cement 3.8% (5/133) 13.3% (2/15) 0.25 (0.05-1.44) 0.098 Low-viscosity cement 0.0% (0/29) 4.0% (1/25) — —AKI = acute kidney injury, ARF = acute renal failure
Bolded entries denote statistical significance at p<0.05
In multivariate analysis, use of a high-dose total antibiotic in spacers was not significantly associated with overall (OR, 0.71; 95% CI, 0.30 to 1.67; P = 0.427) or infectious (OR, 0.53; 95% CI, 0.21 to 1.32; P = 0.172) failure. High individual vancomycin dose (≥2.0 g of antibiotic per 40 g of cement) did not reduce the risk of overall treatment failure (OR, 0.51; 95% CI, 0.21 to 1.27; P = 0.147), but it was associated with a decreased risk of infectious failure (OR, 0.31; 95% CI, 0.12 to 0.81; P = 0.016). High individual aminoglycoside dose (≥2.4 g of antibiotic per 40 g of cement) was not associated with a reduced risk of overall (OR, 1.11; 95% CI, 0.54 to 2.29; P = 0.785) or infectious (OR, 1.28; 95% CI, 0.58 to 2.80; P = 0.539) failure. Alcohol use disorder was a predictor of infectious failure (OR, 5.61; 95% CI, 1.25 to 25.16; P = 0.024) (Tables 4 and 5).
Table 4 - Multivariate Analysis for Overall Failure Odds Ratio (95% CI) P Total antibiotic dose Female 1.405 (0.738-2.675) 0.300 Age >80 yr 1.348 (0.393-4.623) 0.635 Knee 0.945 (0.488-1.831) 0.867 Infected primary 0.750 (0.374-1.505) 0.418 Total antibiotic dose >3.6 g 0.705 (0.297-1.671) 0.427 Static spacer 1.750 (0.900-3.402) 0.099 High-viscosity cement 1.042 (0.474-2.291) 0.919 Diabetes mellitus 1.265 (0.539-2.967) 0.589 Hypothyroid 0.655 (0.216-1.990) 0.456 Renal failure 2.111 (0.939-4.748) 0.071 Alcohol abuse 3.716 (0.929-14.864) 0.063 Drug abuse 1.909 (0.599-6.091) 0.274 Tobacco use 1.593 (0.550-4.614) 0.391 Gram-positive 0.656 (0.090-4.775) 0.677 Gram-negative 1.228 (0.227-6.662) 0.811 Polymicrobial 1.810 (0.576-5.686) 0.310 Resistant organisms 2.003 (0.955-4.203) 0.066 Culture-negative 1.113 (0.140-8.873) 0.920 Individual vancomycin and aminoglycoside doses Female 1.419 (0.745-2.704) 0.287 Age >80 yr 1.329 (0.385-4.591) 0.653 Knee 0.958 (0.488-1.881) 0.901 Infected primary 0.753 (0.376-1.511) 0.425 Vancomycin dose ≥2.0 g 0.511 (0.206-1.266) 0.147 Aminoglycoside dose ≥2.4 g 1.107 (0.535-2.290) 0.785 Static spacer 1.771 (0.903-3.474) 0.096 High-viscosity cement 1.115 (0.511-2.432) 0.784 Diabetes mellitus 1.280 (0.541-3.029) 0.574 Hypothyroid 0.663 (0.216-2.040) 0.474 Renal failure 2.159 (0.964-4.835) 0.061 Alcohol abuse 3.614 (0.885-14.753) 0.073 Drug abuse 1.848 (0.574-5.947) 0.303 Tobacco use 1.709 (0.587-4.980) 0.326 Gram-positive 0.674 (0.092-4.940) 0.698 Gram-negative 1.246 (0.227-6.835) 0.800 Polymicrobial 1.763 (0.559-5.558) 0.333 Resistant organisms 1.990 (0.946-4.186) 0.070 Culture negative 1.143 (0.142-9.175) 0.900
Comments (0)