
Remember me


Bone metastases are a common occurrence in patients with breast, prostate, kidney, or lung cancer, and approximately 20 to 25% of patients with metastatic bone disease experience impending or pathologic fractures.1 In this population, pathologic fractures are associated with a notable decrease in quality of life and overall survival and, as such, often treated surgically.2 Intramedullary nailing (IMN) is an effective procedure to prophylactically or therapeutically stabilize the bone and prevent additional fracture.3 Owing to the limited life expectancy of these patients, the goal of this surgical procedure was to improve the patient's quality of life by reducing pain and increasing functional mobility.
Patient-reported outcomes (PROs) have had a notable effect on the care of orthopaedic patients in various subspecialties, such as hand, foot and ankle, and spine.4–6 In musculoskeletal oncology, the Toronto Extremity Salvage Score is the most commonly used PRO measure for patients undergoing surgery for extremity tumors.7,8 The Patient-Reported Outcomes Measurement Information System (PROMIS) is a set of patient-reported outcome (PRO) questionnaires developed by the National Institutes of Health, which have also been extensively studied in the orthopaedic population.9 In orthopaedic oncology, studies have reported that PROMIS Pain Interference and Physical Function scores correlate with Toronto Extremity Salvage Scores.9 Despite the increasing use of PROs, there is limited literature on oncologic patients undergoing pathologic fracture fixation with IMN.
In recent years, the mechanical and biocompatible properties of carbon fiber (CF) have led to its increasing utilization in orthopaedic implants, such as intramedullary nails.10,11 Among their several benefits, CF nails stand out for being radiolucent and may provide better visualization of fracture reduction and tumor recurrence after bone stabilization. Despite available literature on the biomechanical properties and clinical outcomes of patients treated with carbon fiber polyetheretherketone nails,12,13 no studies have compared postoperative PROs between CF and titanium implants. This remains critically important because the lack of data on PROs after CF IMN might limit the adoption of this technique among physicians. Therefore, we focused our study strictly on the PROs after IMN with either CF or titanium implants. Other areas of comparison such as clinical outcomes are not covered because previous multicenter studies spearheaded by our group have demonstrated similarity between implant types.13–15
In patients treated with intramedullary nailing for impending or pathologic fractures due to bone metastases, our study sought to assess the following: (1) What are the PROs for physical function, mental function, and pain visual analog scale (VAS) after IMN? (2) Are postoperative PROs for physical function, mental function, and pain VAS different between patients treated with CF or titanium nails?
Materials and Methods Study Design and SettingWe obtained Institutional Review Board approval before the beginning of the study. A retrospective review of the electronic medical records of patients treated at a large tertiary care academic center was conducted.
ParticipantsInclusion criteria for our study were the following: (1) surgical treatment of an impending or pathologic fracture of the femur, humerus, or tibia with intramedullary nailing, (2) metastatic bone disease as the cause of the impending or complete fracture, (3) surgery performed between 2016 and 2022, and (4) completion of at least one postoperative PROMIS assessment at the 1-month, 3-month, 6-month, or 1-year time points. Because PROMIS questionnaires through the electronic health record portal only became available in 2016 at our institution, we restricted our analysis to patients treated from 2016 onward.
Patients undergoing IMN with a CF implant received any of the following implants: CarboFix Trochanteric Nailing System, CarboFix Tibial Nail, and CarboFix Humeral Nail. All CF implants were manufactured by CarboFix Orthopaedics. In the group treated with titanium nails, the following implants were used: Cannulated Trochanteric Fixation Nail (DePuy Synthes Inc), Cannulated Tibial Nail (DePuy Synthes Inc), and Cannulated Humeral Nails (DePuy Synthes Inc). All cephalomedullary nails were combined with a lag screw. Surgeons had the option to choose between CF or titanium implants, with CF being preferred for aggressive tumors with a high chance of recurrence or when visualizing the response to radiation therapy was essential.
Variables and Outcomes of InterestThe following demographic and clinical parameters were obtained from each patient chart: age, sex, American Society of Anesthesiologists (ASA) class, body mass index, age-adjusted Charlson comorbidity index (CCI), type of primary tumor, type of fracture (impending or complete), type of lesion (lytic, sclerotic, or mixed), type of nail (CF or titanium), nail location, bone region, length of stay in days, and follow-up in months.
Outcomes of interest were postoperative PROs, measured using the PROMIS questionnaires and pain VAS. Regarding PROMIS, scores from three questionnaires were assessed: Global Health Short Form (SF) Mental (SF Mental), Global Health SF Physical (SF Physical), and Physical Function SF 10a (SF 10a). When available, preoperative scores for each of the included outcome measures were extracted. Only assessments filled within 120 days before surgery were considered. When multiple preoperative values existed, the closest to the date of surgery was selected.
Patient-reported outcomes were assessed after surgery at the 1-month, 3-month, 6-month, and 1-year time points. A margin of error of ± 10 days was allowed for the 1-month mark; as such, assessments completed between postoperative days 20 and 40 could be included as 1-month scores. Margins of error of ± 20, ± 30, and ± 60 days were used for the 3-month, 6-month, and 1-year marks, respectively. When multiple scores were available within a certain period, the value closest to the exact mark (30, 90, 180, and 365 days) was used. This strategy was implemented because completion of questionnaires depended on patients accessing the electronic health record portal and filling the forms online.
Absolute and differential scores at each of the time points of interest were assessed. Differential scores were calculated by subtracting preoperative scores for each assessment from their respective absolute scores at each time point. Because calculation of differential scores required availability of both postoperative and preoperative PROMIS scores, the number of analyzable events was lower than the number of absolute scores (Supplementary Table 1, https://links.lww.com/JG9/A347). Improvement in differential postoperative scores was seen as a positive value in the case of PROMIS SF Physical, SF Mental, and SF 10a scores and a negative value in the case of pain VAS score.
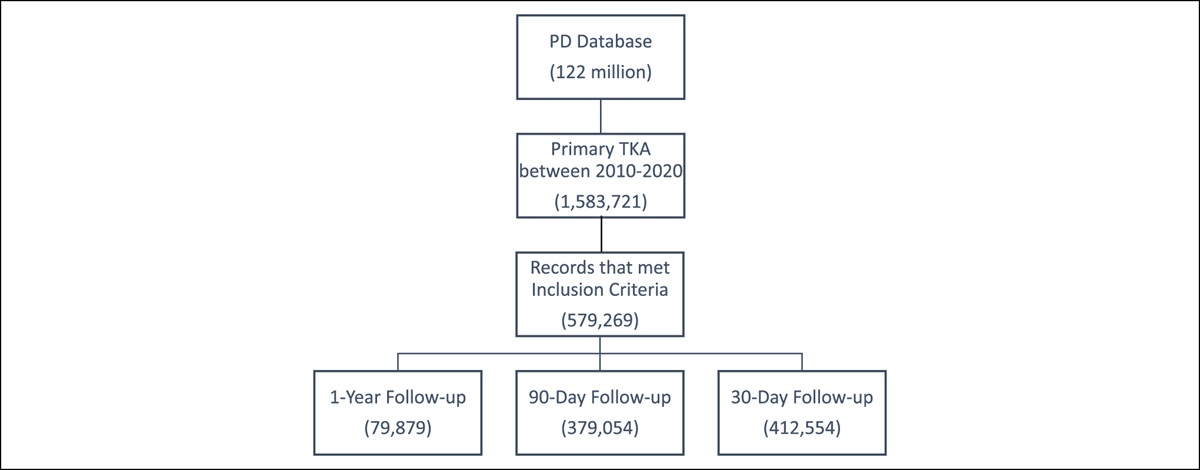
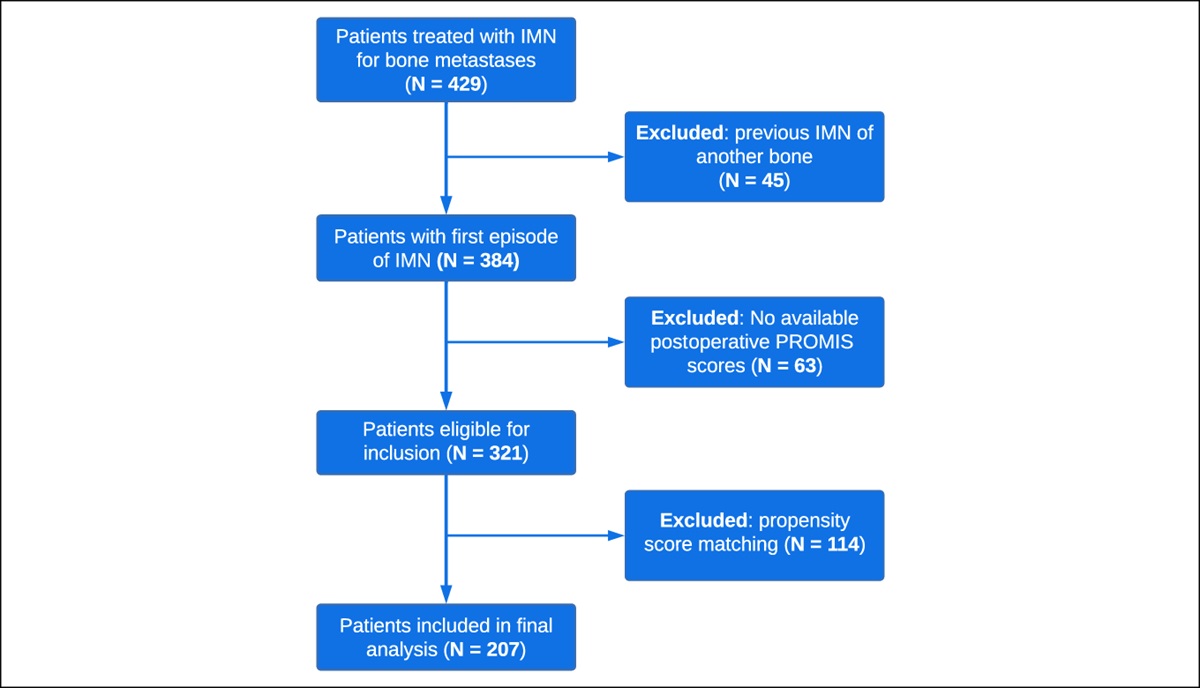
Patient PopulationA total of 321 patients treated with IMN for pathologic or impending fractures were eligible for inclusion. A different distribution of covariables between patients treated with CF or titanium nails was seen in the unmatched cohort (Table 1). After propensity score matching, 207 patients were included in the final analysis (Figure 1). Fifty-one patients (24.6%) were treated with CF nails and 156 (75.4%) with titanium nails (Table 1). The median age was 68 and 67 years for the CF and titanium groups, respectively. No differences in sex, ASA class, body mass index, age-adjusted CCI, and primary tumor type were seen between groups. Impending fractures were found in 76.5% and 72.4% of patients treated with CF or titanium nails, respectively (P = 0.57). Lytic lesions were present in 76.9% and 85.6% of patients treated with CF or titanium nails, respectively (P = 0.35). The femur was the most common location for IMN in both groups, most lesions were located in the diaphyseal region of the bone in both groups, and the median length of stay was 3 days for both groups. Furthermore, we found similar overall survival between groups (Figure 2).
Table 1 - Demographic and Clinical Characteristics of Included Patients Before and After Propensity Score Matching Base Cohort (n = 321) PSM Cohort (n = 207) Carbon fiber (n = 54) Titanium (n = 267) P Carbon fiber (n = 51) Titanium (n = 156) P Agea 68 (57, 74) 66 (58, 72) 0.39 68 (57, 74) 67 (58, 73) 0.50 Female sex 32 (59.3%) 138 (51.7%) 0.31 31 (60.8%) 76 (48.7%) 0.13 ASA class – – 0.044 – – 0.44 1 0 (0.0%) 1 (0.4%) – 0 (0.0%) 1 (0.6%) – 2 13 (24.1%) 27 (10.2%) – 10 (19.6%) 22 (14.1%) – 3 39 (72.2%) 223 (84.2%) – 39 (76.5%) 131 (84.0%) – 4 2 (3.7%) 14 (5.3%) – 2 (3.9%) 2 (1.3%) – BMIa 25 (22, 28) 26 (23, 30) 0.27 25 (22, 28) 26 (23, 30) 0.11 Age-adjusted CCIa 9 (8, 11) 9 (8, 10) 0.62 9 (8, 11) 9 (8, 10) 0.98 Primary tumor – – 0.47 – – 0.78 Breast 11 (20.4%) 67 (25.1%) – 11 (21.6%) 37 (23.7%) – Lung 17 (31.5%) 56 (21.0%) – 15 (29.4%) 30 (19.2%) – Renal 5 (9.3%) 38 (14.2%) – 5 (9.8%) 25 (16.0%) – Multiple myeloma 8 (14.8%) 27 (10.1%) – 7 (13.7%) 21 (13.5%) – Prostate 2 (3.7%) 20 (7.5%) – 2 (3.9%) 8 (5.1%) – Other 10 (18.5%) 56 (21.0%) – 10 (19.6%) 33 (21.2%) – Unknown primary 1 (1.9%) 3 (1.1%) – 1 (2.0%) 2 (1.3%) – Fracture type – – 0.002 – – 0.57 Impending 42 (77.8%) 148 (55.4%) – 39 (76.5%) 113 (72.4%) – Complete 12 (22.2%) 119 (44.6%) – 12 (23.5%) 43 (27.6%) – Lesion type – – 0.99 – – 0.35 Lytic 31 (77.5%) 148 (77.9%) – 30 (76.9%) 95 (85.6%) – Sclerotic 4 (10.0%) 18 (9.5%) – 4 (10.3%) 5 (4.5%) – Mixed 5 (12.5%) 24 (12.6%) – 5 (12.8%) 11 (9.9%) – Bone involved – – 0.036 – – 0.96 Femur 36 (66.7%) 209 (78.3%) – 36 (70.6%) 107 (68.6%) – Humerus 13 (24.1%) 51 (19.1%) – 13 (25.5%) 43 (27.6%) – Tibia 5 (9.3%) 7 (2.6%) – 2 (3.9%) 6 (3.8%) – Bone region – – 0.18 – – 0.14 Epiphyseal 21 (38.9%) 86 (32.2%) – 20 (39.2%) 48 (30.8%) – Diaphyseal 28 (51.9%) 169 (63.3%) – 26 (51.0%) 101 (64.7%) – Metaphyseal 5 (9.3%) 12 (4.5%) – 5 (9.8%) 7 (4.5%) – Length of stay (days)a 3 (2, 6) 3 (2, 6) 0.54 3 (2, 7) 3 (2, 6) 0.88 Follow-up (months)a 11 (3.1, 28) 9 (3.5, 25) 0.86 11 (2.9, 28) 11 (3.8, 32) 0.34ASA = American Society of Anesthesiologists, BMI = body mass index, CCI = Charlson comorbidity index, PSM = propensity score matching, STS = soft-tissue sarcoma.
aMedian values and interquartile ranges between brackets.
Bold entries indicate p-value < 0.05.
 Figure 1:
 Flowchart showing patient inclusion.
 Figure 2:
 Graph demonstrating overall survival of patients by treatment group.
The median preoperative PROMIS SF Physical score was 36.2 in the CF group and 37.4 in the titanium one (P = 0.80) (Table 2). No differences were seen in preoperative PROMIS SF Mental (P = 0.43) and SF 10a (P = 0.79) scores between groups. Patients treated with CF nails had a higher preoperative pain VAS score than those treated with titanium nails (P = 0.03).
Table 2 - Preoperative PROMIS and Pain VAS Scores by Type of Intramedullary Nailing Carbon Fiber (n = 51) Titanium (n = 156) P PROMIS Global Health SF Physicala 36.15 (32.4, 42.3) 37.4 (32.4, 42.3) 0.80 PROMIS Global Health SF Mentala 42.6 (38.8, 48.3) 45.8 (36.6, 50.8) 0.43 PROMIS Physical Function SF 10aa 34.4 (30.4, 38.5) 33.75 (29.1, 38.7) 0.79 Pain VASa 6 (4, 8) 5 (2, 7) 0.03PROMIS = Patient-Reported Outcomes Measurement Information System, SF = Short Form, VAS = visual analog scale.
aMedian values and interquartile ranges between brackets.
Bold entries indicate p-value < 0.05.
Demographic, clinical, and PROMIS variables were displayed using descriptive characteristics. The Shapiro-Wilk test was used to check for normal distribution of data. Because data were non-normally distributed (P < 0.05 on Shapiro-Wilk test), median values and interquartile ranges were used for continuous variables. Differences between groups were compared using the Mann-Whitney U test (nonparametric) for continuous variables and chi-square for categorical ones. To reduce the effect of potential confounding between CF and titanium IMN, patients were matched using propensity scores. Propensity score matching was conducted using a three-to-one nearest neighbor matching without replacement and a caliper fixed at 0.1. The propensity scores were calculated using a logit model including the following variables: age-adjusted CCI, type of primary tumor, ASA class, type of fracture, and location of the nail. A P value ≤ 0.05 was considered statistically significant. All statistical analyses were conducted using Stata (StataCorp, USA).
Results What Are the Patient-Reported Outcomes for Physical Function, Mental Function, and Pain Visual Analog Scale After Intramedullary Nailing?One month postoperatively, the overall mean PROMIS SF Physical score was 37.4 while SF Mental and SF 10a scores were 45.8 and 31.8, respectively (Table 3). The median pain VAS score was three during that period. One-month differential scores showed a one-point decrease in the pain VAS score while PROMIS SF Physical, SF Mental, and SF 10a still did not present improvement. Three months postoperatively, the median reported pain VAS scores decreased by two points and there was a 3.85-point, 1.25-point, and three-point improvement in median PROMIS SF Physical, SF Mental, and SF 10a scores, respectively. At 6 months and one year postoperatively, the median PROMIS SF Physical, SF Mental, and SF 10a scores were higher than preoperative scores. Pain VAS scores decreased by a median of one and three points at the 6-month and 1-year postoperative marks, respectively.
Table 3 - Absolute and Differential PROMIS and Pain VAS Scores for the Entire Cohort Absolute Scores at Each Time Point 1-month postoperative 3-month postoperative 6-month postoperative 1-year postoperative PROMIS Global Health SF Physicala 37.4 (32.4, 42.3) 39.8 (36.15, 44.9) 42.3 (34.9, 44.9) 42.3 (37.4, 50.8) PROMIS Global Health SF Mentala 45.8 (38.8, 50.8) 45.8 (38.8, 53.3) 45.8 (41.1, 56) 50.8 (45.8, 59) PROMIS Physical Function SF 10aa 31.8 (26.9, 35.7) 35.25 (29.6, 38.7) 39.4 (34.8, 43.5) 37.5 (33.35, 45.5) Pain VASa 3 (2, 6) 3 (1, 5) 3 (0, 5) 2 (0, 4.5) Difference Between Preoperative and Postoperative Scores at Each Time Point Preoperative to 1-month postoperative Preoperative to 3-month postoperative Preoperative to 6-month postoperative Preoperative to 1-year postoperative PROMIS Global Health SF Physicala 0 (−6.75, 2.8) 3.85 (0, 9.95) 4.05 (−1.2, 9.25) 3.85 (0, 13.9) PROMIS Global Health SF Mentala 0 (−6.5, 2.7) 1.25 (−2.35, 5) 2.5 (−2.7, 4.8) 9.75 (−5.2, 15.1) PROMIS Physical Function SF 10aa 0.8 (−7.3, 6.1) 3 (−2.3, 5.8) 7.7 (3.4, 13.1) 6.3 (0.2, 10.9) Pain VASa −1 (−3, 1) −3 (−5, 0) −1 (−3, 0) −3 (−4, 0)PROMIS = Patient-Reported Outcomes Measurement Information System, SF = Short Form, VAS = visual analog scale.
aMedian values and interquartile ranges between brackets.
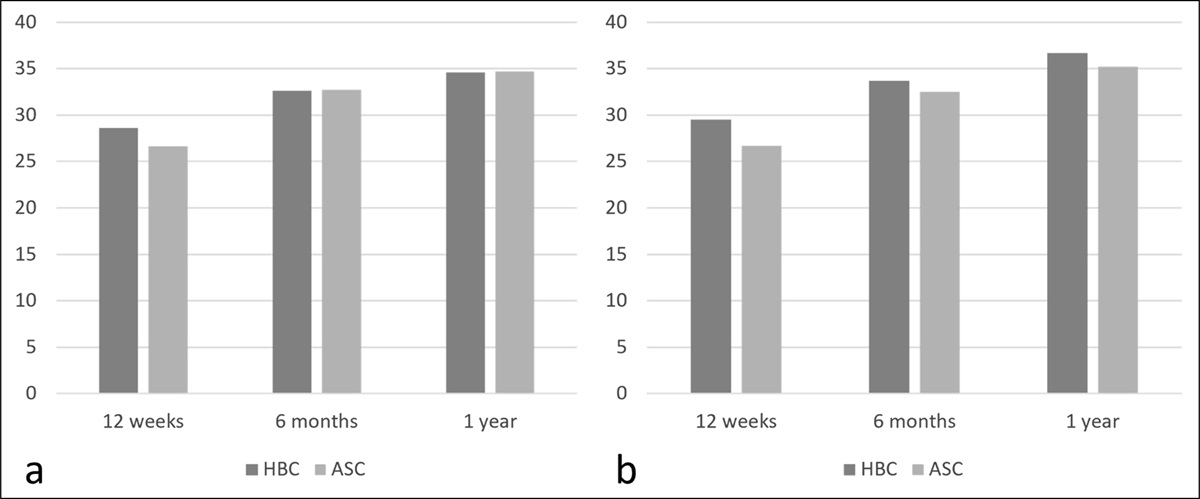
At 1 month postoperatively, no differences in PROMIS SF Physical, SF Mental, and SF 10a scores were seen between groups (Table 4 and Figure 3). The median pain VAS score was higher in patients treated with CF nails (P = 0.001). No differences in absolute scores were seen in PROMIS SF Physical, SF Mental, SF 10a, or pain VAS scores between groups at the 3-month, 6-month, and 1-year marks (Table 4).
Table 4 - Absolute PROMIS and Pain VAS Scores by Type of Intramedullary Nailing 1-Month Postoperative 3-Month Postoperative 6-Month Postoperative 1-Year Postoperative Carbon fiber Titanium P Carbon fiber Titanium P Carbon fiber Titanium P Carbon fiber Titanium P PROMIS Global Health SF Physicala 34.9 (29.6, 44.9) 37.4 (32.4, 42.3) 0.12 42.3 (39.8, 44.9) 38.6 (34.9, 44.9) 0.48 42.3 (37.4, 50.8) 41.05 (34.9, 44.9) 0.46 42.3 (37.4, 57.7) 42.3 (37.4, 50.8) 0.64 PROMIS Global Health SF Mentala 41.1 (36.3, 50.8) 45.8 (41.1, 50.8) 0.29 44.65 (41.1, 50.8) 45.8 (37.55, 56) 0.75 45.8 (43.5, 53.3) 45.8 (41.1, 56) 0.96 59 (50.8, 62.5) 50.8 (45.8, 53.3) 0.14 PROMIS Physical Function SF 10aa 31.8 (24.1, 37.2) 31.6 (27.1, 35.7) 0.81 34.8 (29.4, 39.3) 35.7 (31.2, 37.9) 0.45 38.5 (32.5, 43.5) 39.8 (36.35, 43.5) 0.33 36.65 (31.35, 45.5) 37.55 (35, 45.5) 0.62 Pain VASa 6 (3, 7) 3 (2, 5) 0.001 2 (1, 3) 3.5 (0.5, 5) 0.19 3 (1, 4) 3 (0, 5) 0.85 3 (0, 4) 1 (0, 5) 0.75PROMIS = Patient-Reported Outcomes Measurement Information System, SF = Short Form, VAS = visual analog scale.
aMedian values and interquartile ranges between brackets.
Bold entries indicate p-value < 0.05.
 Figure 3:
 Graphs demonstrating median absolute PROMIS and VAS pain scores with interquartile ranges for patients treated with carbon fiber (CF) or titanium intramedullary nails. PROMIS = Patient-Reported Outcomes Measurement Information System, VAS = visual analog scale.
No difference in differential scores were seen at the 1-month postoperative mark (Table 5). No differences in pain VAS, PROMIS SF Physical, SF Mental, and SF 10a scores were seen between groups. At 6 months postoperatively, both groups displayed higher physical function scores (PROMIS SF Physical and SF 10a) than preoperative scores. One year after surgery, both groups achieved similar levels of pain reduction and physical and mental function.
Table 5 - Differential PROMIS and Pain VAS Scores by Type of Intramedullary Nailing Preoperative to 1-Month Postoperative Preoperative to 3-Month Postoperative Preoperative to 6-Month Postoperative Preoperative to 1-Year Postoperative Carbon fiber Titanium P Carbon fiber Titanium P Carbon fiber Titanium P Carbon fiber Titanium P PROMIS Global Health SF Physicala 2.8 (−2.45, 7.5) 0 (−7.95, 1.8) 0.12 3.75 (0, 9.9) 3.9 (−2.5, 11.4) 0.95 2.65 (0, 5.9) 6.9 (−2.8, 10) 0.87 6.15 (2.8, 18.7) 1.25 (−1.2, 10.85) 0.37 PROMIS Global Health SF Mentala 1.15 (−2.5, 3.85) −2.5 (−10.2, 2.5) 0.38 1.25 (−4.7, 5) 1.25 (0, 5) 0.84 1.35 (−2.5, 4.7) 2.5 (−2.7, 4.8) 0.86 4.1 (−7.3, 27.7) 9.75 (−3.85, 13.4) 0.85 PROMIS Physical Function SF 10aa 0.8 (−5.2, 9.5) 0.2 (−7.6, 4.95) 0.49 0.35 (−4.6, 4.5) 3.6 (−1.5, 6.6) 0.22 7.7 (3.9, 16.1) 6.25 (0.2, 11.1) 0.62 6.15 (0.2, 10.1) 10.1 (−3, 11.9) 0.67 Pain VASa −1 (−3, 0) −1 (−4, 2) 0.88 −5 (−6, −2) −2 (−5, 0) 0.06 −1.5 (−3, 0) −1 (−4, 1) 0.70 −2.5 (−3, −1)
Comments (0)