
Remember me


Opioid medications can be effective pain management tools after total knee arthroplasty (TKA). However, since the beginning of the opioid epidemic in the 1990s, the United States has seen a fivefold increase in overdoses, with approximately 75% of drug overdose deaths in 2020 involving opioids.1 This is due to a myriad of reasons such as misrepresentation of the addictive nature of opioids, pain becoming the “fifth vital sign,” and pain scores being tied to reimbursement.2–4 In response to the growing opioid concern, various medical governing bodies have enacted policies to reduce the volume of prescribed opioids. Notably, orthopaedic surgeons are the third highest prescribers of opioids among physicians in the United States.5 To reduce the risk of opioid abuse in patients, the American Academy of Orthopaedic Surgeons implemented their revisions to pain management guidelines in 2015, which included limiting opioid prescription size, extended-release opioids, and preoperative opioid prescriptions. An analysis by Tan et al6 found that postoperative patients, between 2014 and 2017, may consume less than half of the medication they are prescribed. A separate study found that one-third of TKA patients have preoperative opioid use within 3 months of surgery, which is a strong predicative indicator of increased opioid prescription refills.7 There is also evidence that chronic opioid use is a common occurrence after TKA surgery, especially in patients with a history of psychiatric diagnoses.8 It is also known that opioids in the home increases the risk of opioid overdose of others in the home.9 This study's aim was to identify trends in opioid prescription filling for patients after TKA. We hypothesized that opioid prescription volume would decrease over the study period.
MethodsA retrospective trends analysis was conducted using the PearlDiver (Mariner data set) database (www.pearldiverinc.com; 10435 Marble Creek Circle). The Mariner data set contains over 120 million patients and includes all payer claims information from 2010 to 2020. This includes cash pay, private insurance, Medicare, Medicaid, and any other payment form. The PearlDiver database includes records from the United States without geographic limitation and includes all claims regardless of provider type. Patient records were selected using the International Classification of Disease (ICD), Common Procedural Terminology, Uniform System of Classification, and codes specific to PearlDiver. Codes used are provided in Supplemental Appendix (https://links.lww.com/JG9/A343) for reference. This study was institutional review board exempt because the database only permits the extraction of deidentified patient information.
Selection CriteriaPatients were selected using Common Procedural Terminology, ICD-9, and ICD-10 codes who underwent primary TKA between 2010 and 2019 met initial inclusion criteria. Patients with history of anxiety disorders, mood disorders, personality disorders, psychotic disorders, chronic pain, neoplastic pain, complex regional pain, central pain syndrome, psychosis, dementia, drug abuse, drug dependence, or opioid use 6 months before TKA were excluded in an effort to select patients at lower risk of chronic opioid use.10–13 Follow-up periods of 30 days, 90 days, and 1 year after TKA were chosen to elicit short-term and long-term use of medications. Medications were broken into two categories: (1) opioids and (2) nonopioids. Nonopioids consisted of nonsteroidal anti-inflammatory medications (celecoxib, diclofenac, ibuprofen, ketorolac, meloxicam, and naproxen) and gabapentinoids (gabapentin and pregabalin) with their associated brand names as well. Of note, these claims represent prescriptions filled, including refills, and do not include the total number of prescriptions written or consumption of medications and will be referred to as prescriptions.
AnalysisAnnual prescription prevalence rates (patient records with prescription/total patient records included) were calculated for opioids and nonopioids at 1 to 30 days (30 days), 31 to 90 days (90 days), and 91 to 365 days (1 year). These were calculated for each year (2010 to 2019). Average daily milligram morphine equivalents (MME) were also calculated for the filled prescriptions within the 30- and 90-day periods. Linear regression and CAGR ((Y2/Y1)1/(Y2 − Y1) − 1; Y1 = first year of the analysis, Y2 = final year) were calculated to analyze trends in prescriptions from 2010 to 2015, 2016 to 2019, and 2010 to 2019. The year 2016 was used as a proxy for the implementation of new guidelines. A P value of <0.05 was considered significant. PearlDiver does not report patient records with less than 11 claims to protect privacy.
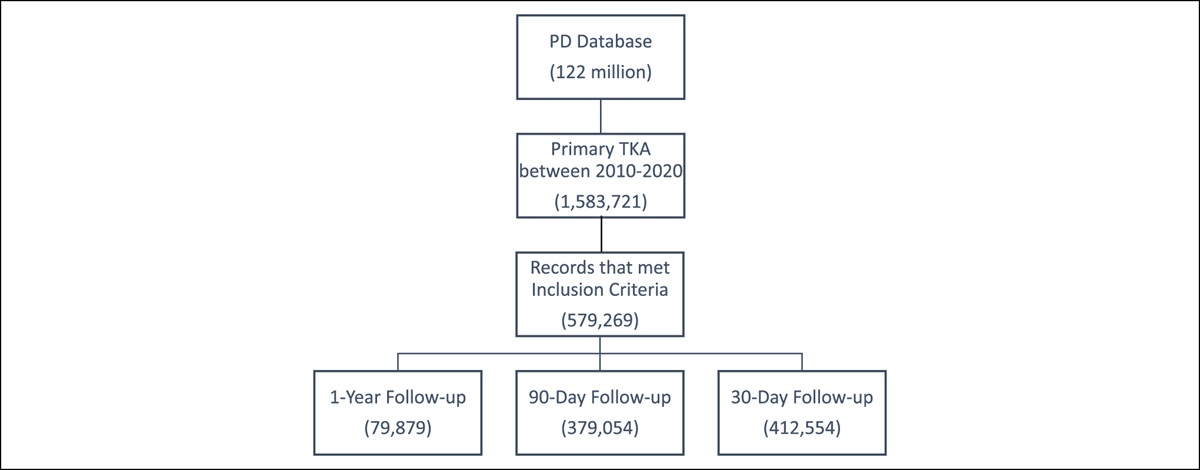
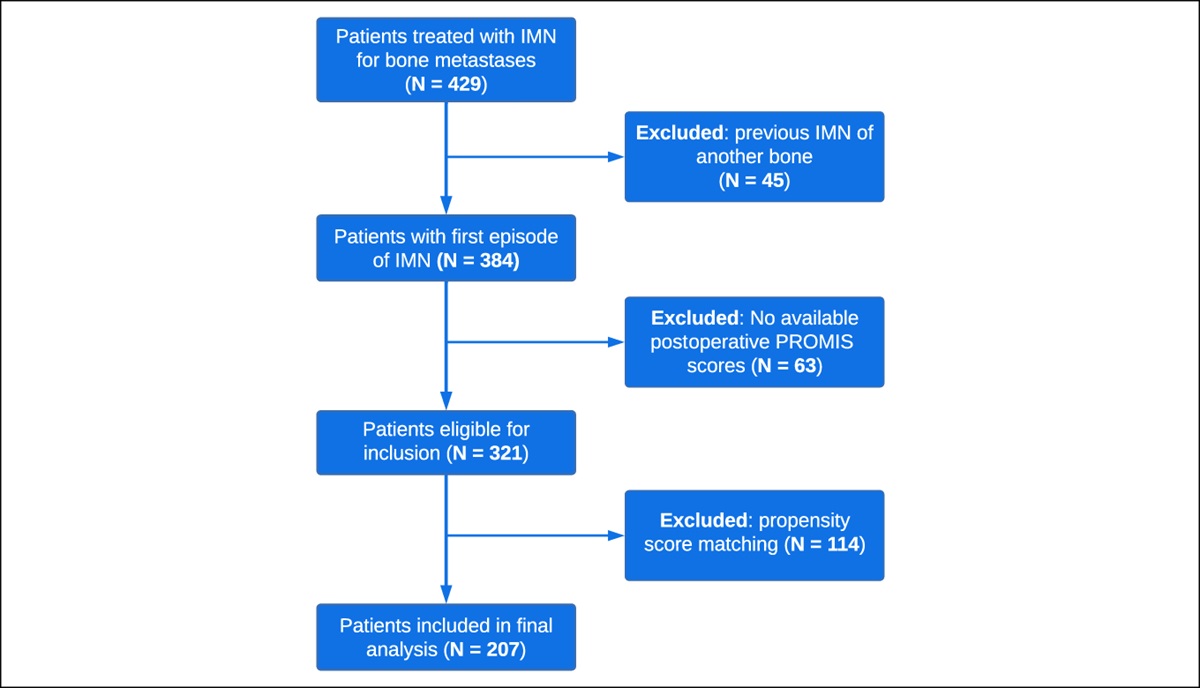
ResultsIn total, 579,269 patients underwent TKA between 2010 and 2019 and met our inclusion criteria. Of these, 412,554 patients had follow-up for 30 days, 379,054 patients had follow-up for 90 days, and 79,879 patients had follow-up for 1 year (Figure 1).
 Figure 1:
 Flowchart of selection of the study population with appropriate follow-up within the PearlDiver database.
30-Day Prescription Claim RatesBetween 2010 and 2015, prescriptions for opioids (P = 0.004) and nonopioids (P < 0.001) significantly increased after TKA, with CAGR of 5.56% and 17.98%, respectively. After 2016, only nonopioid prescriptions showed a significant increase (P = 0.018; CAGR = 12.21%) while opioid prescriptions showed no significant trends (P = 0.489). Overall trends from 2010 to 2019 showed significant increased utilization for opioids (P < 0.001; CAGR = 3.54%) and nonopioids (P < 0.001; CAGR = 15.50%) (Table 1, Figure 2).
Table 1 - Annual Prevalence (2010 to 2019) and Trends of Filled Opioid and Nonopioid Prescriptions Within 30 Days After Total Knee Arthroplasty Year Opioid Nonopioid n % n % 2010 37,546 45.31% 5,561 6.71% 2011 30,393 52.64% 5,383 9.32% 2012 28,199 53.53% 5,407 10.26% 2013 29,489 56.89% 6,271 12.10% 2014 27,611 59.04% 6,455 13.80% 2015 29,178 59.64% 7,504 15.34% 2016 38,777 60.81% 11,078 17.37% 2017 34,458 59.96% 10,700 18.62% 2018 34,361 60.24% 12,141 21.29% 2019 37,276 61.95% 14,766 24.54% P-value 2010-2015 0.004 <0.001 2016-2019 0.489 0.018 2010-2019 <0.001 <0.001 CAGR 2010-2015 5.65% 17.98% 2016-2019 0.62% 12.21% 2010-2019 3.54% 15.50%P values <0.05 bolded for significance and correlating compound annual growth rates (CAGRs).
 Figure 2:
 Graph showing annual rates of filled prescriptions for opioids and nonopioids within 30 days of TKA from 2010 to 2019. TKA = total knee arthroplasty
Trends in the average daily MME significantly decreased between all time points: 2010 to 2015 (P = 0.038; CAGR = −4.44%), 2016 to 2019 (P < 0.001; CAGR = −5.23%), and 2010 to 2019 (P < 0.001; CAGR = −4.21%) (Table 2).
Table 2 - Daily Average Milligram Morphine Equivalents and Trends From 2010 to 2019 of Filled Prescriptions Within 30 Days After Total Knee Arthroplasty Year MME SD 2010 55.06 46.37 2011 46.98 41.36 2012 45.78 42.17 2013 44.71 39.82 2014 43.85 38.13 2015 43.87 39.12 2016 43.93 41.24 2017 41.86 37.63 2018 39.61 37.61 2019 37.39 33.17 P-value 2010-2015 0.038 0.021 2016-2019 <0.001 0.052 2010-2019 <0.001 0.001 CAGR 2010-2015 −4.44% −3.34% 2016-2019 −5.23% −7.00% 2010-2019 −4.21% −3.65%MME = milligram morphine equivalent
P values <0.05 bolded for significance and correlating compound annual growth rates (CAGRs).
Nonopioid prescriptions increased significantly from 2010 to 2015 (P < 0.001; CAGR = 11.34%) while trends for opioids were not significant (P = 0.212). Trends between 2016 and 2019 for opioids significantly decreased (P < 0.001; CAGR = −13.53%) while trends for nonopioids did not show significance. Overall trends between 2010 and 2019 were significant for decreasing rates of opioids (P = 0.013; CAGR = −4.42) and increasing rates of nonopioids (P < 0.001; CAGR = 7.95%) (Table 3, Figure 3).
Table 3 - Annual Prevalence (2010 to 2019) and Trends of Filled Opioid and Nonopioid Prescriptions Within 90 Days After Total Knee Arthroplasty Year Opioid Nonopioid n % n % 2010 38,246 46.15% 10,194 12.30% 2011 29,818 51.64% 8,892 15.40% 2012 27,111 51.46% 8,848 16.80% 2013 27,623 53.29% 9,852 19.01% 2014 24,815 53.06% 9,452 20.21% 2015 24,865 50.83% 10,297 21.05% 2016 30,290 47.50% 14,239 22.33% 2017 24,151 42.02% 12,631 21.98% 2018 20,940 36.71% 13,573 23.80% 2019 18,480 30.71% 14,737 24.49% P-value 2010-2015 0.212 <0.001 2016-2019 <0.001 0.103 2010-2019 0.013 <0.001 CAGR 2010-2015 1.95% 11.34% 2016-2019 −13.53% 3.13% 2010-2019 −4.42% 7.95%P values <0.05 bolded for significance and correlating compound annual growth rates (CAGRs).
 Figure 3:
 Graph showing annual rates of filled prescriptions for opioids and nonopioids within 90 days of TKA from 2010 to 2019. TKA = total knee arthroplasty
Average daily MME significantly decreased across all time points: 2010 to 2015 (P = 0.038; CAGR = −4.44%), 2016 to 2019 (P < 0.001; CAGR = −5.26%), and 2010 to 2019 (P < 0.001; CAGR = −4.22%) (Table 4).
Table 4 - Daily Average Milligram Morphine Equivalents and Trends From 2010 to 2019 of Filled Prescriptions Within 90 Days After Total Knee Arthroplasty Year MME SD 2010 55.13 46.44 2011 47.04 41.45 2012 45.82 42.26 2013 44.75 39.9 2014 43.88 38.18 2015 43.92 39.2 2016 43.98 41.31 2017 41.91 37.71 2018 39.85 37.69 2019 37.40 33.23 P-value 2010-2015 0.038 0.021 2016-2019 <0.001 0.052 2010-2019 <0.001 0.001 CAGR 2010-2015 −4.44% −3.33% 2016-2019 −5.26% −7.00% 2010-2019 −4.22% −3.65%MME = milligram morphine equivalent
P values <0.05 bolded for significance and correlating compound annual growth rates (CAGRs).
Trends for opioid prescriptions from 2010 to 2015 significantly decreased (P = 0.032; CAGR = −12.72%) while nonopioid trends were not significant (P = 0.320). Neither opioids (P = 0.316) nor nonopioid (P = 0.121) trends were significant from 2016 to 2019. Trends from 2010 to 2019 significantly decreased for both opioids (P = 0.001; CAGR = −10.92%) and nonopioids (P = 0.003; CAGR = −2.12%) (Table 5, Figure 4).
Table 5 - Annual Prevalence (2010 to 2019) and Trends of Filled Opioid and Nonopioid Prescriptions Within 1 Year After Total Knee Arthroplasty Year Opioid Nonopioid n % n % 2010 6,317 7.62% 9,820 11.85% 2011 2,802 4.85% 6,243 10.81% 2012 2,633 5.00% 5,810 11.03% 2013 2,449 4.72% 5,761 11.11% 2014 1,893 4.05% 5,153 11.02% 2015 1,889 3.86% 5,419 11.08% 2016 2,097 3.29% 6,624 10.39% 2017 1,741 3.03% 5,812 10.11% 2018 1,724 3.02% 5,692 9.98% P-value 2010-2015 0.032 0.320 2016-2019 0.316 0.121 2010-2019 0.001 0.003 CAGR 2010-2015 −12.72% −1.34% 2016-2019 −4.13% −1.99% 2010-2019 −10.92% −2.12%P values <0.05 bolded for significance and correlating compound annual growth rates (CAGRs).
 Figure 4:
 Graph showing annual rates of filled prescriptions for opioids and nonopioids within 1 year of TKA from 2010 to 2018. TKA = total knee arthroplasty
DiscussionUsing a national claims database, this study found varying trends in postoperative TKA opioid utilization from 2010 to 2019. The PearlDiver insurance database allowed for selection of anonymized patient data based on history of psychiatric diagnoses, prescription medication history, and mental health history (Figure 1), which enabled better examination of the risk of prolonged use of opioids after TKA. Between 2010 and 2019, three distinct time frames were analyzed after TKA: 30 days, 90 days, and 1 year postoperatively. At 30 days postoperatively, average opioid prescriptions increased until 2015 before flattening while nonopioids prescriptions continued to increase across all years analyzed. Ninety-day opioid prescriptions showed no notable trends from 2010 to 2015 but decreased markedly after 2015. For the same 90-day postoperative period, nonopioid prescriptions increased from 2010 to 2015 and then flattened. At 1 year postoperatively, average opioid prescriptions decreased leading up to 2016 before leveling out; a similar pattern was observed in nonopioid prescriptions.
The linear regression of MME at 30 days postoperatively annually was 0.35% less than that of the linear regression of MME at 90 days postoperatively annually, indicating the reduction in opioids was relatively consistent from 30 to 90 days postoperatively. This is possibly explained by stable pain trajectories after TKA were seen in the same 30- and 90-day periods in an analysis by Dumenci et al,14 particularly in patients with poor surgical outcomes.
At 30 days postoperatively, the rate of opioid prescriptions increased until 2015 and then plateaued while nonopioid prescriptions continued to increase. This timing demonstrates that the change in American Academy of Orthopaedic Surgeons protocol may have affected physician prescribing behaviors. Two studies by Reid et al analyzed data from 2016 to 2017 on the impact of state-level legislation in Rhode Island on limiting opioid distribution after orthopaedic procedures and found notable year-over-year reduction in initial and 30-day postoperative opioid prescriptions after such laws went into place after spine surgery and a >50% decrease in the number of opioid pills prescribed after six common orthopaedic procedures.15,16 This varies from our findings that show a plateau in opioid prescriptions was reduced after 2016 rather than a year-over-year decrease in rates of opioid prescriptions. One likely explanation for the discrepant data could be because of the small population of Rhode Island, and its effect was negligible given this study's nationwide database used. Regardless, legislation alike also played a role in opioid prescriptions over the study period.
When examining opioid prescriptions at 90 days (Table 3), no clear trend was observed through 2015; however, prescriptions starting in 2016 decreased precipitously in what ended up being a change from 46.15% of patients filling prescriptions at 90 days postoperatively to 30.71%. Conversely, nonopioid prescriptions increased steadily from 2010 to 2016 and then plateaued (Figure 3). This divergence means that a certain number of patients were no longer filling prescriptions for any pain medications—opioid or nonopioid. This finding is noteworthy because it may signify overprescribing of opioids after TKA, which is supported by a study by Etcheson et al17 who found no association between total opioid consumption after TKA and factors like patient's pain management satisfaction or overall hospital rating.
At 1 year postoperative opioid prescriptions decreased before 2016 and then flattened. For this period, both nonopioid and opioid prescription claims leveled out after 2016. Approximately 3% of TKA patients who were prescribed opioids continued to refill their prescription at and beyond 1 year. This differs from findings in a study by Cook et al,18 where 13% of TKA patients with no history of opioid use 6 months before surgery continued to fill prescriptions 1 year after surgery. Of course, there are other factors that influence postoperative pain for which data were not examined in our retrospective study. Among these factors is surgical time, where longer tourniquet time has previously been correlated with persistent opioid use after TKA.19 Other factors include sex, age (at the time of surgery), mental health history, and preoperative opioid use.20
There are many variables that affect patient experience and outcome, and guidelines and regulations were not implemented in a vacuum. With the increased profile of opioids addictive chemistry, perioperative anesthesia techniques (regional and spinal anesthesia) and multimodal pain management have received growing support in multiple areas of medicine. A 2014 randomized controlled trial by Lamplot et al studying multimodal pain management in TKA patients found that the multimodal approach which targeted peripheral and central pathways resulted in notable improvements in patients' satisfaction and speed of rehabilitation while at the same time decreasing utilization of opioids.21 This study contributes evidence toward a movement promoting multimodal pain management as the standard of care, in turn reducing dependence on opioids.
This examination of insurance claims data relies on provider coding and proper billing habits of institutions. The database cannot be used to determine from which provider the prescriptions originated from. While prescriptions filled less than 30 days after TKA were more likely to be prescribed by an orthopaedic provider, this could not be ascertained from PearlDiver. Another limitation is that many nonopioids can be bought over the counter and could not be assessed because only prescribed medications would show up in the PearlDiver database. Pain was also not able to be assessed in this analysis. Regardless, the data provided helps assess prescription practices after TKA. While the data presented here does not include dose, drug, prescription length, or consumption of opioids by patients, it does highlight the decreasing volume of circulating opioids after TKA.
ConclusionThis study's analysis found a trend of reduced MME filled after TKA within 30 and 90 days postoperatively. Current trends of opioid prescriptions filled are stable at 30 days and decreasing at 90 days and 1 year. Nonopioids are also being increasingly used within 30 days of TKA while chronic use of both opioids and nonopioids after TKA are reducing greatly. While these findings are impactful to the opioid epidemic, there are limitations to what these patterns can be attributed to. Factors such as societal or governmental guidelines, physician awareness about the opioid epidemic and the resulting changes in prescribing behavior, and local legislation on prescribing opioids influence prescriptions over the period studied. Additional analysis, while accounting for these factors, is needed to determine which methods had the greatest effect on combating the opioid epidemic.
References 1. Centers for Disease Control and Prevention, NC for IP and C. Atlanta, GA: Understanding the Opioid Overdose Epidemic, 2021. 2. Centers for Medicare & Medicaid Services. Baltimore, MD: HCAHPS Facts, 2008. 3. Veterans Health Administration: Pain as the 5th Vital Sign Toolkit. Washington, DC: Geriatrics and Extended Care Strategic Healthcare Group National Pain Management Coordinating Committee, 2000. 4. Max MB: Quality improvement guidelines for the treatment of acute pain and cancer pain. JAMA 1995;274:1874-1880. 5. Morris BJ, Mir HR: The opioid epidemic: Impact on orthopaedic surgery. J Am Acad Orthop Surg 2015;23:267-271. 6. Tan WH, Yu J, Feaman S, et al.: Opioid medication use in the surgical patient: An assessment of prescribing patterns and use. J Am Coll Surg 2018;227:203-211. 7. Bedard NA, Pugely AJ, Westermann RW, Duchman KR, Glass NA, Callaghan JJ: Opioid use after total knee arthroplasty: Trends and risk factors for prolonged use. J Arthroplasty 2017;32:2390-2394. 8. Ward R, Taber D, Gonzales H, et al.: Risk factors and trajectories of opioid use following total knee replacement. Knee Surg Relat Res 2022;34:18. 9. Khan NF, Bateman BT, Landon JE, Gagne JJ: Association of opioid overdose with opioid prescriptions to family members. JAMA Intern Med 2019;179:1186-1192. 10. Sun EC, Darnall BD, Baker LC, Mackey S: Incidence of and risk factors for chronic opioid use among opioid-naive patients in the postoperative period. JAMA Intern Med 2016;176:1286-1293. 11. Sullivan MD: Depression effects on long-term prescription opioid use, abuse, and addiction. Clin J Pain 2018;34:878-884. 12. Bhattacharjee S, Jordan B, Sohn A, et al.: Chronic preoperative opioids are associated with revision after rotator cuff repair. Arthrosc J Arthroscopic Relat Surg 2021;37:1110-1114.e5. 13. Lindberg MF, Miaskowski C, Rustøen T, Cooper BA, Aamodt A, Lerdal A: Preoperative risk factors associated with chronic pain profiles following total knee arthroplasty. Eur J Pain 2021;25:680-692. 14. Dumenci L, Perera RA, Keefe FJ, et al.: Model-based pain and function outcome trajectory types for patients undergoing knee arthroplasty: A secondary analysis from a randomized clinical trial. Osteoarthritis Cartilage 2019;27:878-884. 15. Reid DBC, Shah KN, Ruddell JH, et al.: Effect of narcotic prescription limiting legislation on opioid utilization following lumbar spine surgery. Spine J 2019;19:717-725. 16. Reid DBC, Shah KN, Shapiro BH, Ruddell JH, Akelman E, Daniels AH: Mandatory prescription limits and opioid utilization following orthopaedic surgery. J Bone Joint Surg 2019;101:e43.
Comments (0)